Next, you will be using Excel (or Google Sheet) to create a scatter graph of the change in IQ over time for each measured group.
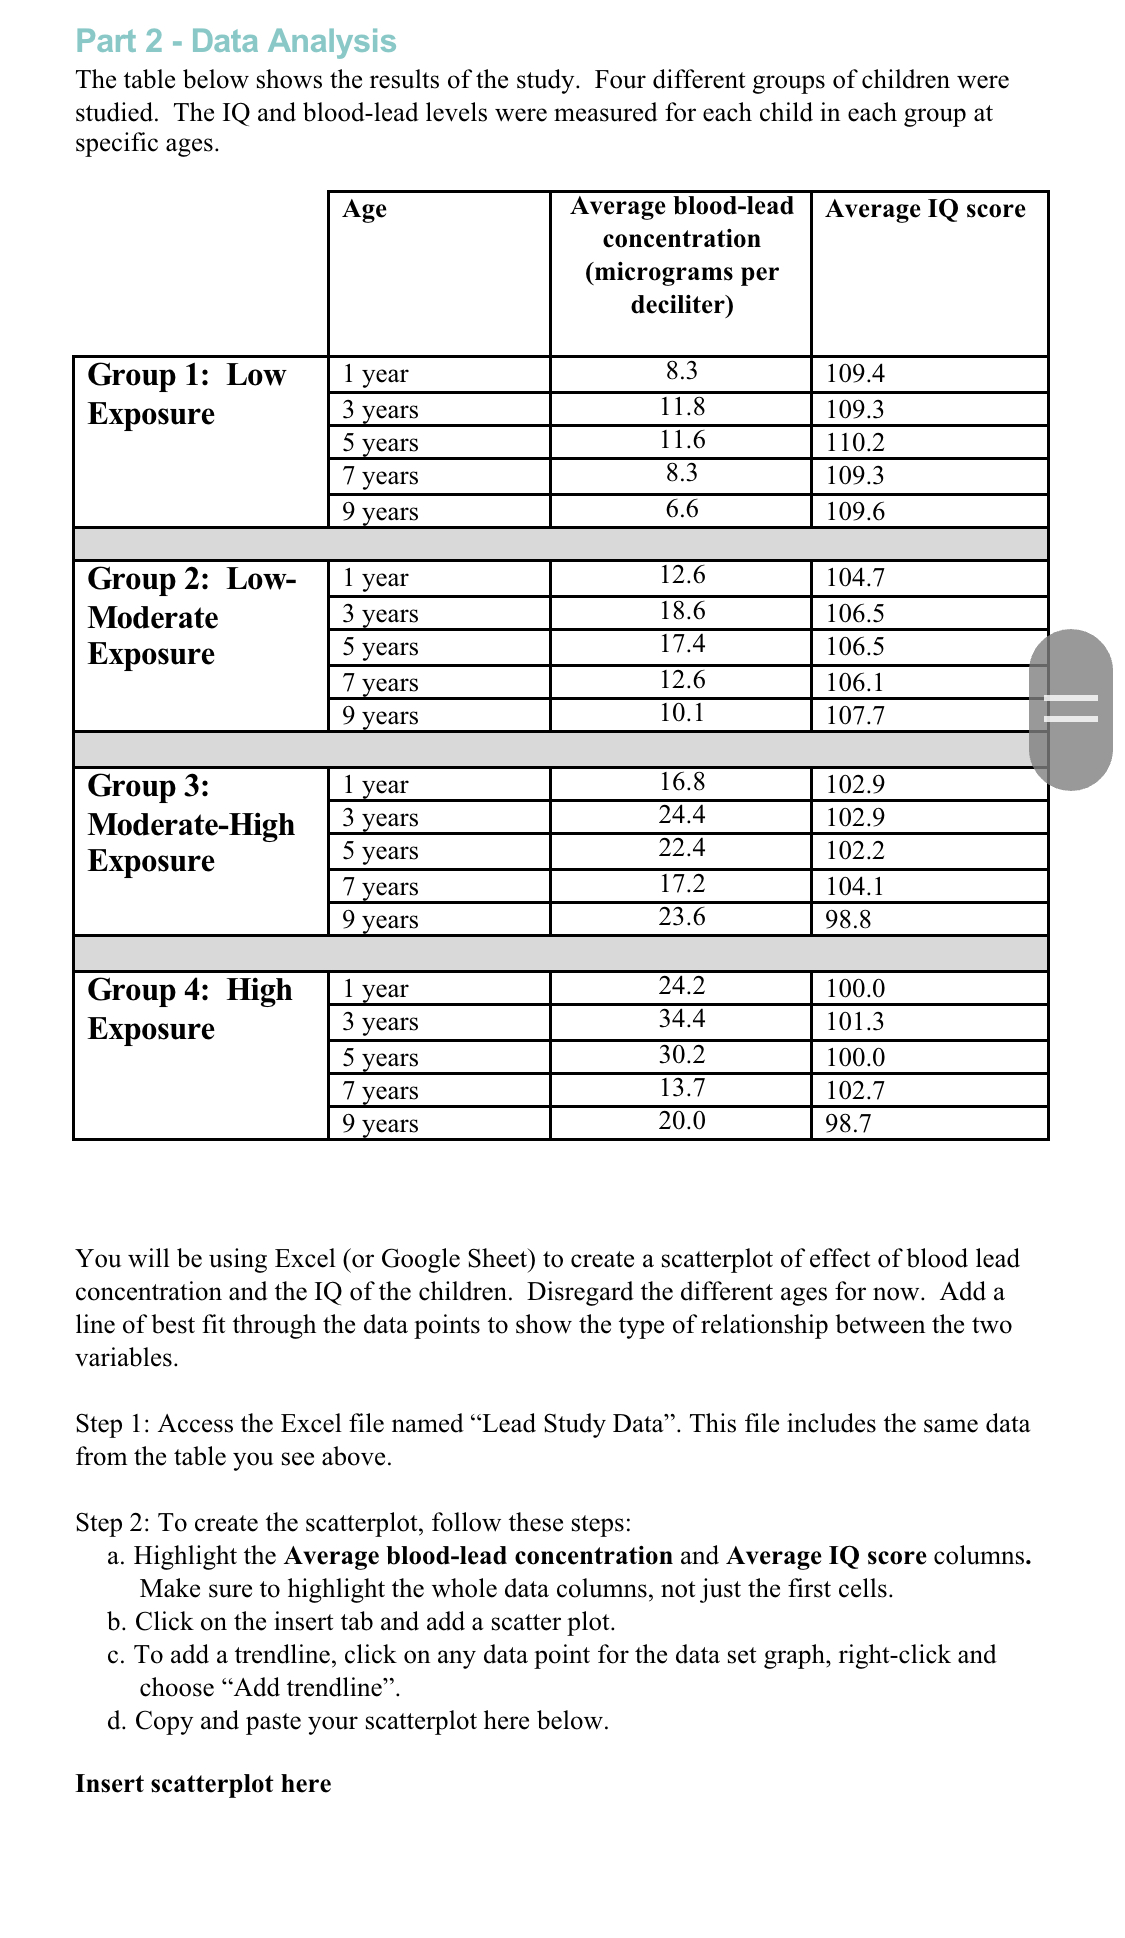
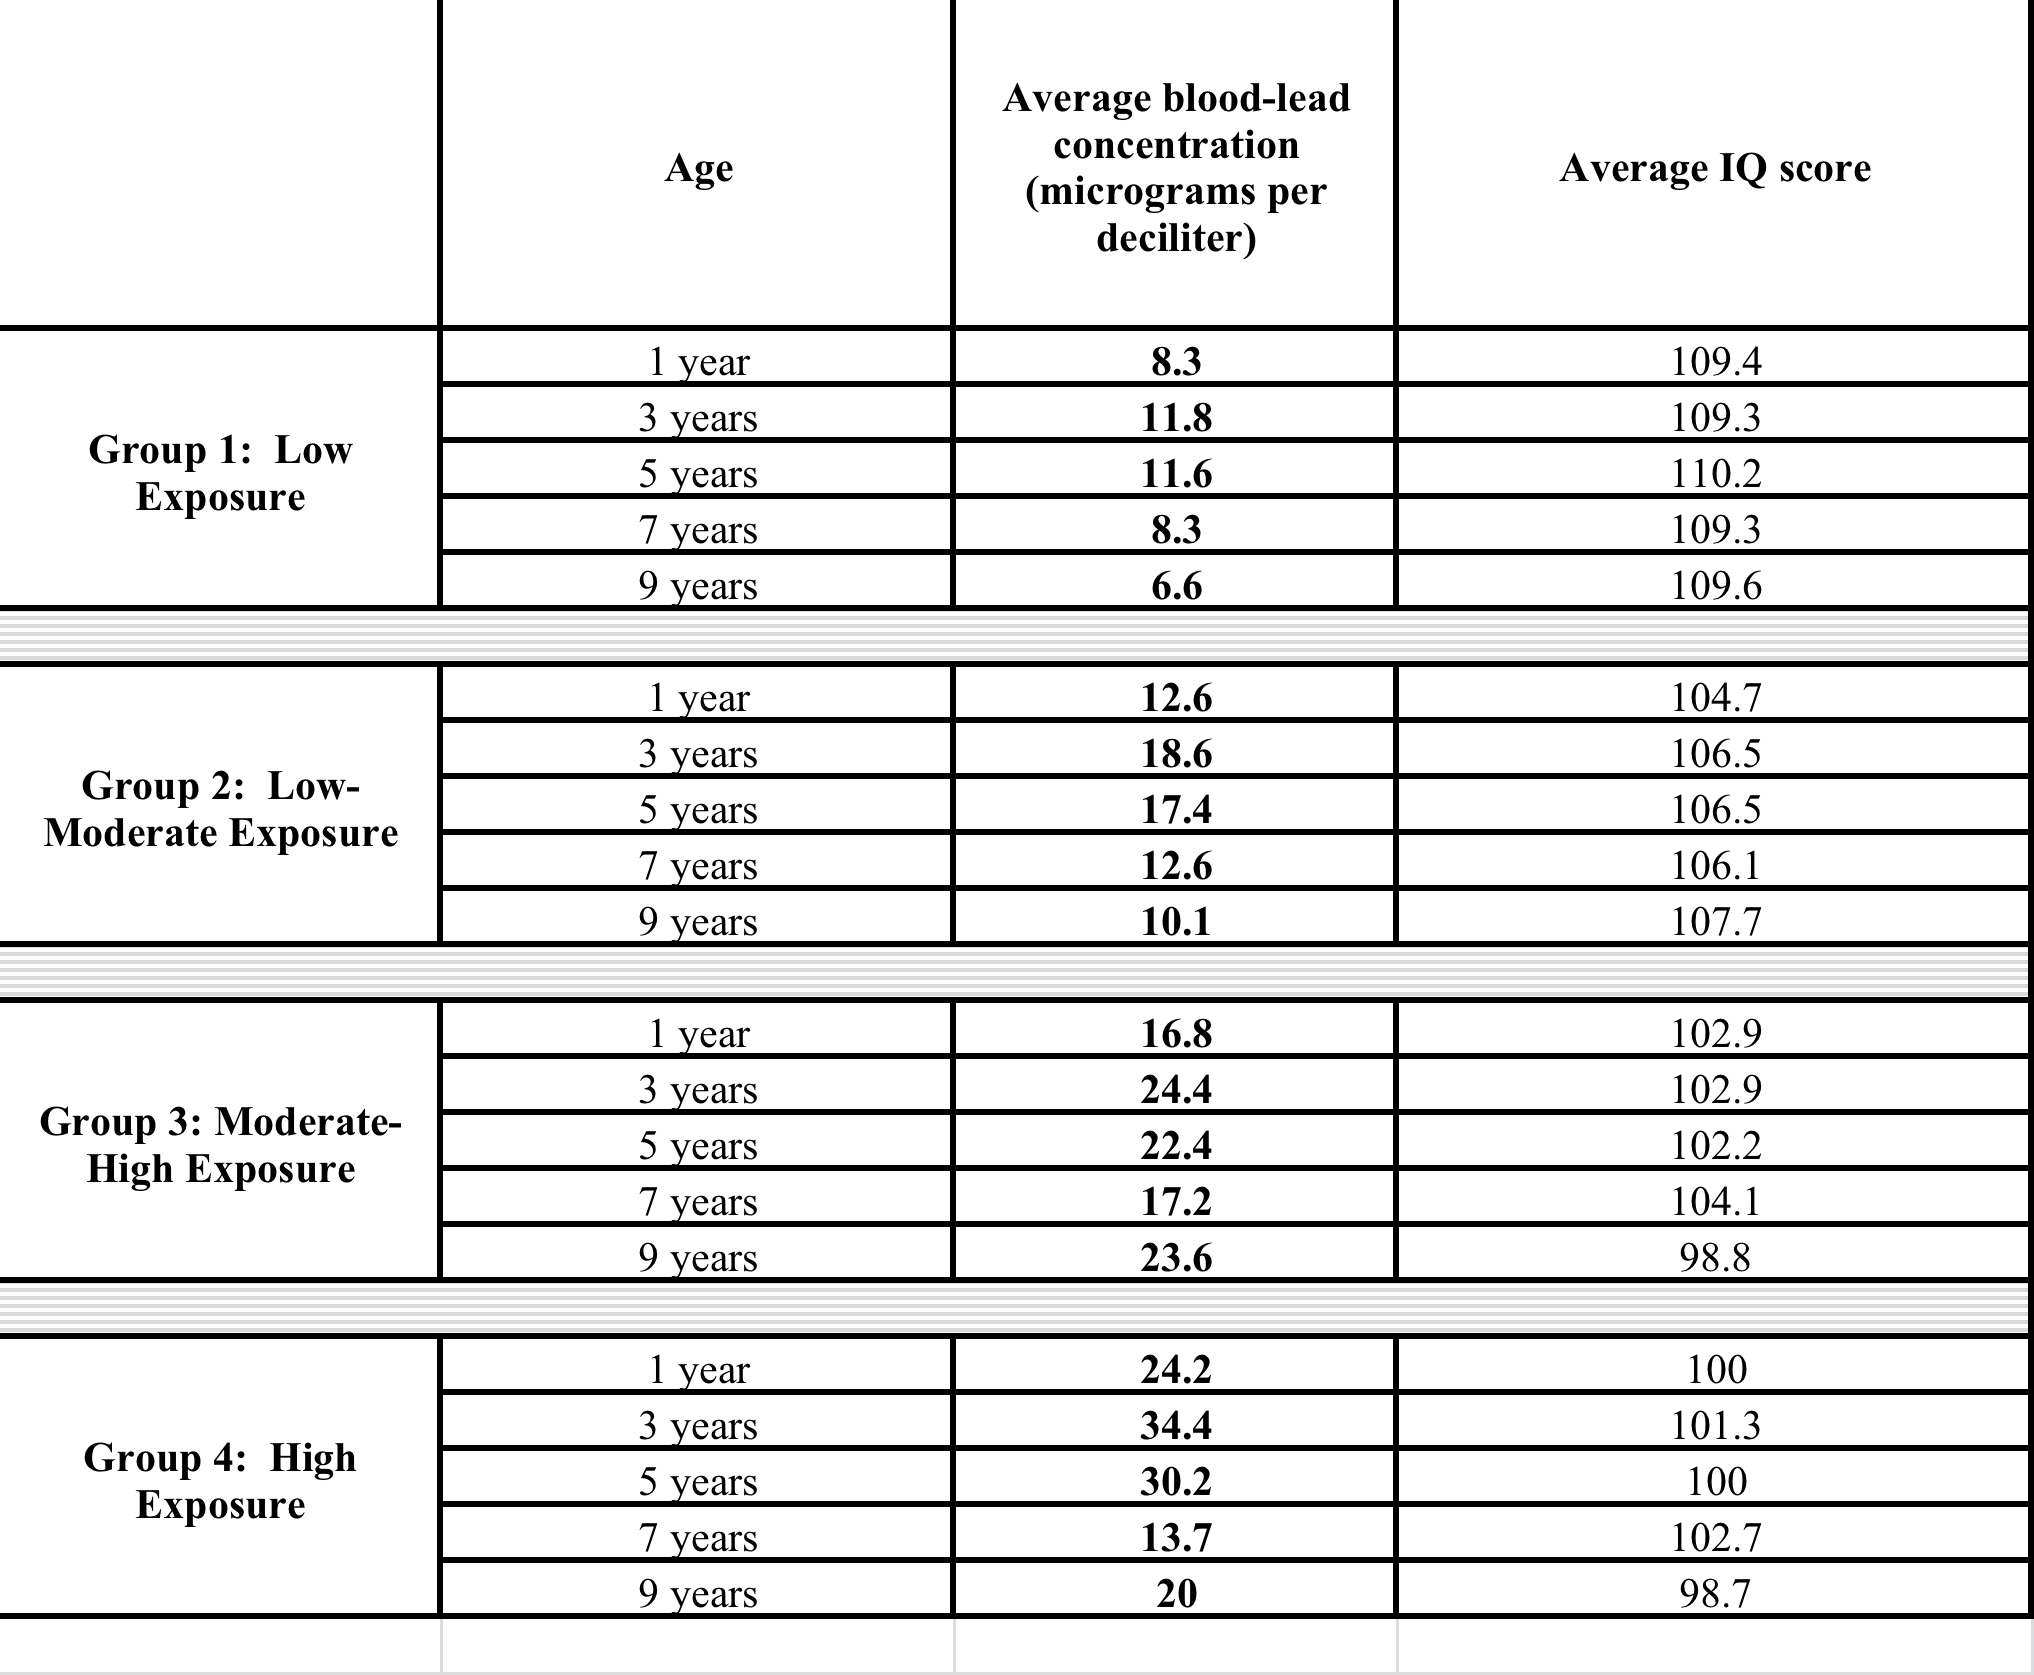
Next, you will be using Excel (or Google Sheet) to create a scatter graph of the change in IQ over time for each measured group. In this case, age will go on the x-axis and IQ will go on the y-axis. Step 1: Access the Excel le named \"Lead Study Data\". This le includes the same data from the table you see above. Step 2: To create the line graph for each group, follow these steps: a. Highlight the \"Age\" and Average IQ score corresponding to group 1 only columns. b. Click on the insert tab and choose scatter with smooth lines markers. c. Right click anywhere on the graph you just created and choose \"Select Data\" d. Click on the \"+\" button to add a new series. e. You will be adding a line plot for Group 2. Choose the age (column for group 2) for the xvalues and Average IQ score for group 2 for the y-values. Make sure you are choosing the data for group 2 only. f. Repeat step \"ce\" for groups 3 and 4. g. You should have one graph with 4 different data lines. h. To be able to analyze the graph better, you need to reduce the range of the y-axis. Since there are no IQ values less than 98, we'll change the lowest range to 98 and the highest range to 112. a. Click on the yaxis. A menu called \"Format axis\" should show up on Excel to the left. b. Choose the \"Axis options\" tab, this one is represented by a bar graph symbol. c. Under \"Bounds\" (rst thing you see) change the minimum to 98 and the maximum to 112. This will make you line graphs larger, and you'll be able to read the graph easier. 1. Copy and paste your line here below. Insert Line graph here Part 2 - Data Analysis The table below shows the results of the study. Four different groups of children were studied. The IQ and bloodlead levels were measured for each child in each group at specic ages. Average blood-lead Average IQ score concentration (micrograms per deciliter) Group 1: Low Exposure Group 2: Low- Moderate Exposure Group 3: Moderate-High Exposure Group 4: High Exposure You will be using Excel (or Google Sheet) to create a scatterplot of effect of blood lead concentration and the IQ of the children. Disregard the different ages for now. Add a line of best t through the data points to show the type of relationship between the two variables. Step 1: Access the Excel le named \"Lead Study Data\". This le includes the same data from the table you see above. Step 2: To create the scatterplot, follow these steps: a. Highlight the Average blood-lead concentration and Average IQ score columns. Make sure to highlight the whole data columns, not just the rst cells. b. Click on the insert tab and add a scatter plot. 0. To add a trendline, click on any data point for the data set graph, rightclick and choose \"Add trendline\". d. Copy and paste your scatterplot here below. Insert scatterplot here Average blood-lead Age concentration (micrograms per Average IQ score deciliter) 1 year 8.3 109.4 3 years 11.8 109.3 Group 1: Low Exposure 5 years 11.6 110.2 7 years 8.3 109.3 9 years 6.6 109.6 1 year 12.6 104.7 3 years 18.6 106.5 Group 2: Low- Moderate Exposure 5 years 17.4 106.5 7 years 12.6 106.1 9 years 10.1 107.7 1 year 16.8 102.9 3 years 24.4 102.9 Group 3: Moderate- High Exposure 5 years 22.4 102.2 7 years 17.2 104.1 9 years 23.6 98.8 1 year 24.2 100 3 years 34.4 101.3 Group 4: High 5 years Exposure 30.2 100 7 years 13.7 102.7 9 years 20 98.7
Step by Step Solution
There are 3 Steps involved in it
Step: 1
Get Instant Access to Expert-Tailored Solutions
See step-by-step solutions with expert insights and AI powered tools for academic success
Step: 2
Step: 3
Ace Your Homework with AI
Get the answers you need in no time with our AI-driven, step-by-step assistance