ng.cengage.com C + 5 Getting Started - Th.. A Week 1 - Assignment MindTap - Cengage Learning C Excel Online Student Work A Student Portal
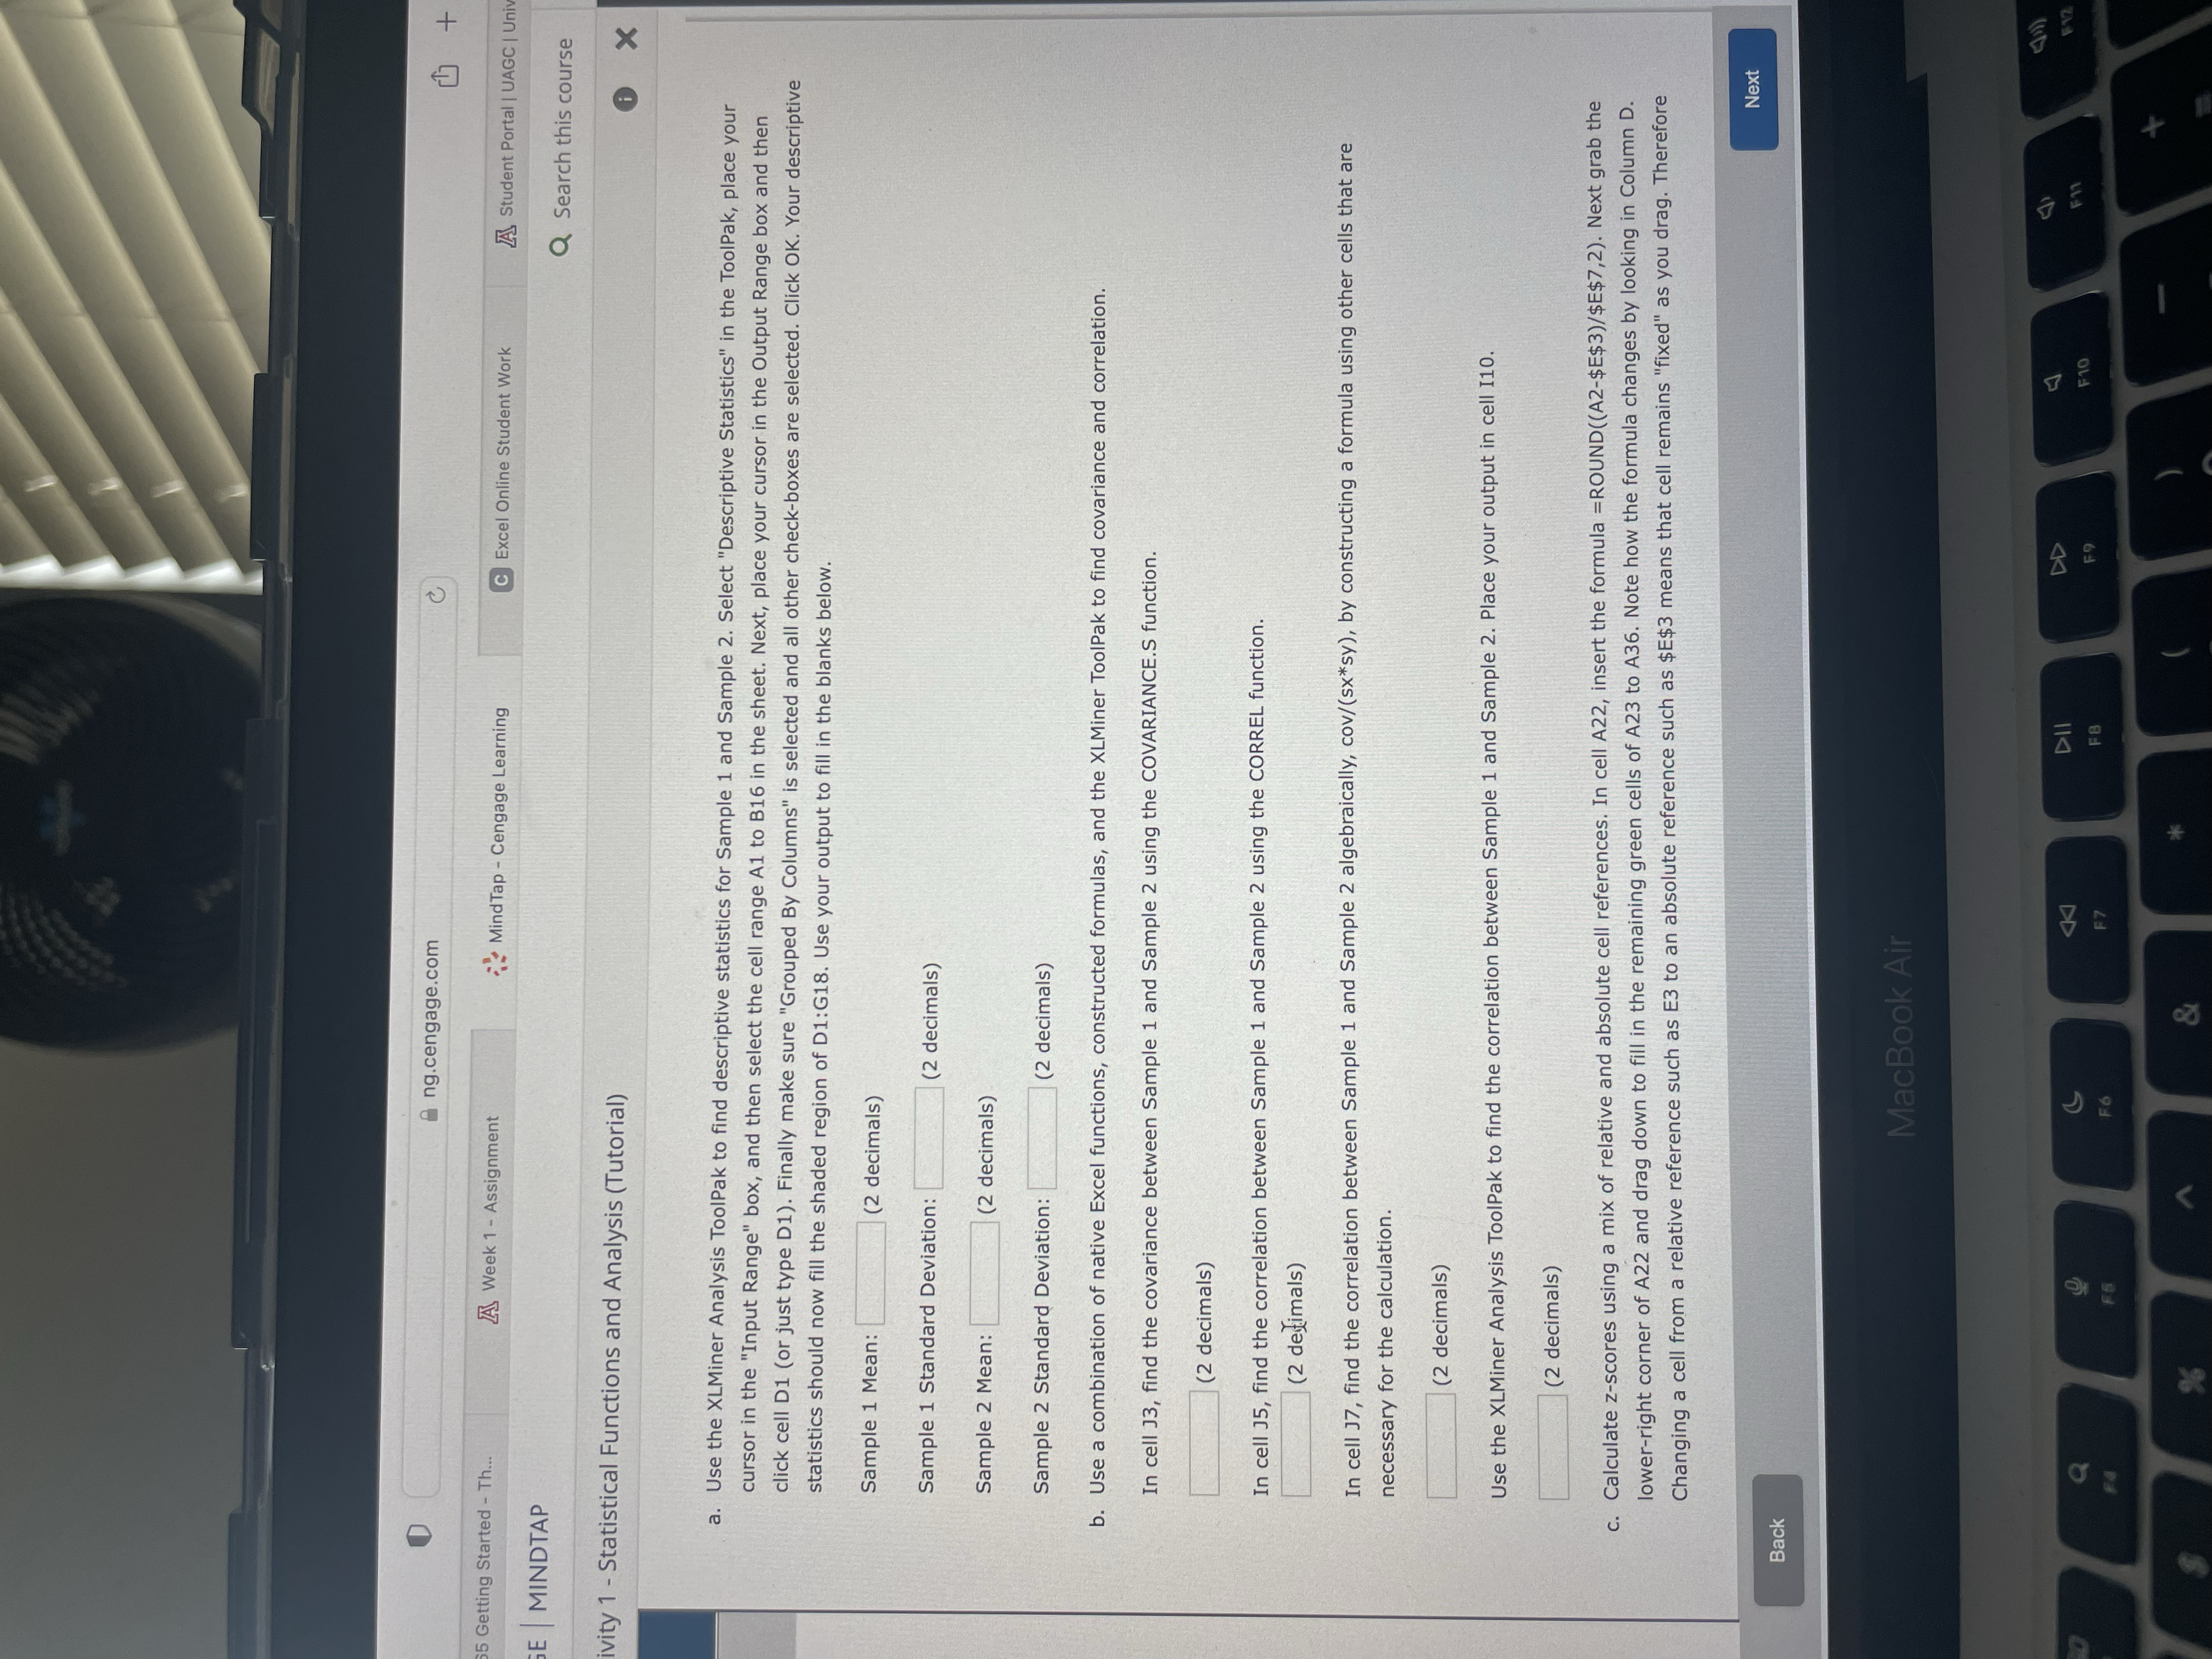
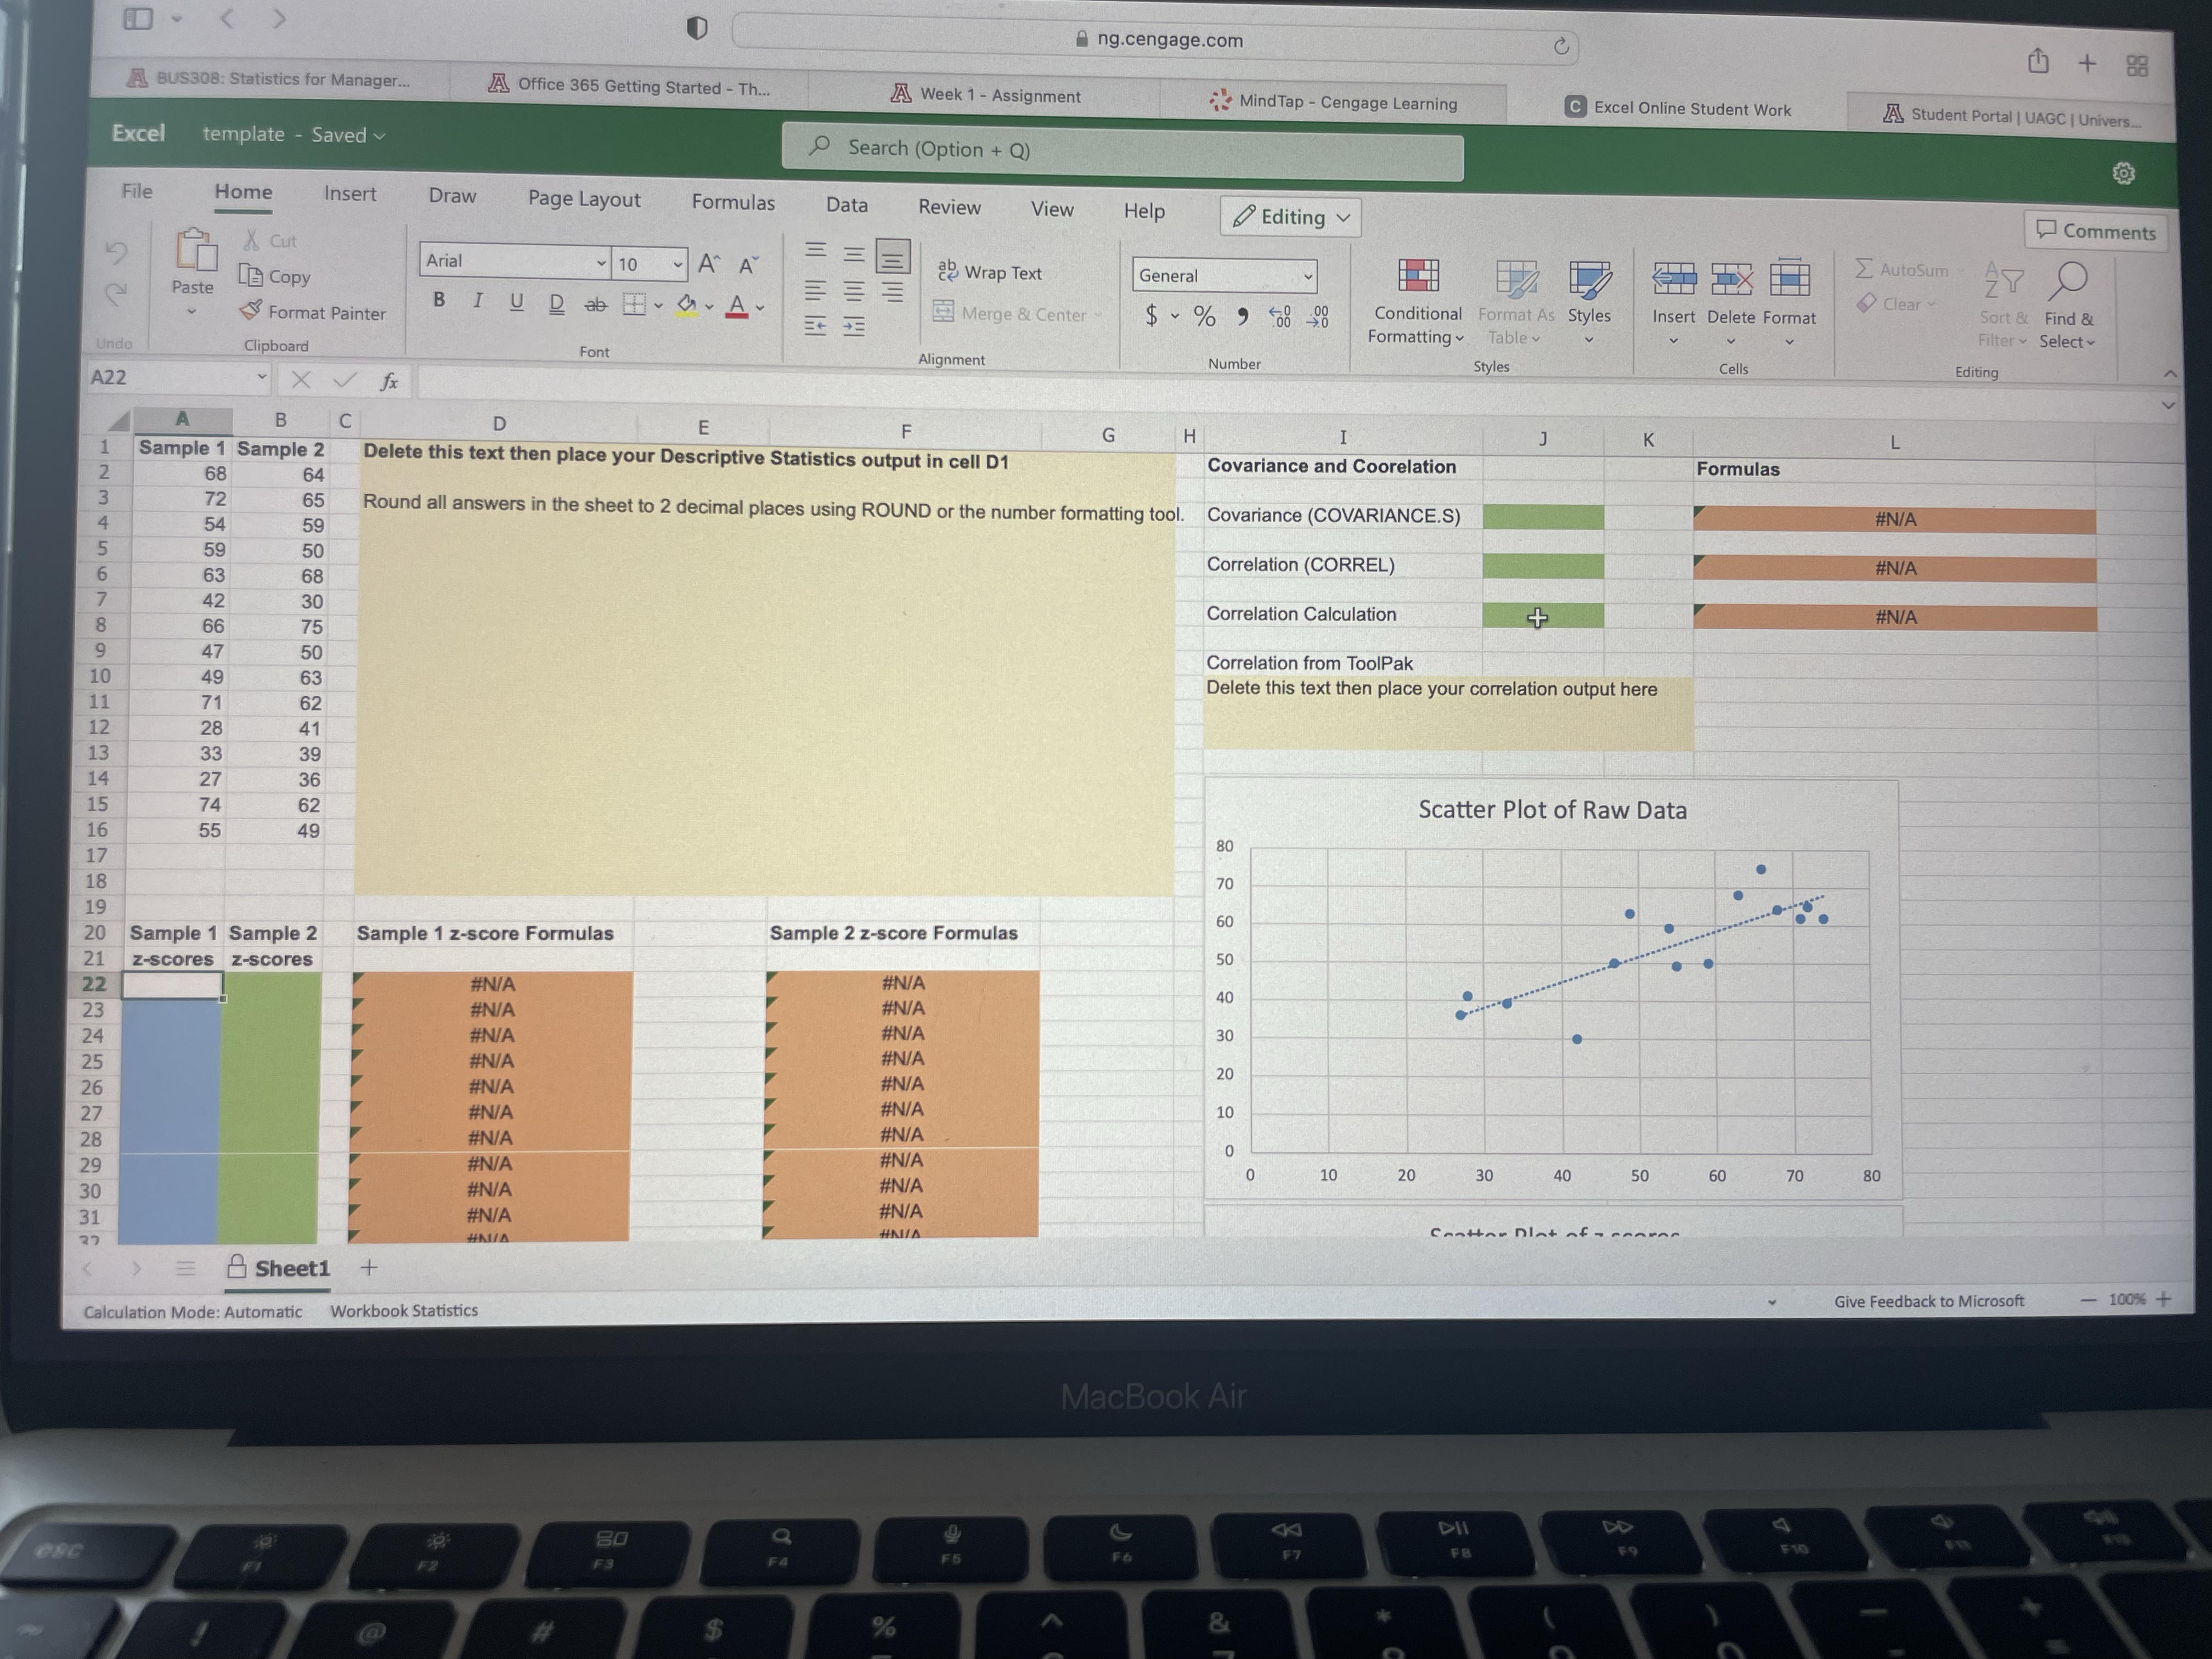
ng.cengage.com C + 5 Getting Started - Th.. A Week 1 - Assignment "MindTap - Cengage Learning C Excel Online Student Work A Student Portal | UAGC | Uni E MINDTAP Q Search this course vity 1 - Statistical Functions and Analysis (Tutorial) X a. Use the XLMiner Analysis ToolPak to find descriptive statistics for Sample 1 and Sample 2. Select "Descriptive Statistics" in the ToolPak, place your cursor in the "Input Range" box, and then select the cell range Al to B16 in the sheet. Next, place your cursor in the Output Range box and then click cell D1 (or just type D1). Finally make sure "Grouped By Columns" is selected and all other check-boxes are selected. Click OK. Your descriptive statistics should now fill the shaded region of D1: G18. Use your output to fill in the blanks below. Sample 1 Mean: (2 decimals) Sample 1 Standard Deviation: (2 decimals) Sample 2 Mean: (2 decimals) Sample 2 Standard Deviation: (2 decimals) b. Use a combination of native Excel functions, constructed formulas, and the XLMiner ToolPak to find covariance and correlation. In cell J3, find the covariance between Sample 1 and Sample 2 using the COVARIANCE.S function. (2 decimals In cell 35, find the correlation between Sample 1 and Sample 2 using the CORREL function. (2 decimals) In cell 37, find the correlation between Sample 1 and Sample 2 algebraically, cov/(sx*sy), by constructing a formula using other cells that are necessary for the calculation. (2 decimals) Use the XLMiner Analysis ToolPak to find the correlation between Sample 1 and Sample 2. Place your output in cell 110. (2 decimals) c. Calculate z-scores using a mix of relative and absolute cell references. In cell A22, insert the formula =ROUND((A2-$E$3)/$E$7,2). Next grab the lower-right corner of A22 and drag down to fill in the remaining green cells of A23 to A36. Note how the formula changes by looking in Column D. Changing a cell from a relative reference such as E3 to an absolute reference such as $E$3 means that cell remains "fixed" as you drag. Therefore Next Back MacBook Air. ng.cengage.com C + 88 A BUS308: Statistics for Manager.. A Office 365 Getting Started - Th.. A Week 1 - Assignment MindTap - Cengage Learning C Excel Online Student Work A Student Portal | UAGC | Univers.. Excel template - Saved Search (Option + Q) File Home Insert Draw Page Layout Formulas Data Review View Help Editing Comments X Cut Arial = = AutoSum - 10 ~ A" A " ab Wrap Text General [A Copy E Clear Paste BIUDab A. Merge & Center $ ~ % 9 508 98 Conditional Format As Styles nsert Delete Format Sort & Find & Format Painter Formatting Table Filter Select Clipboard Font Alignment Number Styles Cells Editing A22 " X V f* A B C D E G H K L Sample 1 Sample 2 Delete this text then place your Descriptive Statistics output in cell D1 Covariance and Coorelation Formulas 68 64 #N/A 72 65 Round all answers in the sheet to 2 decimal places using ROUND or the number formatting tool. Covariance (COVARIANCE.S) 54 59 59 50 Correlation (CORREL) #N/A 63 68 + #N/A 42 30 Correlation Calculation AWNE SOOO VOULAWN 66 75 47 50 Correlation from ToolPak 10 49 63 Delete this text then place your correlation output here 71 62 28 41 33 39 27 36 Scatter Plot of Raw Data 74 62 16 55 49 80 70 18 19 60 20 Sample 1 Sample 2 Sample 1 z-score Formulas Sample 2 z-score Formulas 50 21 z-scores z-scores #N/A #N/A 22 40 #N/A 23 #N/A #N/A 30 24 #N/A #N/A 25 #N/A 20 #N/A 26 #N/A #N/A 27 #N/A o 6 #N/A #N/A 28 #N/A 10 20 30 40 50 60 70 80 29 #N/A #N/A 30 #N/A #N/A 31 #N/A Canttor Dlot of- cancer HALIA Sheet1 + Give Feedback to Microsoft - 100%+ Calculation Mode: Automatic Workbook Statistics MacBook Air G 44 DII DD FB F10 E7 F9 80 F3 FA @A ng.cengage.com + 88 e 365 Getting Started - Th... A Week 1 - Assignment MindTap - Cengage Learning C Excel Online Student Work ZA Student Portal | UAGC | Univers. GAGE | MINDTAP Q Search this course Activity 1 - Statistical Functions and Analysis (Tutorial) X c. Calculate z-scores using a mix of relative and absolute cell references. In cell A22, insert the formula =ROUND((A2-$E$3)/$E$7,2). Next grab the lower-right corner of A22 and drag down to fill in the remaining green cells of A23 to A36. Note how the formula changes by looking in Column D. Changing a cell from a relative reference such as E3 to an absolute reference such as $E$3 means that cell remains "fixed" as you drag. Therefore the formula you entered into A22 takes each data observation such as A2, A3, A4..., subtracts $E$3 and then divides by $E$7. Since the last two cells have absolute references they will not change as you drag. The ROUND function simply rounds the z-score to two digits. Now find the z-scores for Sample 2 using the same method you learned above by editing the formula to refer to the correct cells for Sample 2. Make sure each z-score is rounded to 2 places A-Z Sample 2 z-scores Next Back MacBook Air F12 F10 FM + 11 * ~ O - 0 CO 89 LO Q O C CC
Step by Step Solution
There are 3 Steps involved in it
Step: 1
Get Instant Access to Expert-Tailored Solutions
See step-by-step solutions with expert insights and AI powered tools for academic success
Step: 2
Step: 3
Ace Your Homework with AI
Get the answers you need in no time with our AI-driven, step-by-step assistance