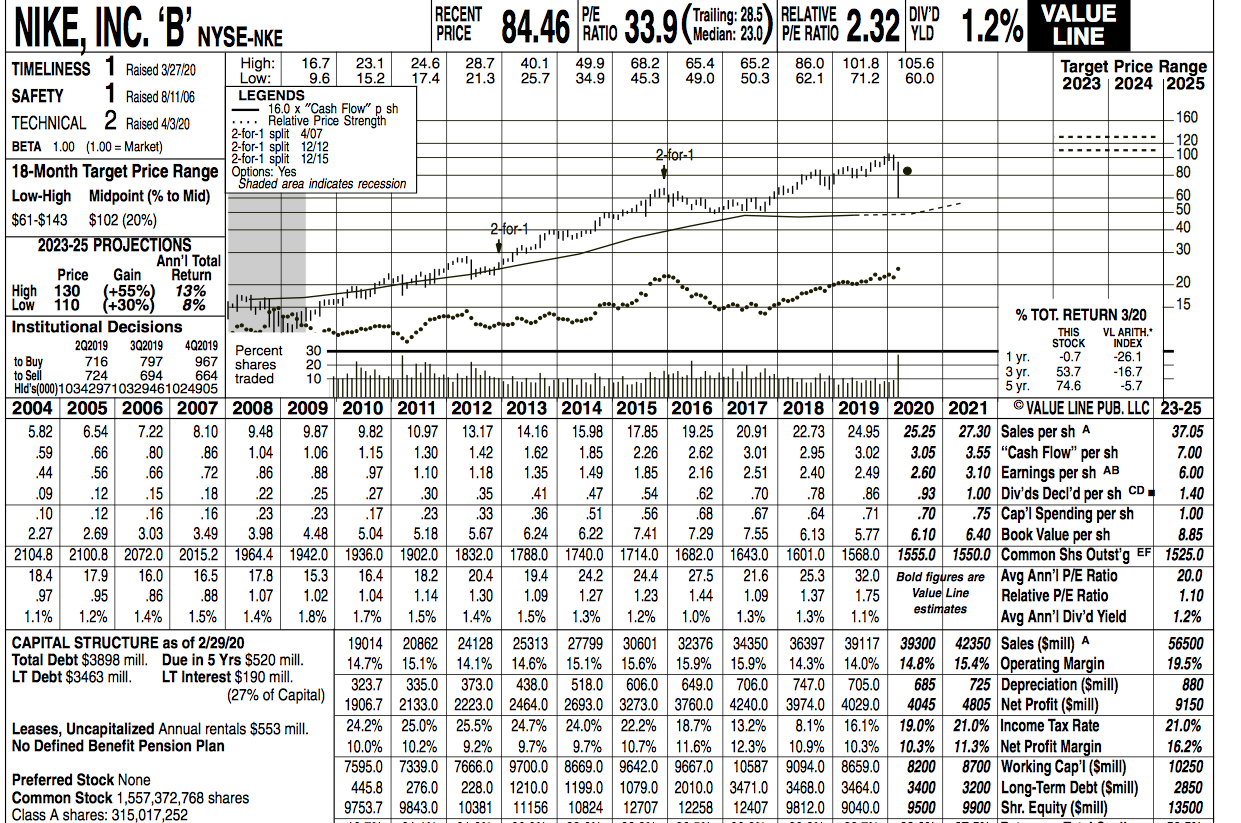
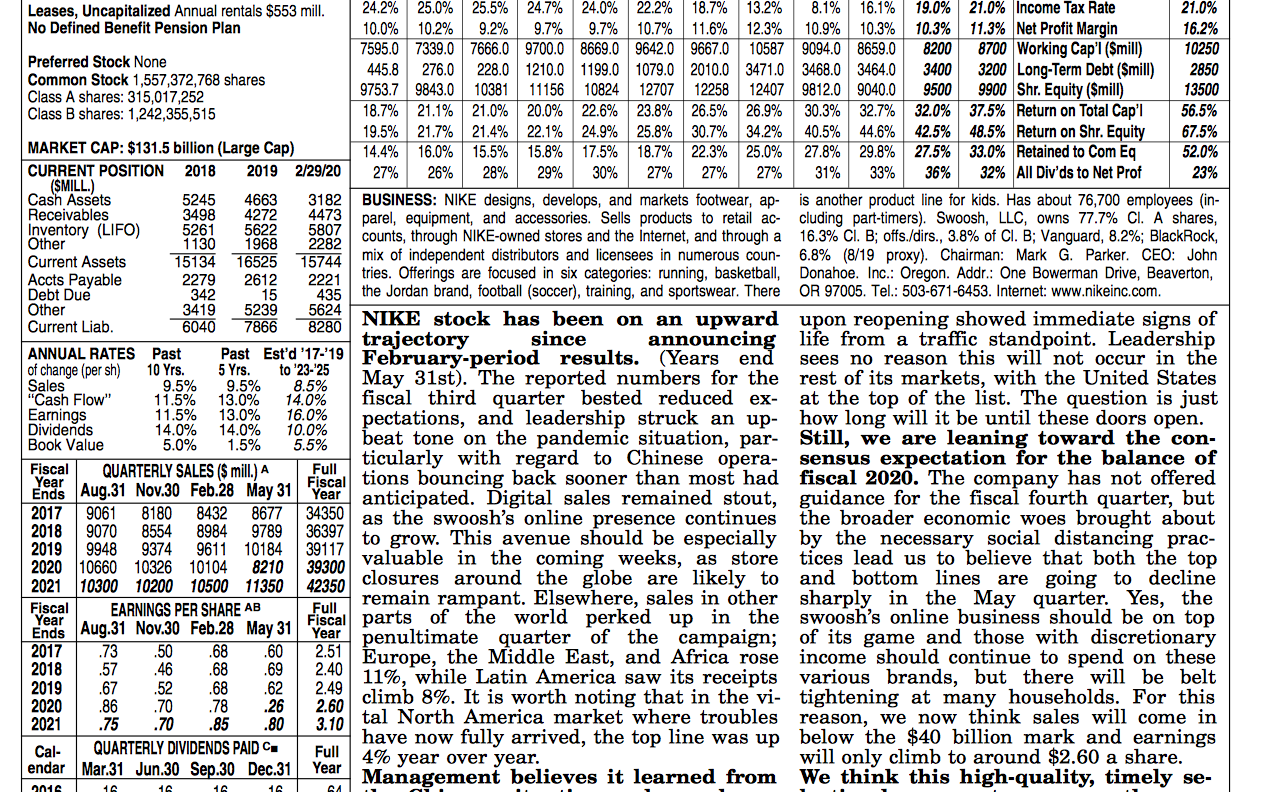
NIKE, Inc. is an American multinational corporation that is engaged in the design, development, manufacturing, and worldwide marketing and sales of footwear, apparel, equipment, accessories, and services. The company is headquartered near Beaverton, Oregon, in the Portland metropolitan area. It is the world's largest supplier of athletic shoes and apparel and a major manufacturer of sports equipment, with revenue in excess of US$ 24.95 billion in its fiscal year 2019 (ending May 31, 2019). Using the data provided in Value Line sheet (use the forecasted data for 2020 and the data in the last column as data for 2024 only), answer the following questions:
- The change in Net Working Capital in year 2022 is closes to:
A. $340 million
B. $497 million
C. $6,439 million
D. $3,259 million
- Total capital expenditures for 2023 is closes to:
A. $402 million
B. $3,425 million
C. $1,402 million
D. $734 million
- Assuming that NIKE has $3.4 billion in long term debt.
| Issue | Amount $(Mil) | Maturity Date | Yield To Maturity |
| NIKE 4.375% | 750 | 1/15/2025 | 4.25% |
| NIKE 5.7% | 800 | 1/15/2035 | 6.45% |
| NIKE 5.4% | 800 | 1/15/2033 | 5.93% |
| NIKE 3.875% | 500 | 12/1/2040 | 3.47% |
| NIKE 6.7% | 550 | 12/1/2036 | 6.96% |
What is the weighted average cost of debt (average pre-tax cost of debt)?
- 2.13%
- 3.72%
- 4.23%
- 5.49%
- Assuming the marginal tax rate is 21%, what is the company's after-tax cost of debt?
- 2.1%
- 4.7%
- 2.9%
- 4.3%
NIKE, INC. 'B' NYSE:NE PRICE 84.46 RATIO 33.9 (Media: 23.8.) PE RATIO 2.32 YLD 1.2% 110 402019 Percent to Buy E RECENT P/E DIV'D VALUE LINE TIMELINESS 1 Raised 3/27/20 High: 16.7 23.1 24.6 28.7 40.1 49.9 68.2 65.4 65.2 86.0 101.8 105.6 Target Price Range Low: 9.6 15.2 17.4 21.3 25.7 34.9 45.3 49.0 50.3 62.1 71.2 60.0 2023 2024 2025 SAFETY 1 Raised 8/11/06 LEGENDS 16.0 x "Cash Flow" p sh TECHNICAL 2 Raised 4/3/20 ... Relative Price Strength - 160 2-for-1 split 4/07 BETA 1.00 (1.00 = Market) 2-for-1 split 12/12 120 2-for-1 split 12/15 2-07-1 100 18-Month Target Price Range Options: Yes -80 Shaded area indicates recession Low-High Midpoint (% to Mid) 60 50 $61-$143 $102 (20%) 2-for-1 40 2023-25 PROJECTIONS -30 Ann'l Total Price Gain Return 20 High 130 (+55%) 13% Low (+30%) 8% 15 % TOT. RETURN 3/20 Institutional Decisions THIS VL ARITH. 202019 3Q2019 30 STOCK INDEX 716 797 967 shares 1 yr. -0.7 20 -26.1 to Sell 724 694 664 Ti traded 3 yr. 53.7 -16.7 10 Hld's(000) 103429710329461024905 5 yr. 74.6 -5.7 2004 2005 2006 2007 2008 2009 2010 2011 2012 2013 2014 2015 2016 2017 2018 2019 2020 2021 VALUE LINE PUB. LLC 23-25 5.82 6.54 7.22 8.10 9.48 9.87 9.82 10.97 13.17 14.16 15.98 17.85 19.25 20.91 22.73 24.95 25.25 27.30 Sales per shA 37.05 .59 .66 .80 .86 1.04 1.06 1.15 1.30 1.42 1.62 1.85 2.26 2.62 3.01 2.95 3.02 3.05 3.55 "Cash Flow" per sh 7.00 .44 .56 .66 .72 .86 .88 .97 1.10 1.18 1.35 1.49 1.85 2.16 2.51 2.40 2.49 2.60 3.10 Earnings per sh AB 6.00 .09 .12 .15 .18 .22 .25 27 .30 .35 .41 47 .54 .62 .70 .78 .86 .93 1.00 Div'ds Decl'd per sh CD 1.40 .10 .12 .16 .16 .23 23 .17 .23 .33 .36 .51 .56 .68 .67 .64 .71 .70 .75 Cap'l Spending per sh 1.00 2.27 2.69 3.03 3.49 3.98 4.48 5.04 5.18 5.67 6.24 6.22 7.41 7.29 7.55 6.13 5.77 6.10 6.40 Book Value per sh 8.85 2104.8 2100.8 2072.0 2015.2 1964.4 1942.0 1936.0 1902.0 1832.0 1788.0 1740.0 1714.0 1682.0 1643.0 1601.0 1568.0 1555.0 1550.0 Common Shs Outst'g EF 1525.0 18.4 17.9 16.0 16.5 17.8 15.3 16.4 18.2 20.4 19.4 24.2 24.4 27.5 21.6 25.3 32.0 Bold figures are Avg Ann' P/E Ratio 20.0 .97 .95 .86 .88 1.07 1.02 1.04 1.14 1.30 1.09 1.27 1.23 1.44 1.09 1.37 1.75 Value Line Relative P/E Ratio 1.10 1.1% 1.2% 1.4% 1.5% 1.4% 1.8% estimates 1.7% 1.5% 1.4% 1.5% 1.3% 1.2% 1.0% 1.3% 1.3% 1.1% Avg Ann'l Div'd Yield 1.2% CAPITAL STRUCTURE as of 2/29/20 19014 20862 24128 25313 27799 30601 32376 34350 36397 39117 39300 42350 Sales (Smill) A 56500 Total Debt $3898 mill. Due in 5 Yrs $520 mill. 14.7% 15.1% 14.1% 14.6% 15.1% 15.6% 15.9% 15.9% 14.3% 14.0% 14.8% 15.4% Operating Margin 19.5% LT Debt $3463 mill. LT Interest $190 mill. 323.7 335.0 373.0 438,0 518.0 606.0 649.0 706.0 747.0 705.0 685 725 Depreciation (Smill) 880 (27% of Capital) 1906.7 2133.0 2223.0 2464.0 2693.0 3273.0 3760.0 4240.0 3974.0 4029.0 4045 4805 Net Profit ($mill) 9150 Leases, Uncapitalized Annual rentals $553 mill. 24.2% 25.0% 25.5% 24.7% 24.0% 22.2% 18.7% 13.2% 8.1% 16.1% 19.0% 21.0% Income Tax Rate 21.0% No Defined Benefit Pension Plan 10.0% 10.2% 9.2% 9.7% 9.7% 10.7% 11.6% 12.3% 10.9% 10.3% 10.3% 11.3% Net Profit Margin 16.2% 7595.0 7339.0 7666.0 9700.0 8669.0 9642.0 9667.0 10587 9094.0 8659.0 8200 8700 Working Cap'l (Smill) 10250 Preferred Stock None 445.8 276.0 228.0 1210.0 1199.0 1079.0 2010.0 3471.0 3468.0 3464.0 3400 3200 Long-Term Debt (Smill) 2850 Common Stock 1,557,372,768 shares Class A shares: 315,017,252 9753.7 9843.0 10381 11156 10824 12707 12258 12407 9812.0 9040.0 9500 9900 Shr. Equity (Smill) 13500 13500 15134 2279 16525 15744 Leases, Uncapitalized Annual rentals $553 mill. 24.2% 25.0% 25.5% 24.7% 24.0% 22.2% 18.7% 13.2% 8.1% 16.1% 19.0% 21.0% Income Tax Rate 21.0% No Defined Benefit Pension Plan 10.0% 10.2% 9.2% 9.7% 9.7% 10.7% 11.6% 12.3% 10.9% 10.3% 10.3% 11.3% Net Profit Margin 16.2% 7595.0 7339.0 7666.0 9700.0 8669.0 9642.0 9667.0 10587 9094.0 8659.0 8200 Preferred Stock None 8700 Working Cap'l (Smill) 10250 445.8 276.0 228.0 1210.0 1199.0 1079.0 2010.0 3471.0 3468.0 3464.0 Common Stock 1,557,372,768 shares 3400 3200 Long-Term Debt (Smill) 2850 Class A shares: 315,017,252 9753.7 9843.0 10381 11156 10824 12707 12258 12407 9812.0 9040.0 9500 9900 Shr. Equity (Smill) Class B shares: 1,242,355,515 18.7% 21.1% 21.0% 20.0% 22.6% 23.8% 26.5% 26.9% 30.3% 32.7% 32.0% 37.5% Return on Total Cap'l 56.5% 19.5% 21.7% 21.4% 22.1% 24.9% 25.8% 30.7% 34.2% 40.5% 44.6% 42.5% 48.5% Return on Shr. Equity 67.5% MARKET CAP: $131.5 billion (Large Cap) 14.4% 16.0% 15.5% 15.8% 17.5% 18.7% 22.3% 25.0% 27.8% 29.8% 27.5% 33.0% Retained to Com Eq 52.0% CURRENT POSITION 2018 2019 2/29/20 27% 26% 28% 29% 30% 27% 27% 27% 31% 33% 36% 32% All Div'ds to Net Prof (SMILL.) 23% Cash Assets 5245 4663 3182 BUSINESS: NIKE designs, develops, and markets footwear, ap is another product line for kids. Has about 76,700 employees (in- Receivables 3498 4272 4473 parel, equipment, and accessories. Sells products to retail ac- cluding part-timers). Swoosh, LLC, owns 77.7% Cl. A shares, Inventory (LIFO) 5261 5622 5807 Other 1130 1968 2282 counts, through NIKE-owned stores and the Internet, and through a 16.3% CI. B; offs./dirs., 3.8% of Cl. B; Vanguard, 8.2%; BlackRock, Current Assets mix of independent distributors and licensees in numerous coun 6.8% (8/19 proxy). Chairman: Mark G. Parker. CEO: John Accts Payable 2612 2221 tries. Offerings are focused in six categories: running, basketball, Donahoe. Inc.: Oregon. Addr.: One Bowerman Drive, Beaverton, Debt Due 342 15 435 the Jordan brand, football (soccer), training, and sportswear. There OR 97005. Tel.: 503-671-6453. Internet: www.nikeinc.com. Other 3419 5239 5624 Current Liab. 6040 7866 NIKE stock has been on an upward 8280 upon reopening showed immediate signs of trajectory since life from a traffic standpoint. Leadership ANNUAL RATES Past announcing Past Estd '17/'19 February-period results. (Years end of change (per sh) sees no reason this will not occur in the 10 Yrs. 5 Yrs. to '23-25 Sales 9.5% 9.5% 8.5% May 31st). The reported numbers for the rest of its markets, with the United States "Cash Flow" 11.5% 13.0% 14.0% fiscal third quarter bested reduced ex at the top of the list. The question is just Earnings 11.5% 13.0% 16.0% how long will it be until these doors open. Dividends pectations, and leadership struck an up- 14.0% 14.0% 10.0% Book Value 5.0% 1.5% 5.5% beat tone on the pandemic situation, par Still, we are leaning toward the con- ticularly with regard to Chinese opera sensus expectation for the balance of Lease Aug.31 Nov.30 Feb.28. May 31 Fiscal tions bouncing back sooner than most had fiscal 2020. The company has not offered anticipated. Digital sales remained stout, guidance for the fiscal fourth quarter, but 2017 9061 8180 8432 8677 34350 as the swoosh's online presence continues 2018 9070 the broader economic woes brought about 8554 8984 9789 36397 2019 9948 9374 9611 10184 to grow. This avenue should be especially 39117 by the necessary social distancing prac- 2020 10660 10326 10104 8210 39300 valuable in the coming weeks, as store tices lead us to believe that both the top 2021 10300 10200 10500 11350 42350 closures around the globe are likely to and bottom lines are going to decline Fiscal EARNINGS PER SHARE AB remain rampant. Elsewhere, sales in other Full sharply, in the May quarter. Yes, the Emas Aug.31 Nov.30 Feb.28 May 31 Fiscal parts of the world perked up in the swoosh's online business should be on top penultimate quarter of the campaign; of its game and those with discretionary 2017 .73 .50 .68 .60 2.51 2018 Europe, the Middle East, and Africa rose income should continue to spend on these .57 .46 .69 .68 2.40 | 11%, while Latin America saw its receipts 2019 .67 various brands, but there will be belt 52 .68 .62 2.49 2020 .86 .70 .78 .26 2.60 climb 8%. It is worth noting that in the vi- tightening at many households. For this 2021 .75 .70 .85 .80 3.10 tal North America market where troubles reason, we now think sales will come in Cal- QUARTERLY DIVIDENDS PAID C. have now fully arrived, the top line was up below the $40 billion mark and earnings Full 4% year over year. endar Mar 31 Jun 30 Sep.30 Dec.31 will only climb to around $2.60 a share. Year Management believes it learned from We think this high-quality, timely se- Fiscal Full 2015 16 NIKE, INC. 'B' NYSE:NE PRICE 84.46 RATIO 33.9 (Media: 23.8.) PE RATIO 2.32 YLD 1.2% 110 402019 Percent to Buy E RECENT P/E DIV'D VALUE LINE TIMELINESS 1 Raised 3/27/20 High: 16.7 23.1 24.6 28.7 40.1 49.9 68.2 65.4 65.2 86.0 101.8 105.6 Target Price Range Low: 9.6 15.2 17.4 21.3 25.7 34.9 45.3 49.0 50.3 62.1 71.2 60.0 2023 2024 2025 SAFETY 1 Raised 8/11/06 LEGENDS 16.0 x "Cash Flow" p sh TECHNICAL 2 Raised 4/3/20 ... Relative Price Strength - 160 2-for-1 split 4/07 BETA 1.00 (1.00 = Market) 2-for-1 split 12/12 120 2-for-1 split 12/15 2-07-1 100 18-Month Target Price Range Options: Yes -80 Shaded area indicates recession Low-High Midpoint (% to Mid) 60 50 $61-$143 $102 (20%) 2-for-1 40 2023-25 PROJECTIONS -30 Ann'l Total Price Gain Return 20 High 130 (+55%) 13% Low (+30%) 8% 15 % TOT. RETURN 3/20 Institutional Decisions THIS VL ARITH. 202019 3Q2019 30 STOCK INDEX 716 797 967 shares 1 yr. -0.7 20 -26.1 to Sell 724 694 664 Ti traded 3 yr. 53.7 -16.7 10 Hld's(000) 103429710329461024905 5 yr. 74.6 -5.7 2004 2005 2006 2007 2008 2009 2010 2011 2012 2013 2014 2015 2016 2017 2018 2019 2020 2021 VALUE LINE PUB. LLC 23-25 5.82 6.54 7.22 8.10 9.48 9.87 9.82 10.97 13.17 14.16 15.98 17.85 19.25 20.91 22.73 24.95 25.25 27.30 Sales per shA 37.05 .59 .66 .80 .86 1.04 1.06 1.15 1.30 1.42 1.62 1.85 2.26 2.62 3.01 2.95 3.02 3.05 3.55 "Cash Flow" per sh 7.00 .44 .56 .66 .72 .86 .88 .97 1.10 1.18 1.35 1.49 1.85 2.16 2.51 2.40 2.49 2.60 3.10 Earnings per sh AB 6.00 .09 .12 .15 .18 .22 .25 27 .30 .35 .41 47 .54 .62 .70 .78 .86 .93 1.00 Div'ds Decl'd per sh CD 1.40 .10 .12 .16 .16 .23 23 .17 .23 .33 .36 .51 .56 .68 .67 .64 .71 .70 .75 Cap'l Spending per sh 1.00 2.27 2.69 3.03 3.49 3.98 4.48 5.04 5.18 5.67 6.24 6.22 7.41 7.29 7.55 6.13 5.77 6.10 6.40 Book Value per sh 8.85 2104.8 2100.8 2072.0 2015.2 1964.4 1942.0 1936.0 1902.0 1832.0 1788.0 1740.0 1714.0 1682.0 1643.0 1601.0 1568.0 1555.0 1550.0 Common Shs Outst'g EF 1525.0 18.4 17.9 16.0 16.5 17.8 15.3 16.4 18.2 20.4 19.4 24.2 24.4 27.5 21.6 25.3 32.0 Bold figures are Avg Ann' P/E Ratio 20.0 .97 .95 .86 .88 1.07 1.02 1.04 1.14 1.30 1.09 1.27 1.23 1.44 1.09 1.37 1.75 Value Line Relative P/E Ratio 1.10 1.1% 1.2% 1.4% 1.5% 1.4% 1.8% estimates 1.7% 1.5% 1.4% 1.5% 1.3% 1.2% 1.0% 1.3% 1.3% 1.1% Avg Ann'l Div'd Yield 1.2% CAPITAL STRUCTURE as of 2/29/20 19014 20862 24128 25313 27799 30601 32376 34350 36397 39117 39300 42350 Sales (Smill) A 56500 Total Debt $3898 mill. Due in 5 Yrs $520 mill. 14.7% 15.1% 14.1% 14.6% 15.1% 15.6% 15.9% 15.9% 14.3% 14.0% 14.8% 15.4% Operating Margin 19.5% LT Debt $3463 mill. LT Interest $190 mill. 323.7 335.0 373.0 438,0 518.0 606.0 649.0 706.0 747.0 705.0 685 725 Depreciation (Smill) 880 (27% of Capital) 1906.7 2133.0 2223.0 2464.0 2693.0 3273.0 3760.0 4240.0 3974.0 4029.0 4045 4805 Net Profit ($mill) 9150 Leases, Uncapitalized Annual rentals $553 mill. 24.2% 25.0% 25.5% 24.7% 24.0% 22.2% 18.7% 13.2% 8.1% 16.1% 19.0% 21.0% Income Tax Rate 21.0% No Defined Benefit Pension Plan 10.0% 10.2% 9.2% 9.7% 9.7% 10.7% 11.6% 12.3% 10.9% 10.3% 10.3% 11.3% Net Profit Margin 16.2% 7595.0 7339.0 7666.0 9700.0 8669.0 9642.0 9667.0 10587 9094.0 8659.0 8200 8700 Working Cap'l (Smill) 10250 Preferred Stock None 445.8 276.0 228.0 1210.0 1199.0 1079.0 2010.0 3471.0 3468.0 3464.0 3400 3200 Long-Term Debt (Smill) 2850 Common Stock 1,557,372,768 shares Class A shares: 315,017,252 9753.7 9843.0 10381 11156 10824 12707 12258 12407 9812.0 9040.0 9500 9900 Shr. Equity (Smill) 13500 13500 15134 2279 16525 15744 Leases, Uncapitalized Annual rentals $553 mill. 24.2% 25.0% 25.5% 24.7% 24.0% 22.2% 18.7% 13.2% 8.1% 16.1% 19.0% 21.0% Income Tax Rate 21.0% No Defined Benefit Pension Plan 10.0% 10.2% 9.2% 9.7% 9.7% 10.7% 11.6% 12.3% 10.9% 10.3% 10.3% 11.3% Net Profit Margin 16.2% 7595.0 7339.0 7666.0 9700.0 8669.0 9642.0 9667.0 10587 9094.0 8659.0 8200 Preferred Stock None 8700 Working Cap'l (Smill) 10250 445.8 276.0 228.0 1210.0 1199.0 1079.0 2010.0 3471.0 3468.0 3464.0 Common Stock 1,557,372,768 shares 3400 3200 Long-Term Debt (Smill) 2850 Class A shares: 315,017,252 9753.7 9843.0 10381 11156 10824 12707 12258 12407 9812.0 9040.0 9500 9900 Shr. Equity (Smill) Class B shares: 1,242,355,515 18.7% 21.1% 21.0% 20.0% 22.6% 23.8% 26.5% 26.9% 30.3% 32.7% 32.0% 37.5% Return on Total Cap'l 56.5% 19.5% 21.7% 21.4% 22.1% 24.9% 25.8% 30.7% 34.2% 40.5% 44.6% 42.5% 48.5% Return on Shr. Equity 67.5% MARKET CAP: $131.5 billion (Large Cap) 14.4% 16.0% 15.5% 15.8% 17.5% 18.7% 22.3% 25.0% 27.8% 29.8% 27.5% 33.0% Retained to Com Eq 52.0% CURRENT POSITION 2018 2019 2/29/20 27% 26% 28% 29% 30% 27% 27% 27% 31% 33% 36% 32% All Div'ds to Net Prof (SMILL.) 23% Cash Assets 5245 4663 3182 BUSINESS: NIKE designs, develops, and markets footwear, ap is another product line for kids. Has about 76,700 employees (in- Receivables 3498 4272 4473 parel, equipment, and accessories. Sells products to retail ac- cluding part-timers). Swoosh, LLC, owns 77.7% Cl. A shares, Inventory (LIFO) 5261 5622 5807 Other 1130 1968 2282 counts, through NIKE-owned stores and the Internet, and through a 16.3% CI. B; offs./dirs., 3.8% of Cl. B; Vanguard, 8.2%; BlackRock, Current Assets mix of independent distributors and licensees in numerous coun 6.8% (8/19 proxy). Chairman: Mark G. Parker. CEO: John Accts Payable 2612 2221 tries. Offerings are focused in six categories: running, basketball, Donahoe. Inc.: Oregon. Addr.: One Bowerman Drive, Beaverton, Debt Due 342 15 435 the Jordan brand, football (soccer), training, and sportswear. There OR 97005. Tel.: 503-671-6453. Internet: www.nikeinc.com. Other 3419 5239 5624 Current Liab. 6040 7866 NIKE stock has been on an upward 8280 upon reopening showed immediate signs of trajectory since life from a traffic standpoint. Leadership ANNUAL RATES Past announcing Past Estd '17/'19 February-period results. (Years end of change (per sh) sees no reason this will not occur in the 10 Yrs. 5 Yrs. to '23-25 Sales 9.5% 9.5% 8.5% May 31st). The reported numbers for the rest of its markets, with the United States "Cash Flow" 11.5% 13.0% 14.0% fiscal third quarter bested reduced ex at the top of the list. The question is just Earnings 11.5% 13.0% 16.0% how long will it be until these doors open. Dividends pectations, and leadership struck an up- 14.0% 14.0% 10.0% Book Value 5.0% 1.5% 5.5% beat tone on the pandemic situation, par Still, we are leaning toward the con- ticularly with regard to Chinese opera sensus expectation for the balance of Lease Aug.31 Nov.30 Feb.28. May 31 Fiscal tions bouncing back sooner than most had fiscal 2020. The company has not offered anticipated. Digital sales remained stout, guidance for the fiscal fourth quarter, but 2017 9061 8180 8432 8677 34350 as the swoosh's online presence continues 2018 9070 the broader economic woes brought about 8554 8984 9789 36397 2019 9948 9374 9611 10184 to grow. This avenue should be especially 39117 by the necessary social distancing prac- 2020 10660 10326 10104 8210 39300 valuable in the coming weeks, as store tices lead us to believe that both the top 2021 10300 10200 10500 11350 42350 closures around the globe are likely to and bottom lines are going to decline Fiscal EARNINGS PER SHARE AB remain rampant. Elsewhere, sales in other Full sharply, in the May quarter. Yes, the Emas Aug.31 Nov.30 Feb.28 May 31 Fiscal parts of the world perked up in the swoosh's online business should be on top penultimate quarter of the campaign; of its game and those with discretionary 2017 .73 .50 .68 .60 2.51 2018 Europe, the Middle East, and Africa rose income should continue to spend on these .57 .46 .69 .68 2.40 | 11%, while Latin America saw its receipts 2019 .67 various brands, but there will be belt 52 .68 .62 2.49 2020 .86 .70 .78 .26 2.60 climb 8%. It is worth noting that in the vi- tightening at many households. For this 2021 .75 .70 .85 .80 3.10 tal North America market where troubles reason, we now think sales will come in Cal- QUARTERLY DIVIDENDS PAID C. have now fully arrived, the top line was up below the $40 billion mark and earnings Full 4% year over year. endar Mar 31 Jun 30 Sep.30 Dec.31 will only climb to around $2.60 a share. Year Management believes it learned from We think this high-quality, timely se- Fiscal Full 2015 16