Answered step by step
Verified Expert Solution
Link Copied!

Question

1 Approved Answer

No Excel Please solve by Hand no excel. Please do all parts. 2. (10 pt each) The following tables show the information on the returns

No Excel Please solve by Hand no excel. Please do all parts. image text in transcribed
2. (10 pt each) The following tables show the information on the returns of two stocks S1 and S2 depending on the states of economy State of Probability of States Occurrin .2 .5 .3 Return on Stock Si 6% 8% 900 Return on Stock S2 -4% 12% 30% Econom Bear Normal Bull Calculate the expected return, variance and standard deviation for each stock. Find the covariance and correlation between stocks S1 and S2 What is the minimum variance (for all possible returns) portfolio? a. b. c. d. Suppose you have $5000 to invest. If stock S1 costs $30/share and S2 costs S55/share, how would you distribute your investment to obtain the minimum variance portfolio from c? e. To achieve l 1% return, how should you form the portfolio

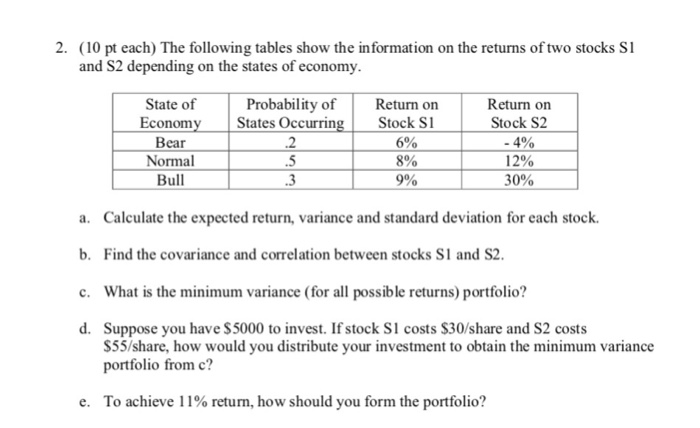
Step by Step Solution

There are 3 Steps involved in it

Step: 1

blur-text-image

Get Instant Access to Expert-Tailored Solutions

See step-by-step solutions with expert insights and AI powered tools for academic success

Step: 2

blur-text-image

Step: 3

blur-text-image

Ace Your Homework with AI

Get the answers you need in no time with our AI-driven, step-by-step assistance

Get Started

Students also viewed these Accounting questions

Question

What are the stages of project management? Write it in items.

Answered: 1 week ago

Question

why do consumers often fail to seek out higher yields on deposits ?

Answered: 1 week ago