

Answered step by step
Verified Expert Solution
Question
1 Approved Answer
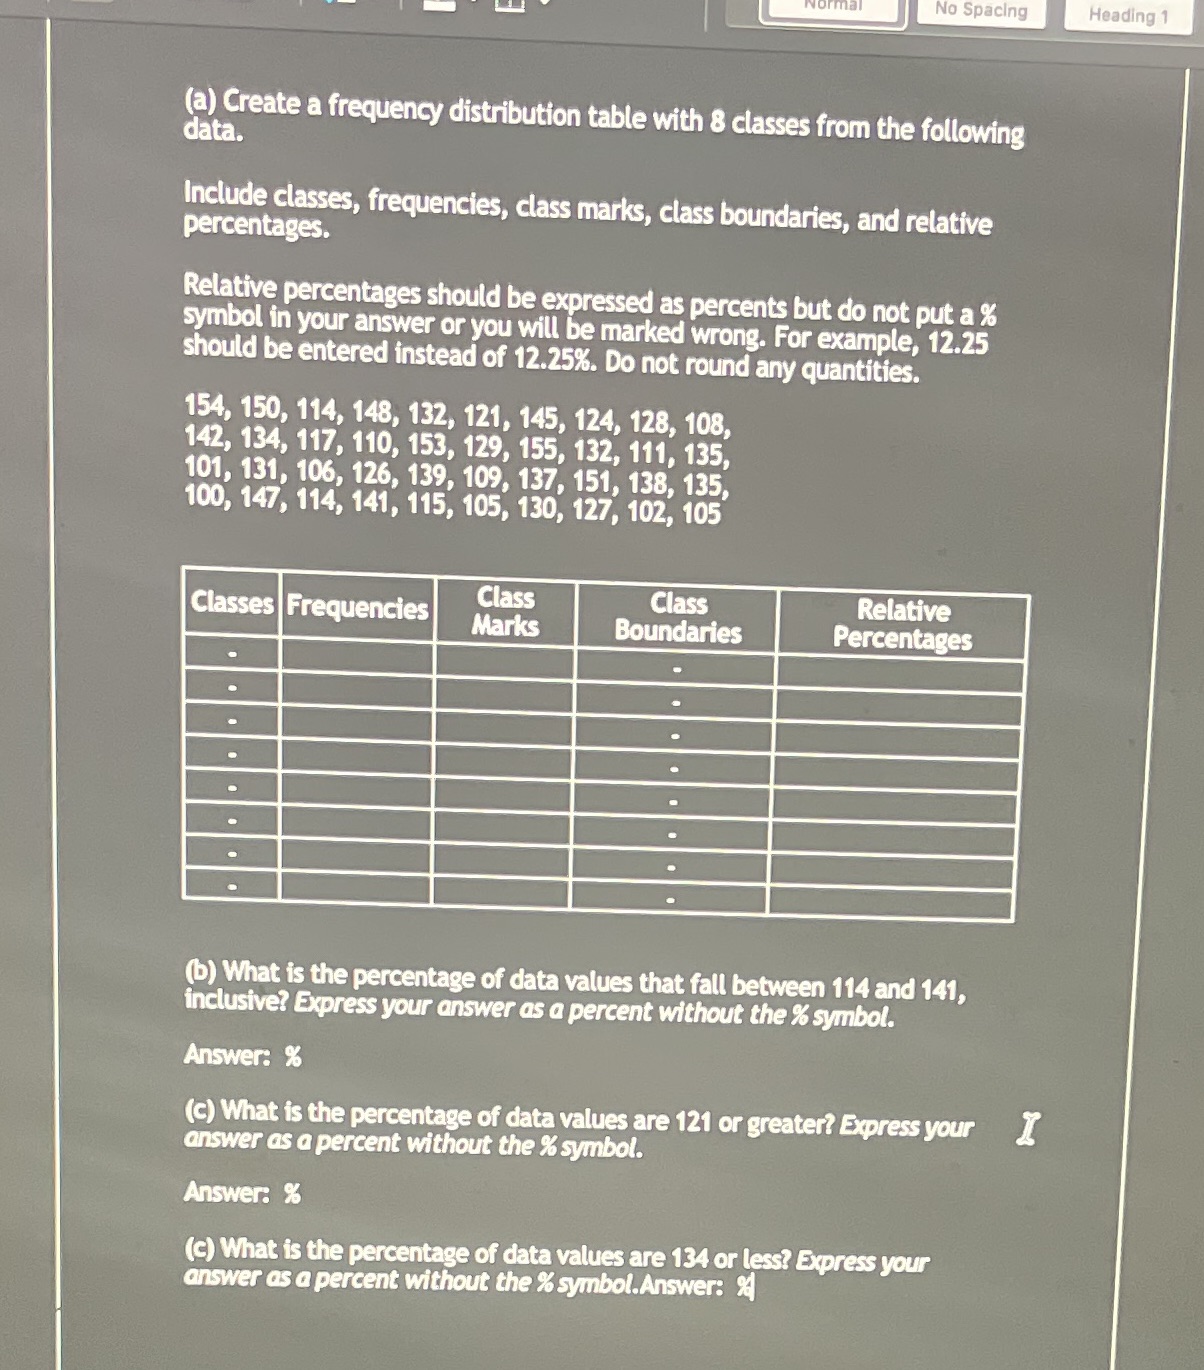
No Spacing Heading 1 (a) Create a frequency distribution table with 8 classes from the following data. Include classes, frequencies, class marks, class boundaries, and
Step by Step Solution
There are 3 Steps involved in it
Step: 1

Get Instant Access to Expert-Tailored Solutions
See step-by-step solutions with expert insights and AI powered tools for academic success
Step: 2

Step: 3
Ace Your Homework with AI
Get the answers you need in no time with our AI-driven, step-by-step assistance
Get Started
College Geometry Using The Geometer's Sketchpad
Authors: Barbara E Reynolds, William E Fenton
1st Edition
1118213408, 9781118213407