Answered step by step
Verified Expert Solution
Question
1 Approved Answer
Northgate Products Corp. sells gadgets and uses the perpetual inventory system. During the month of January 2019, the number of gadgets purchased and sold
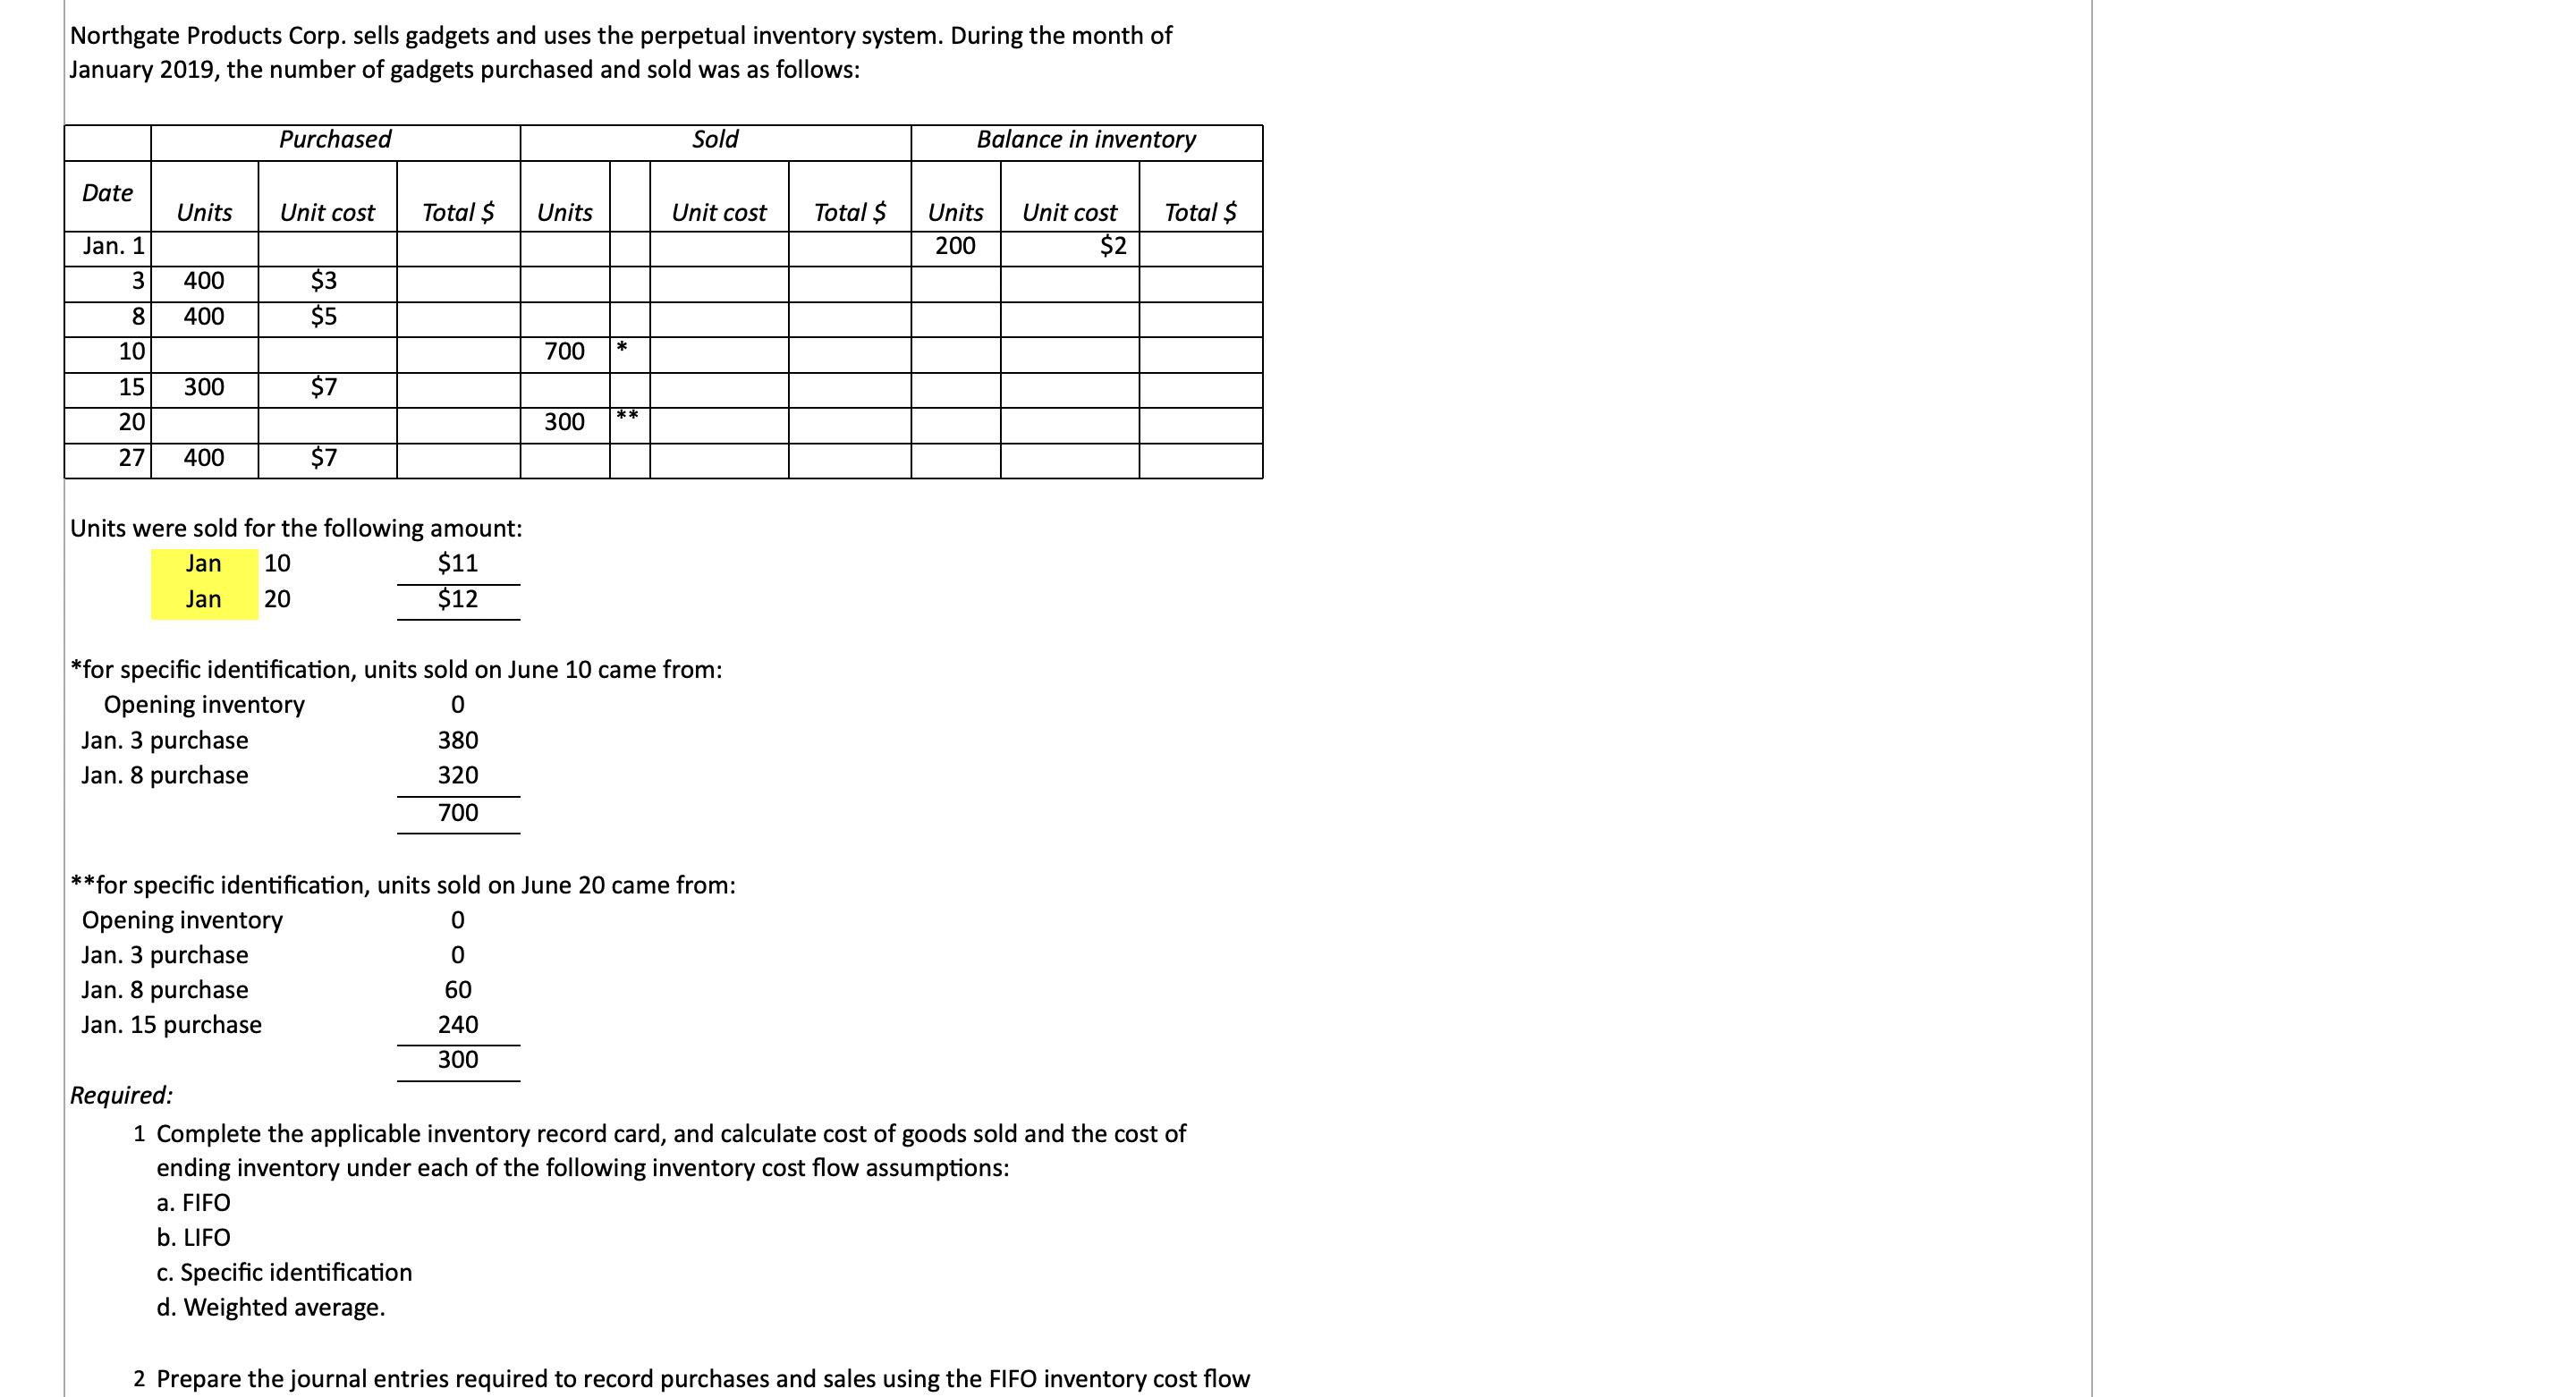
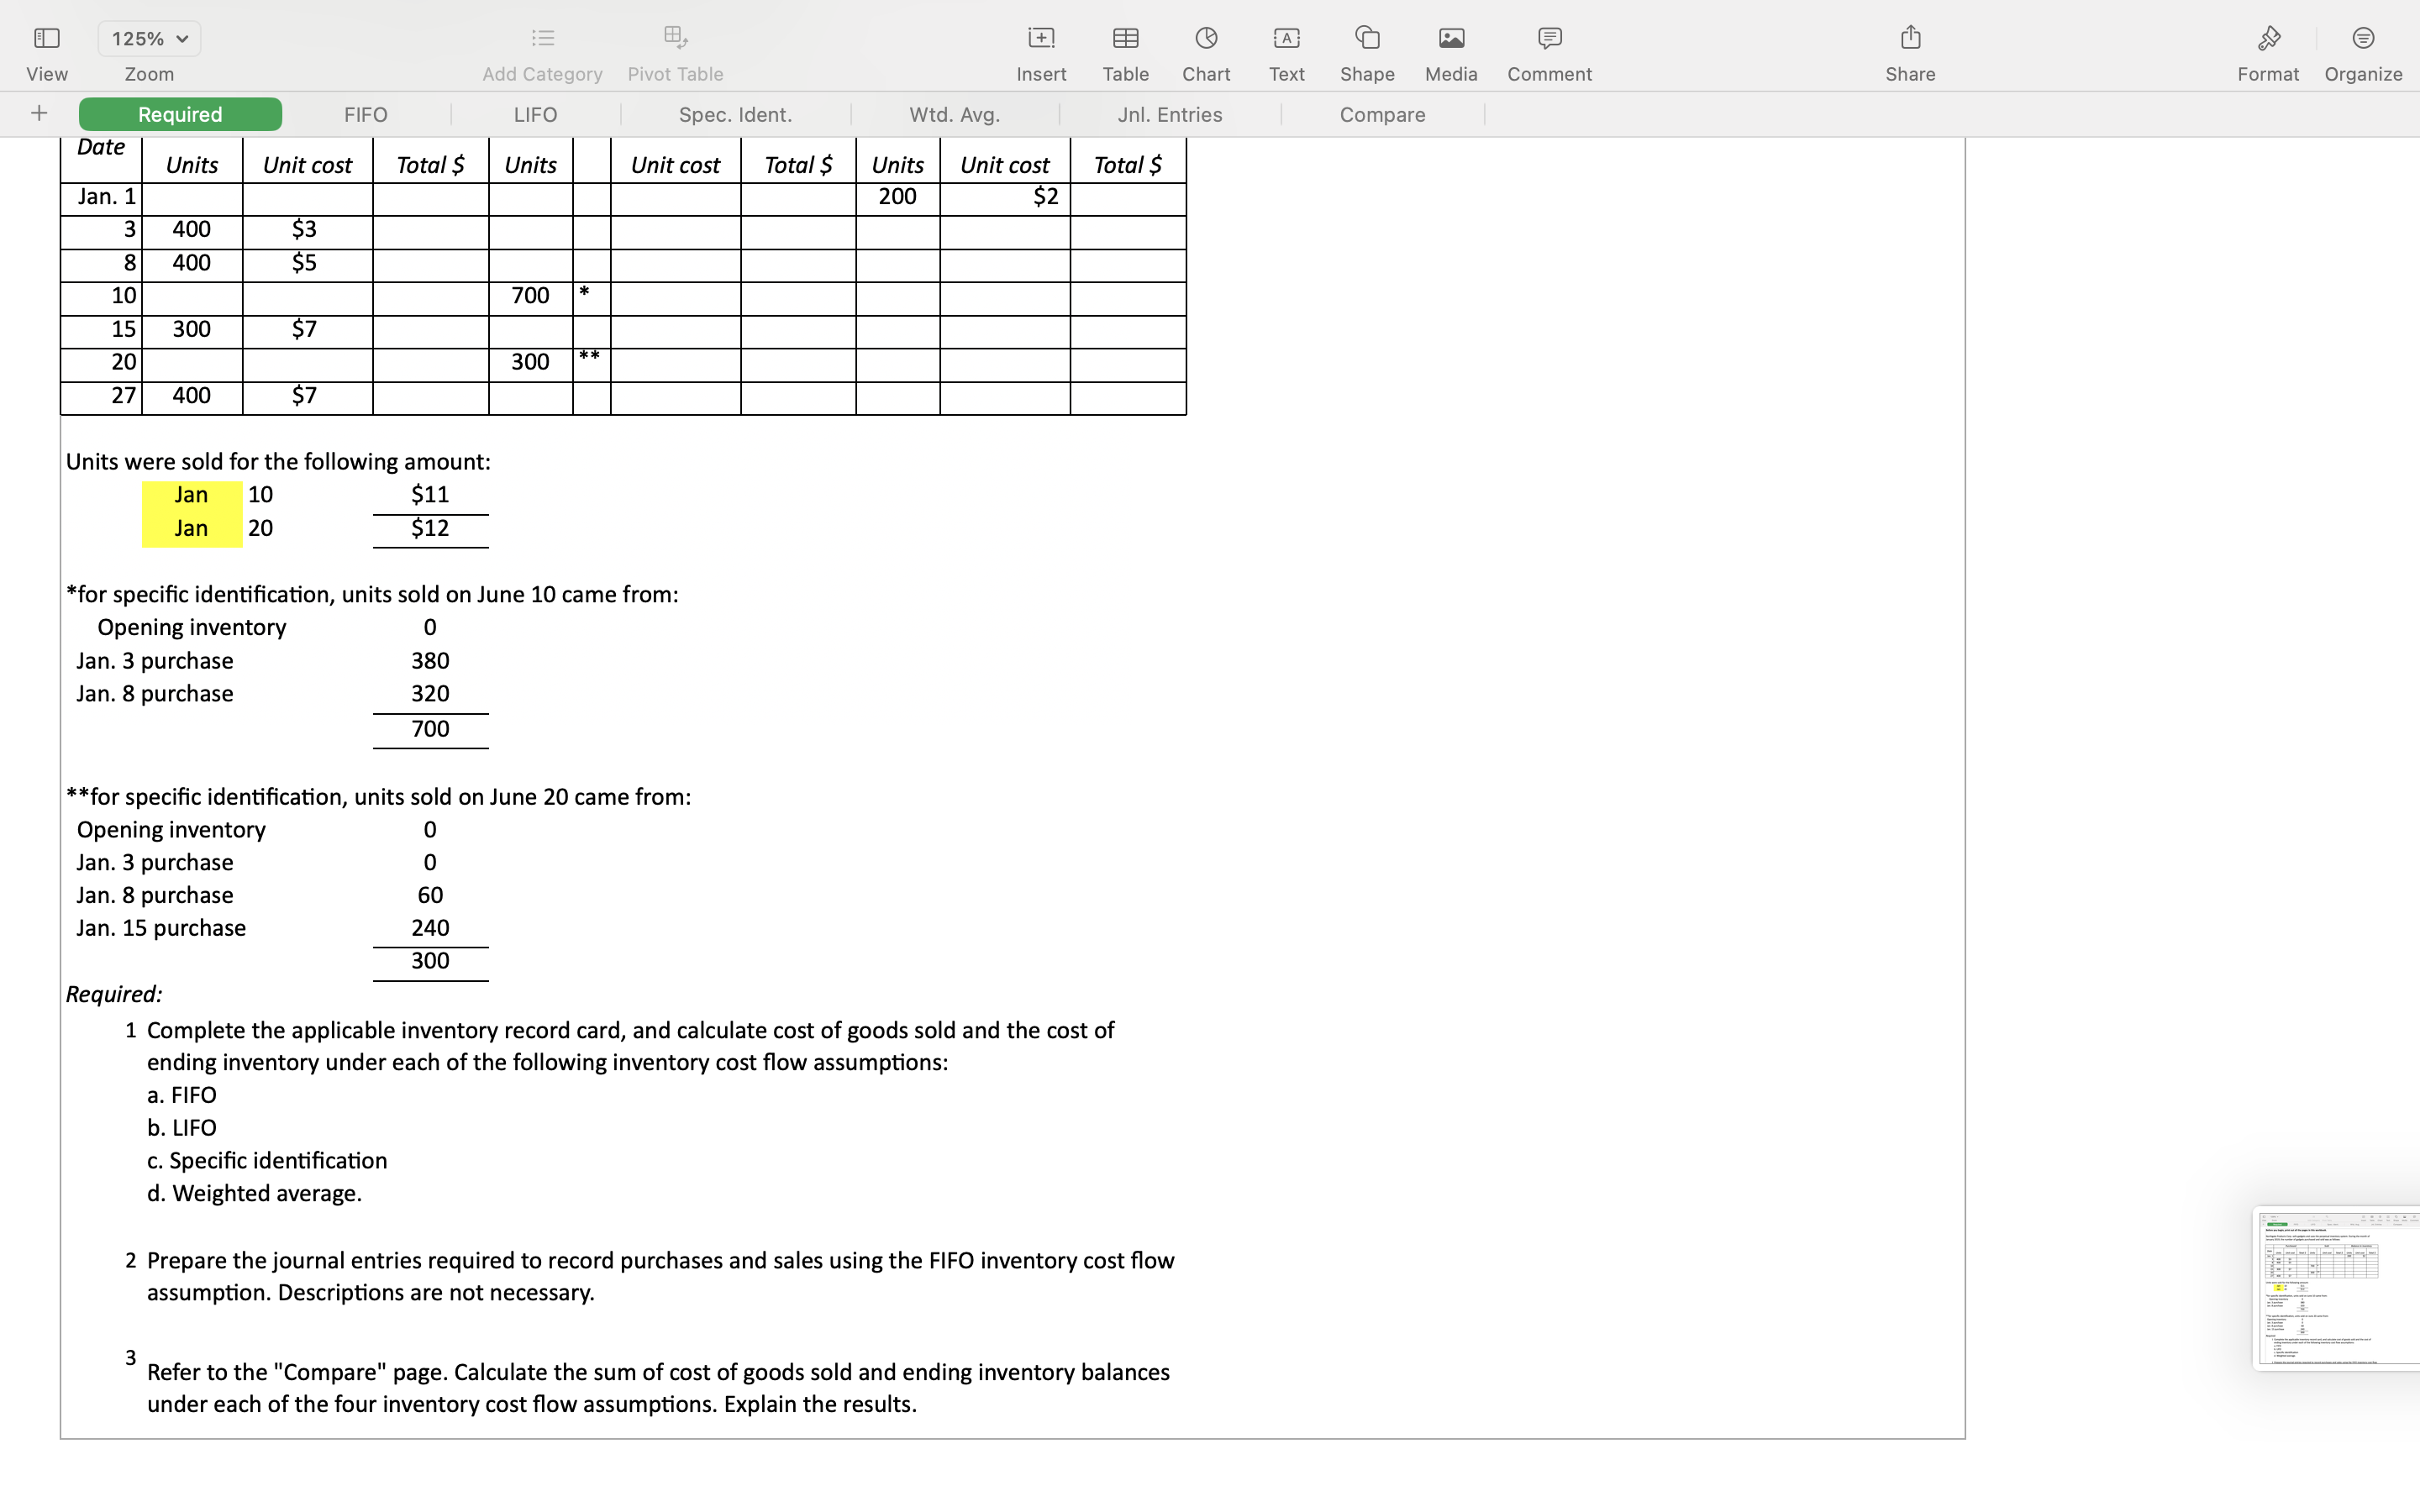
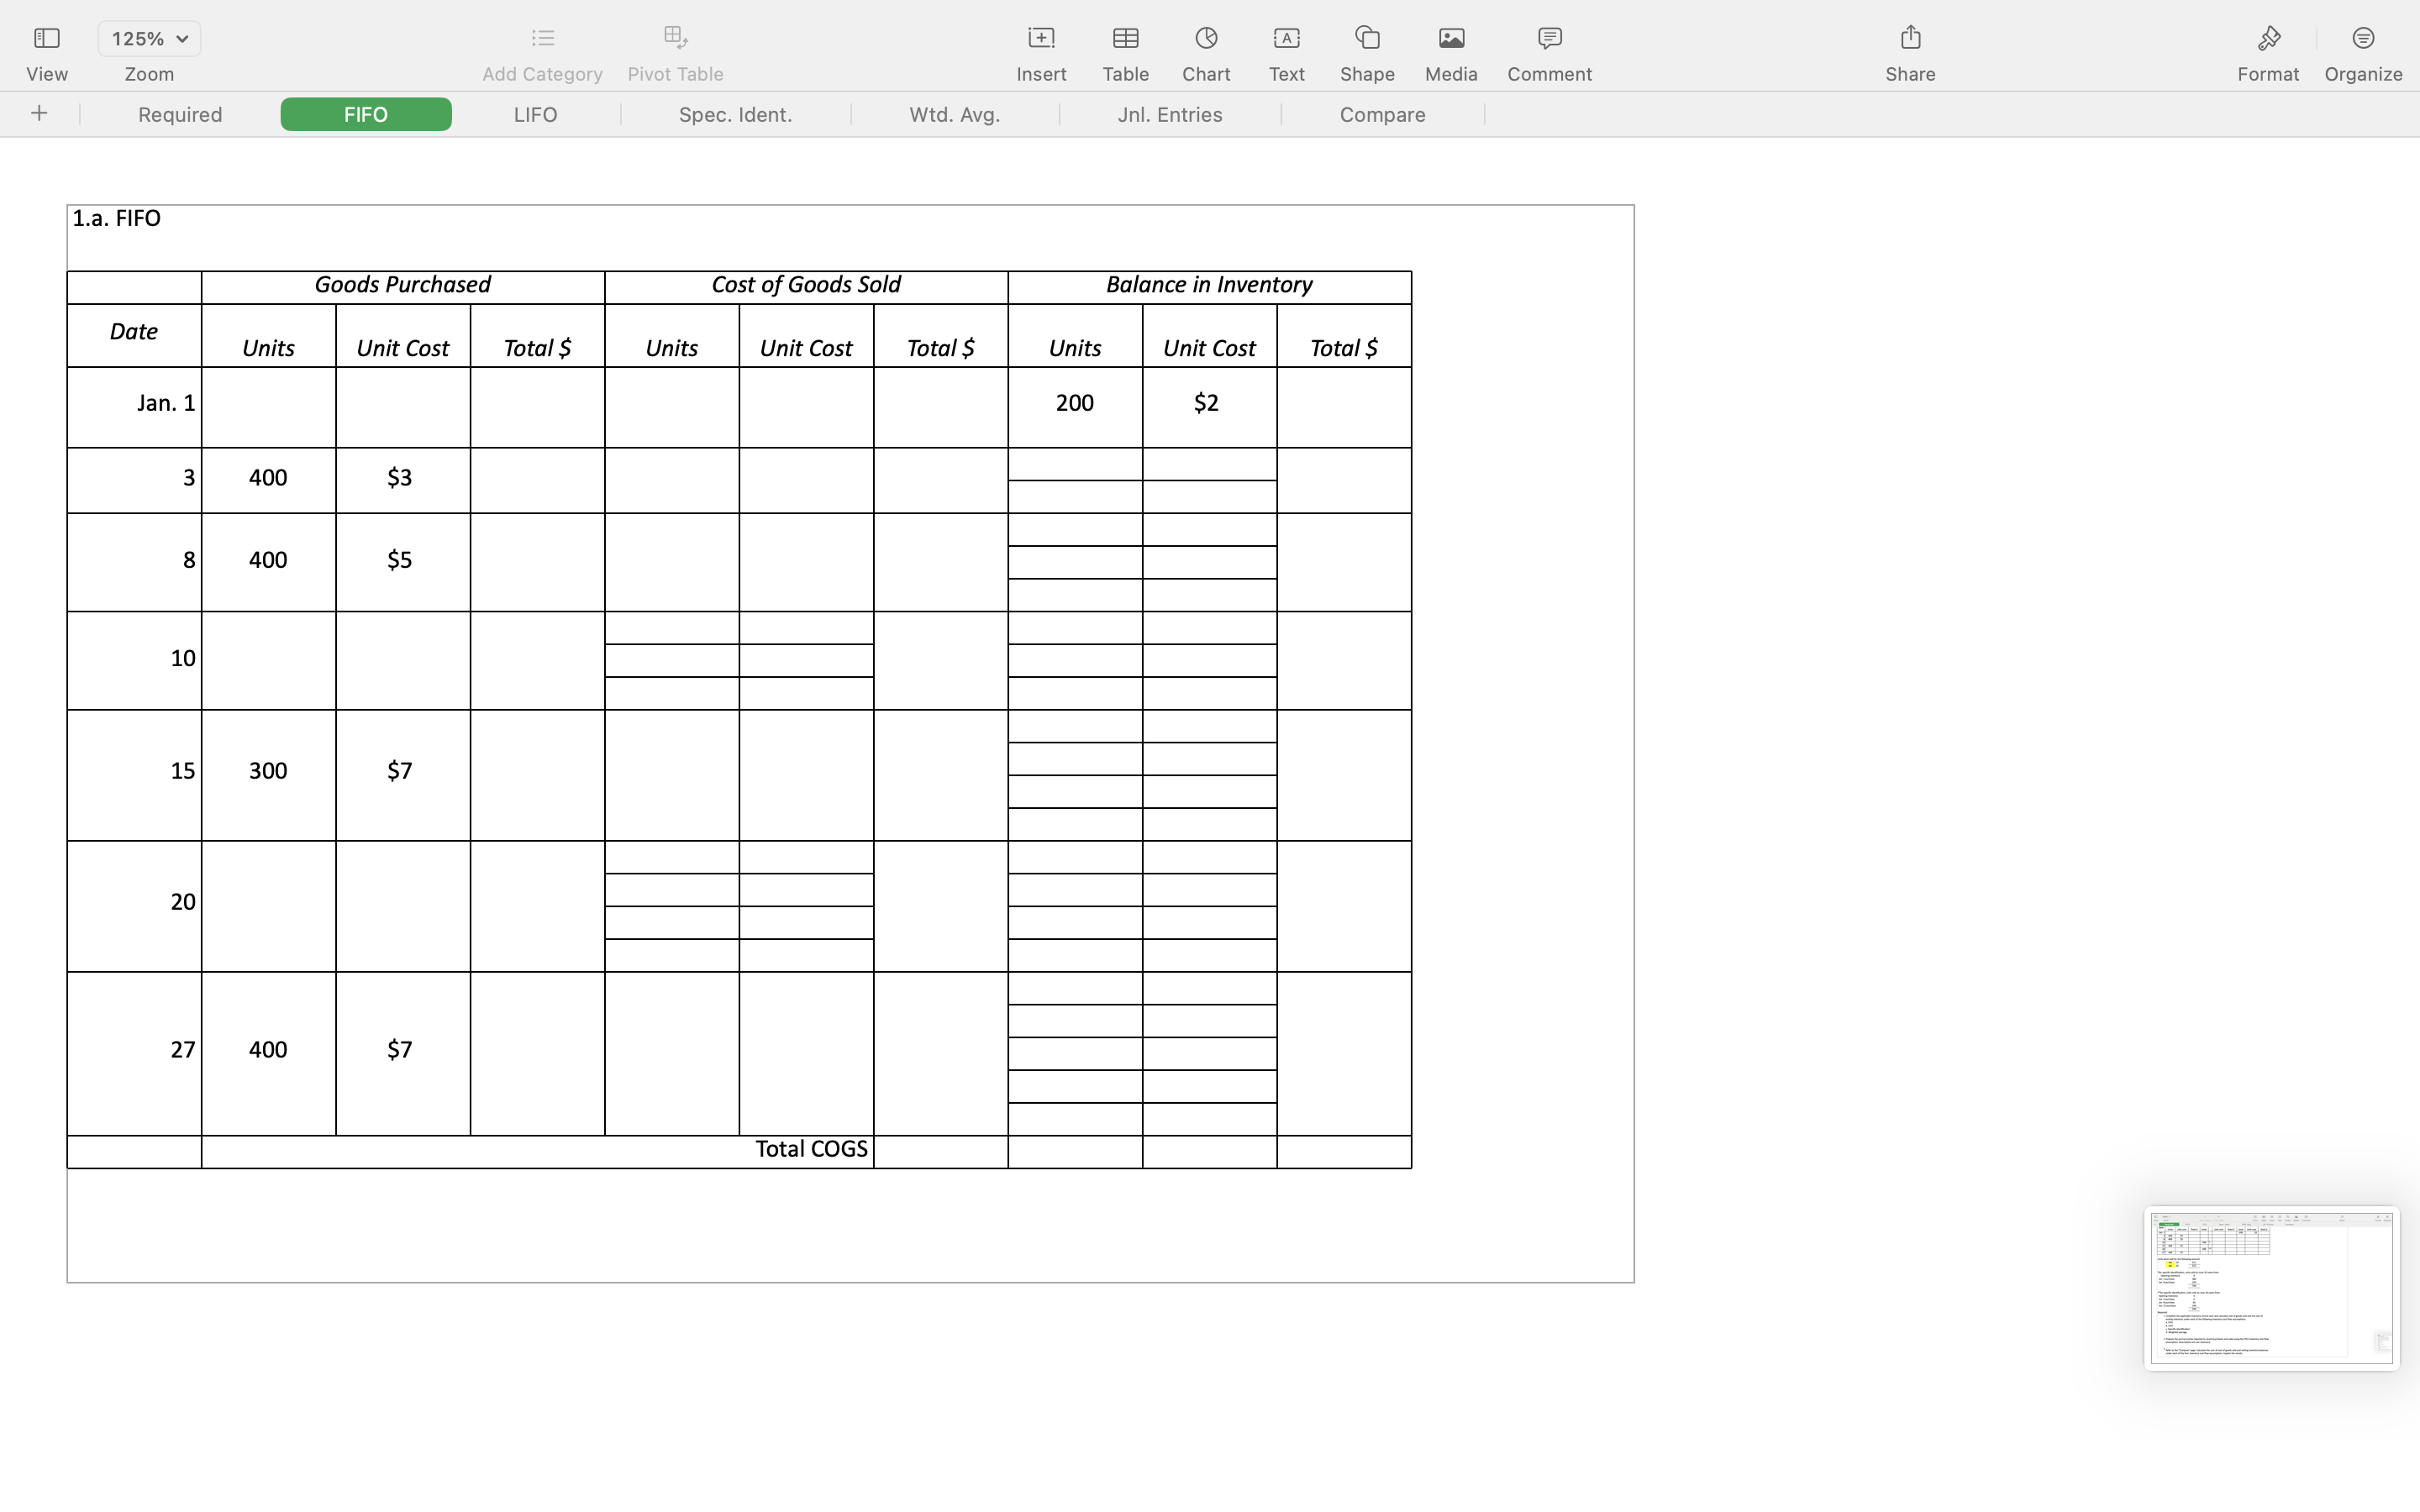
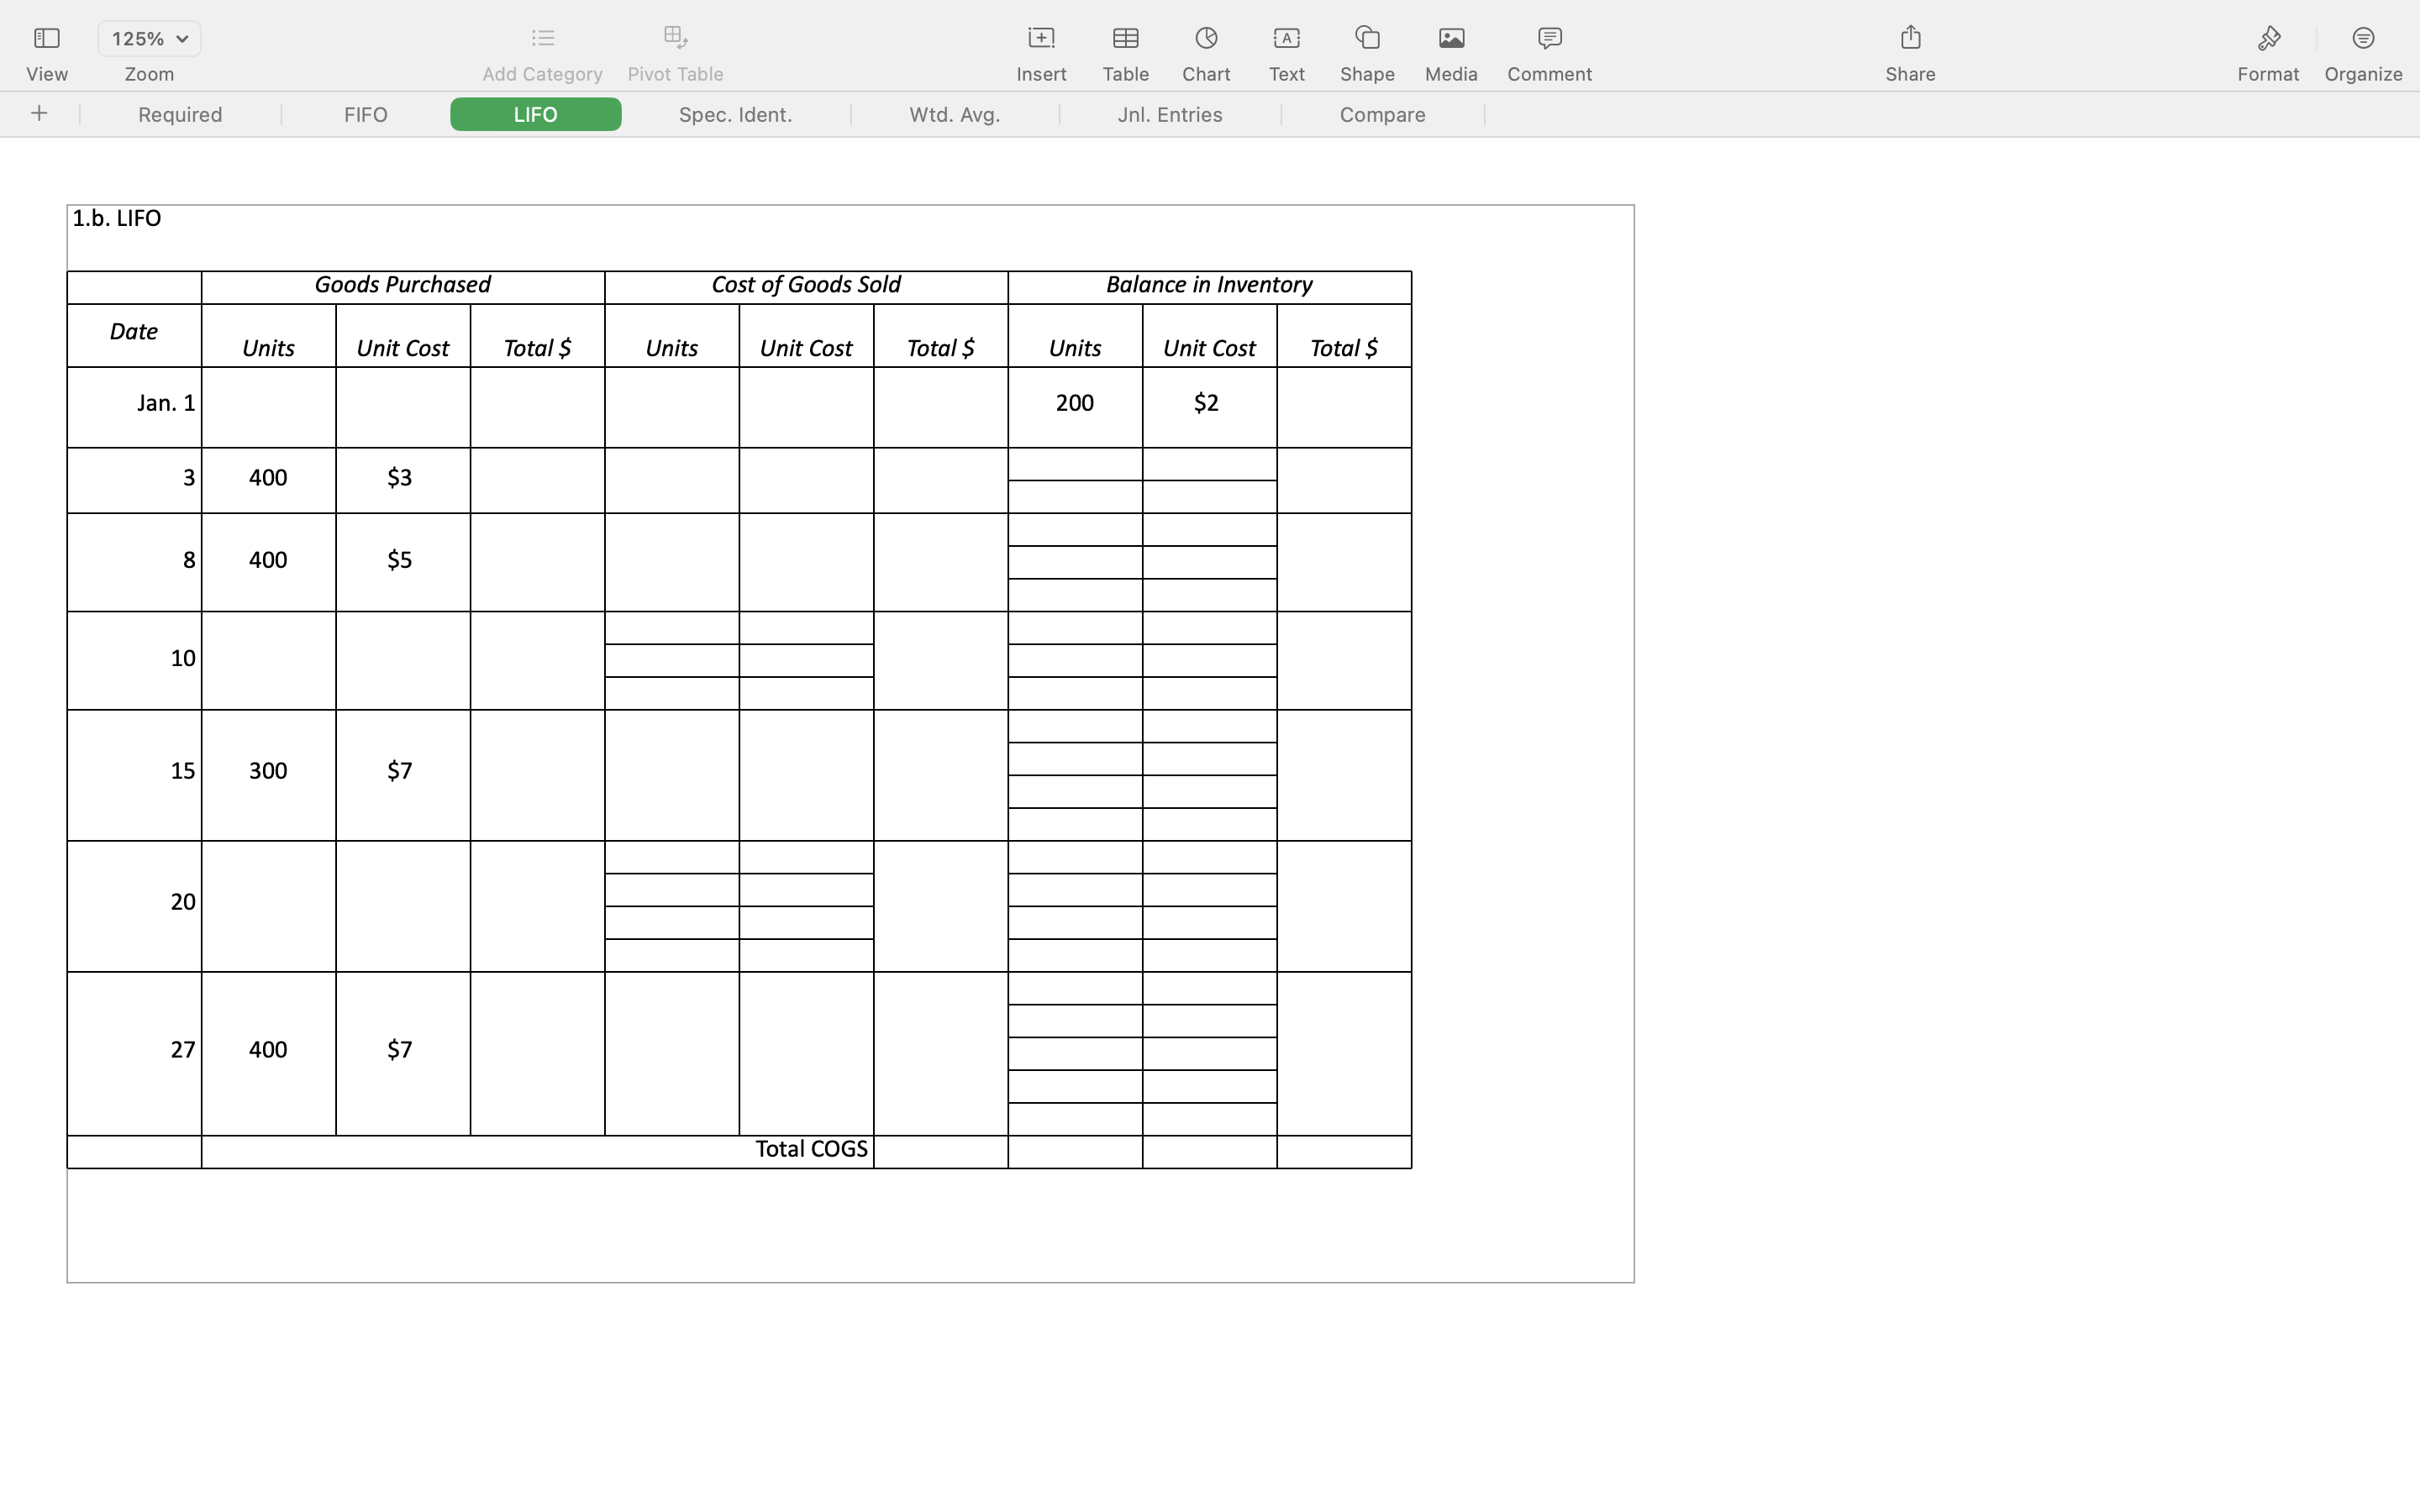
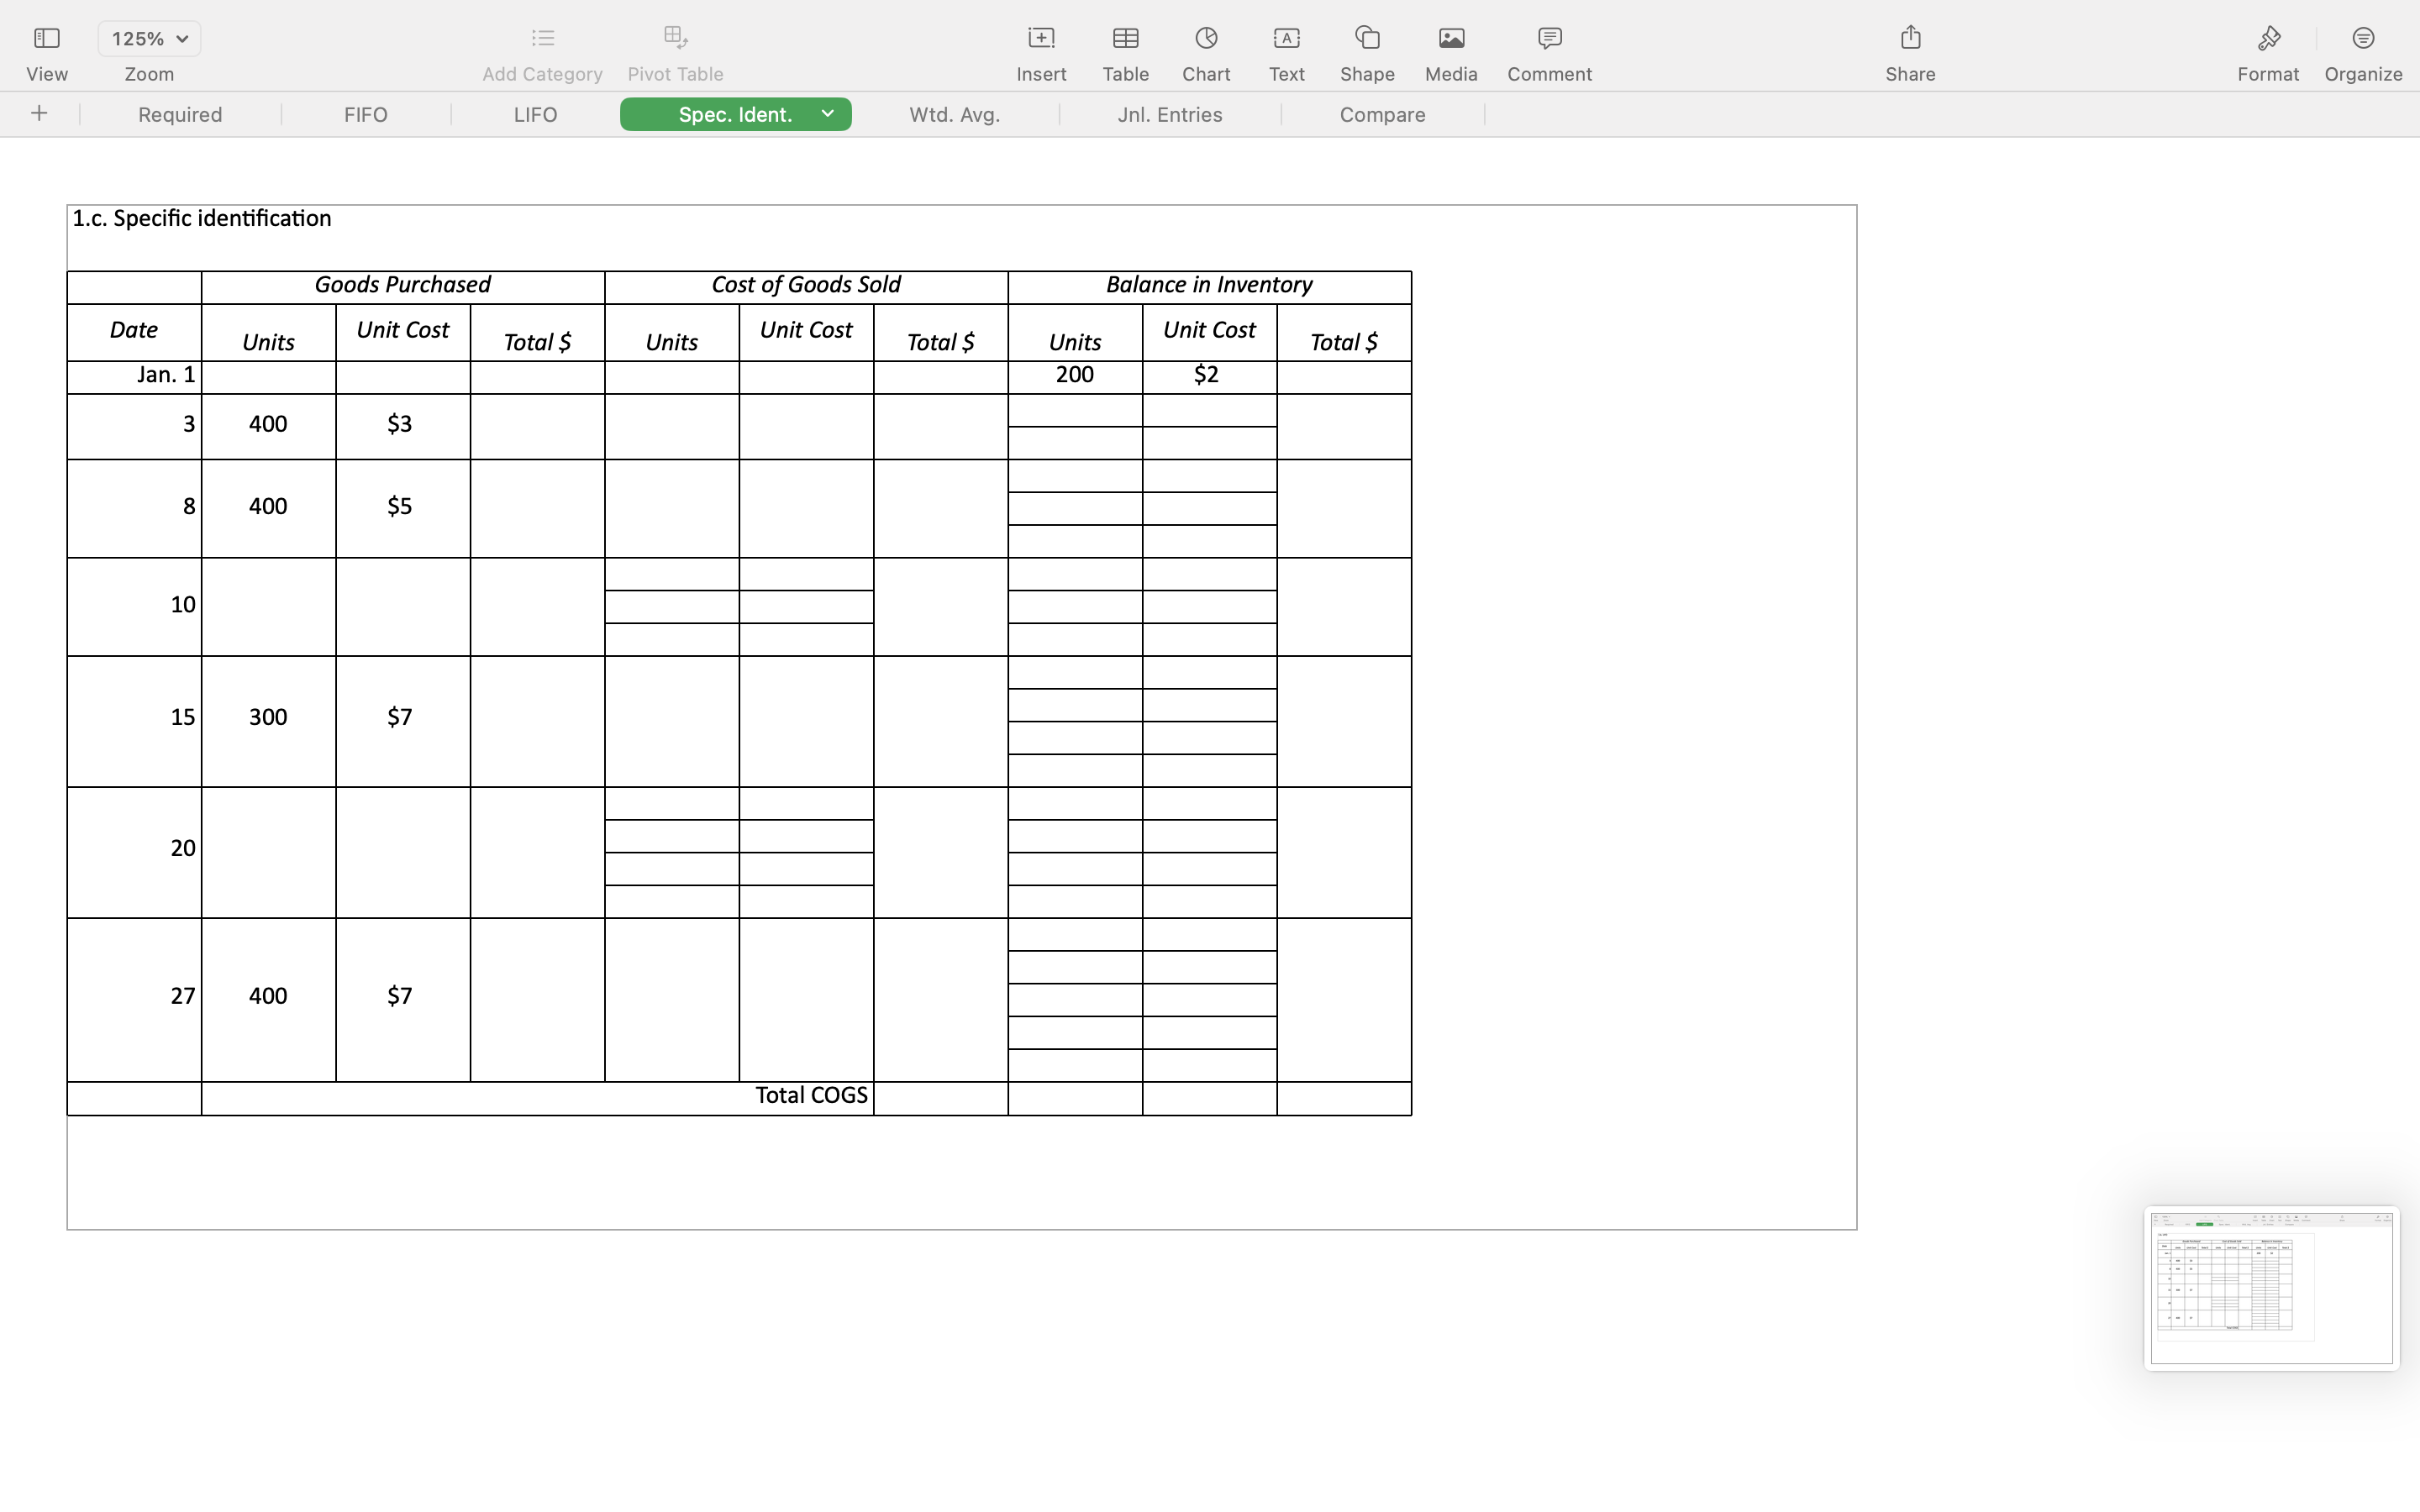
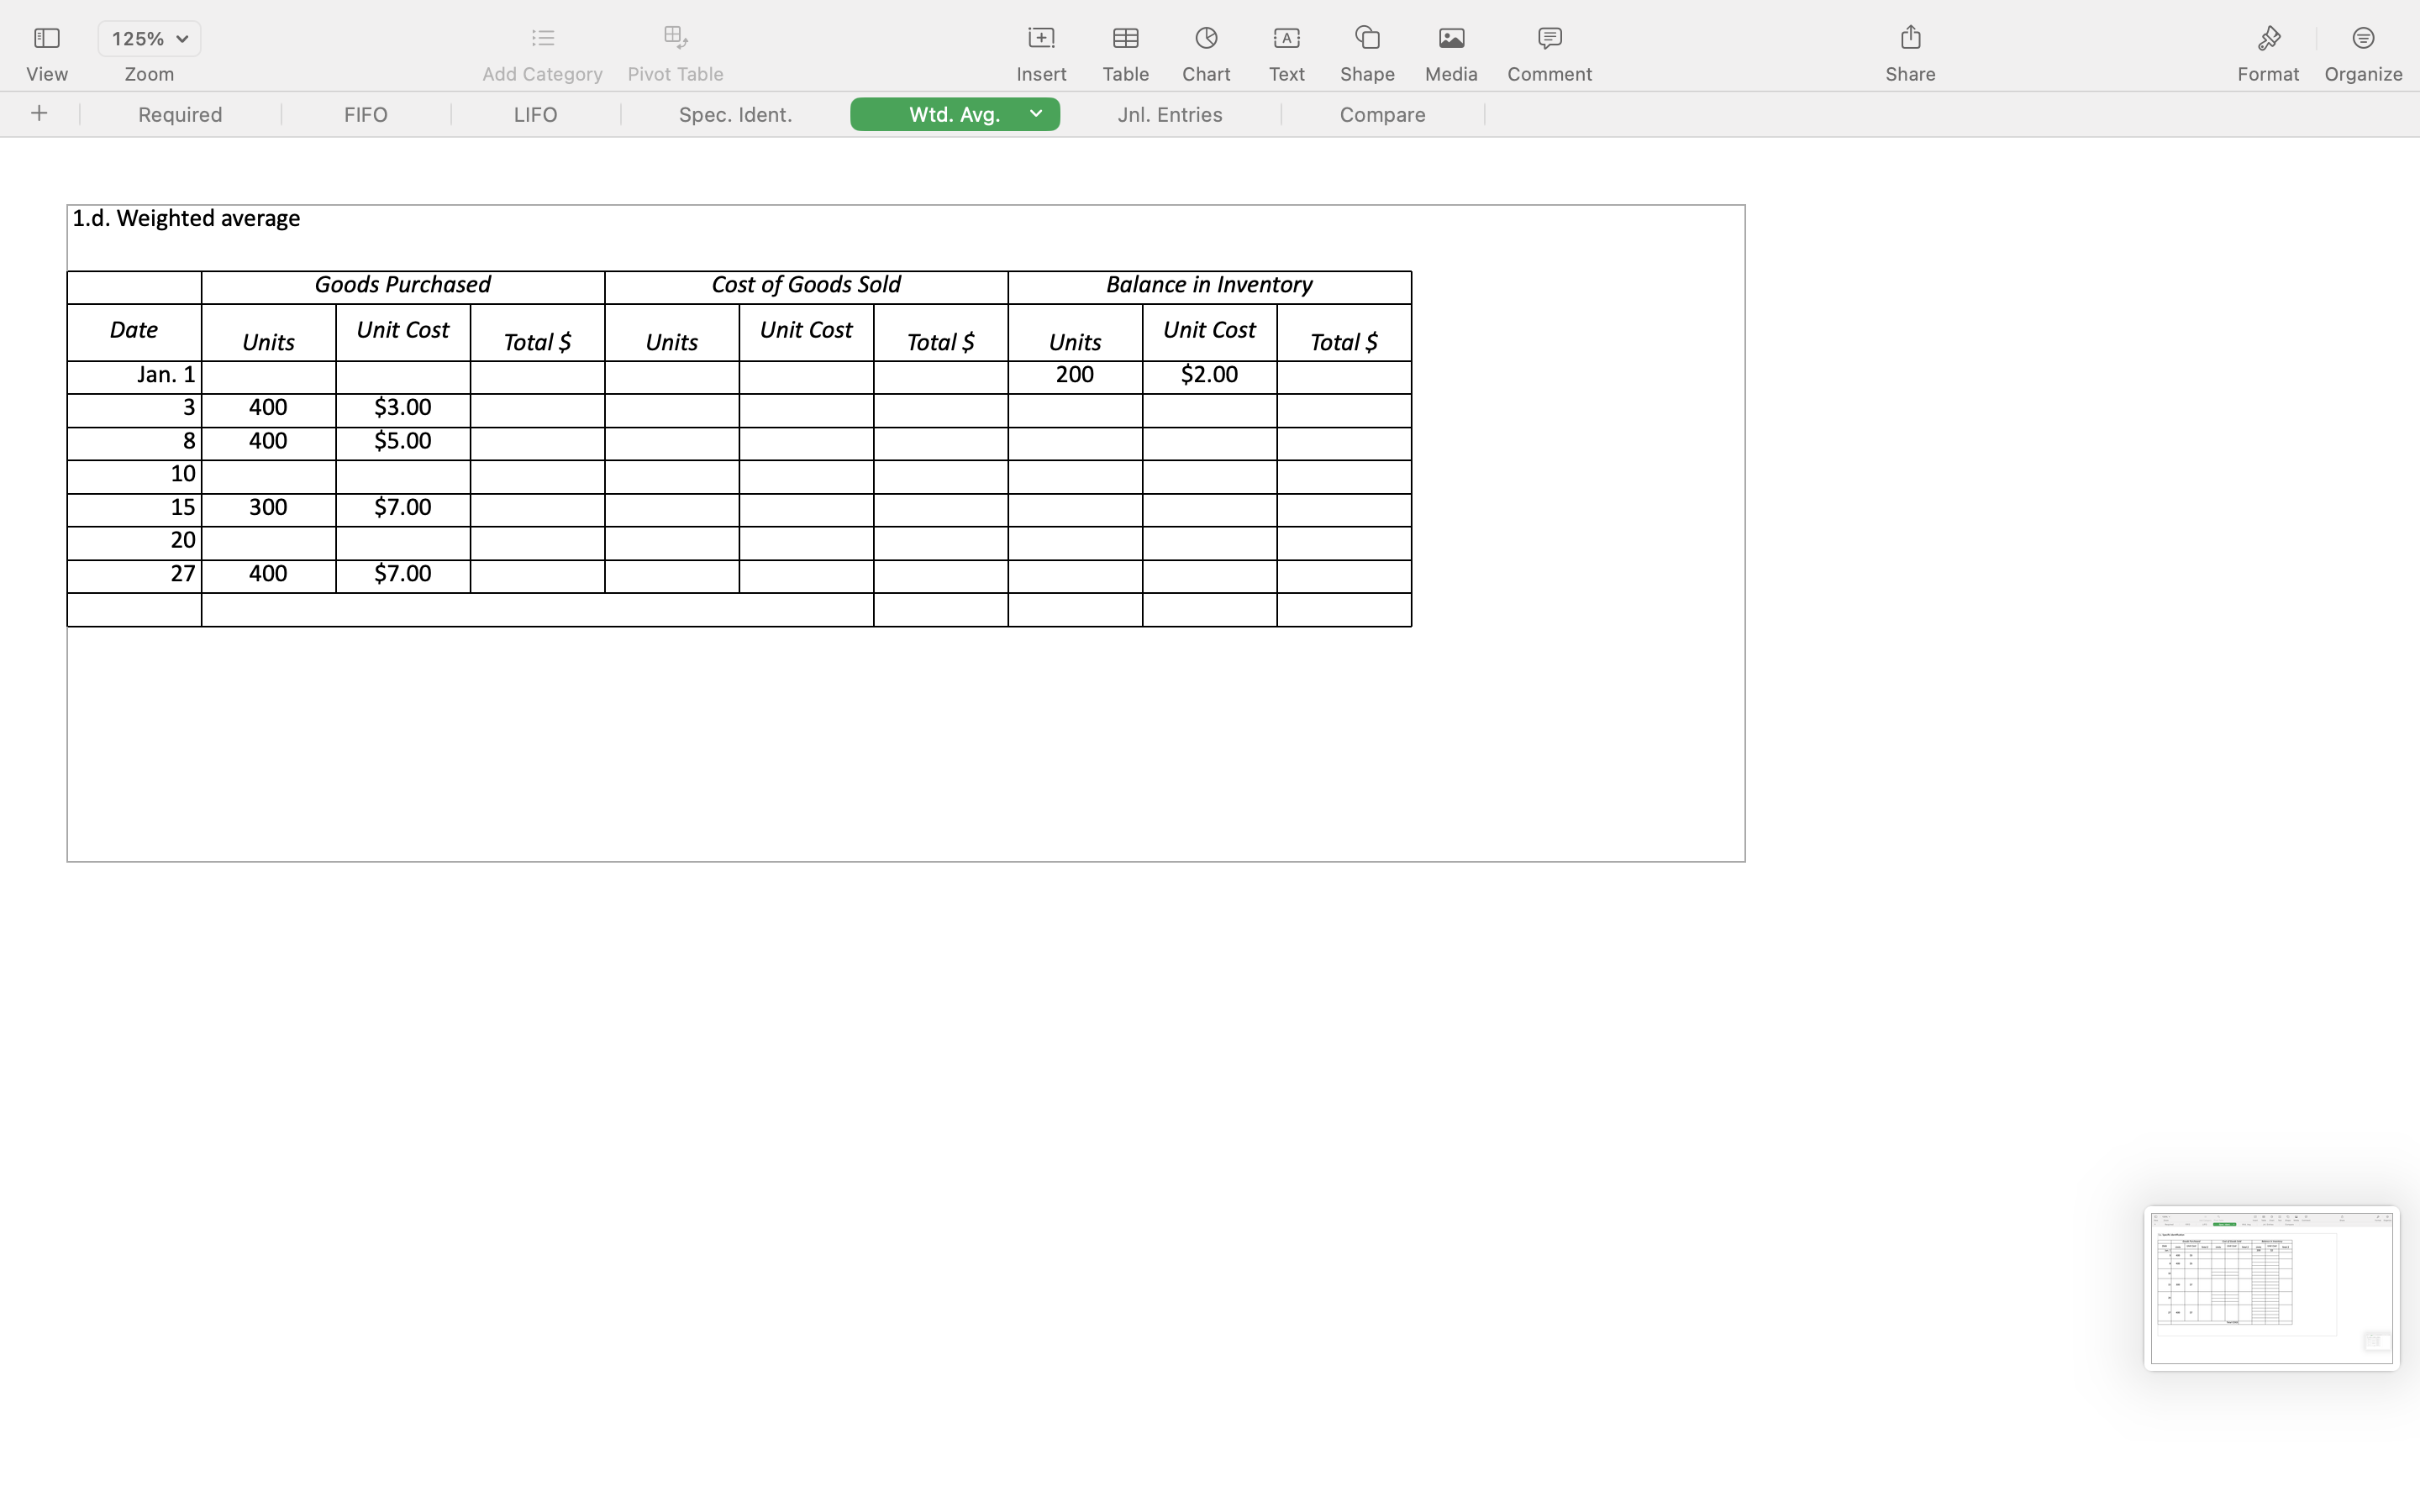
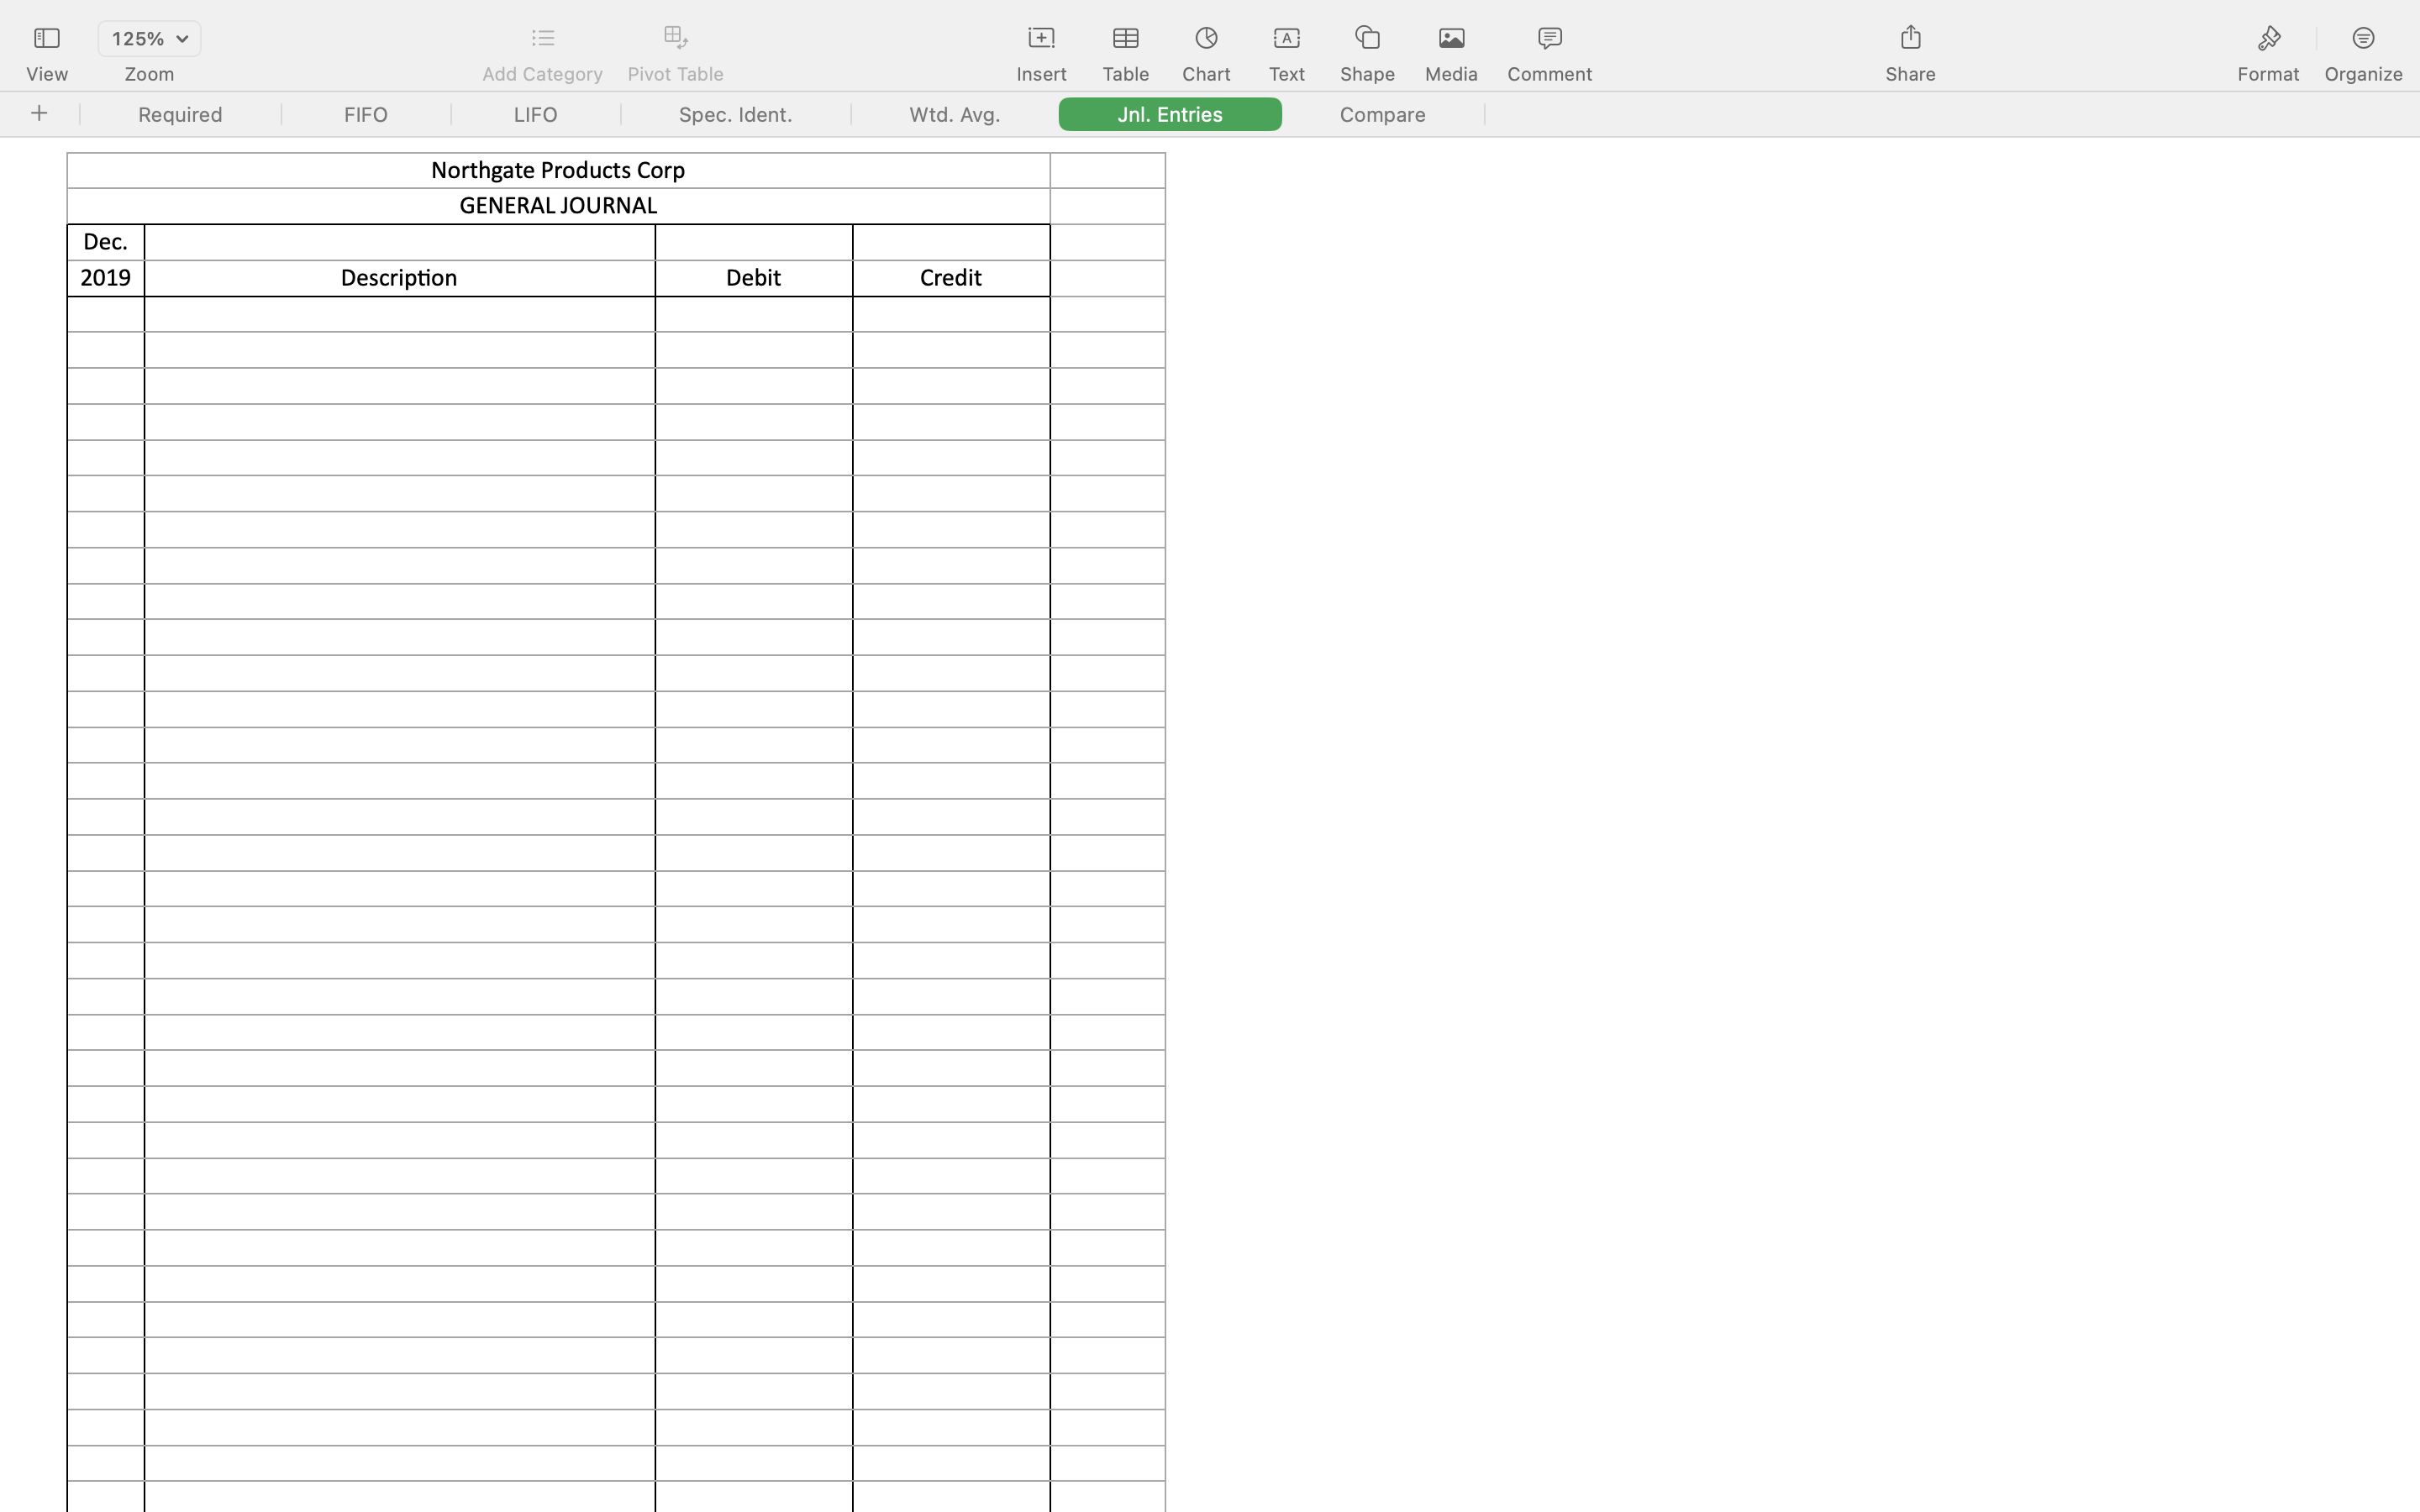
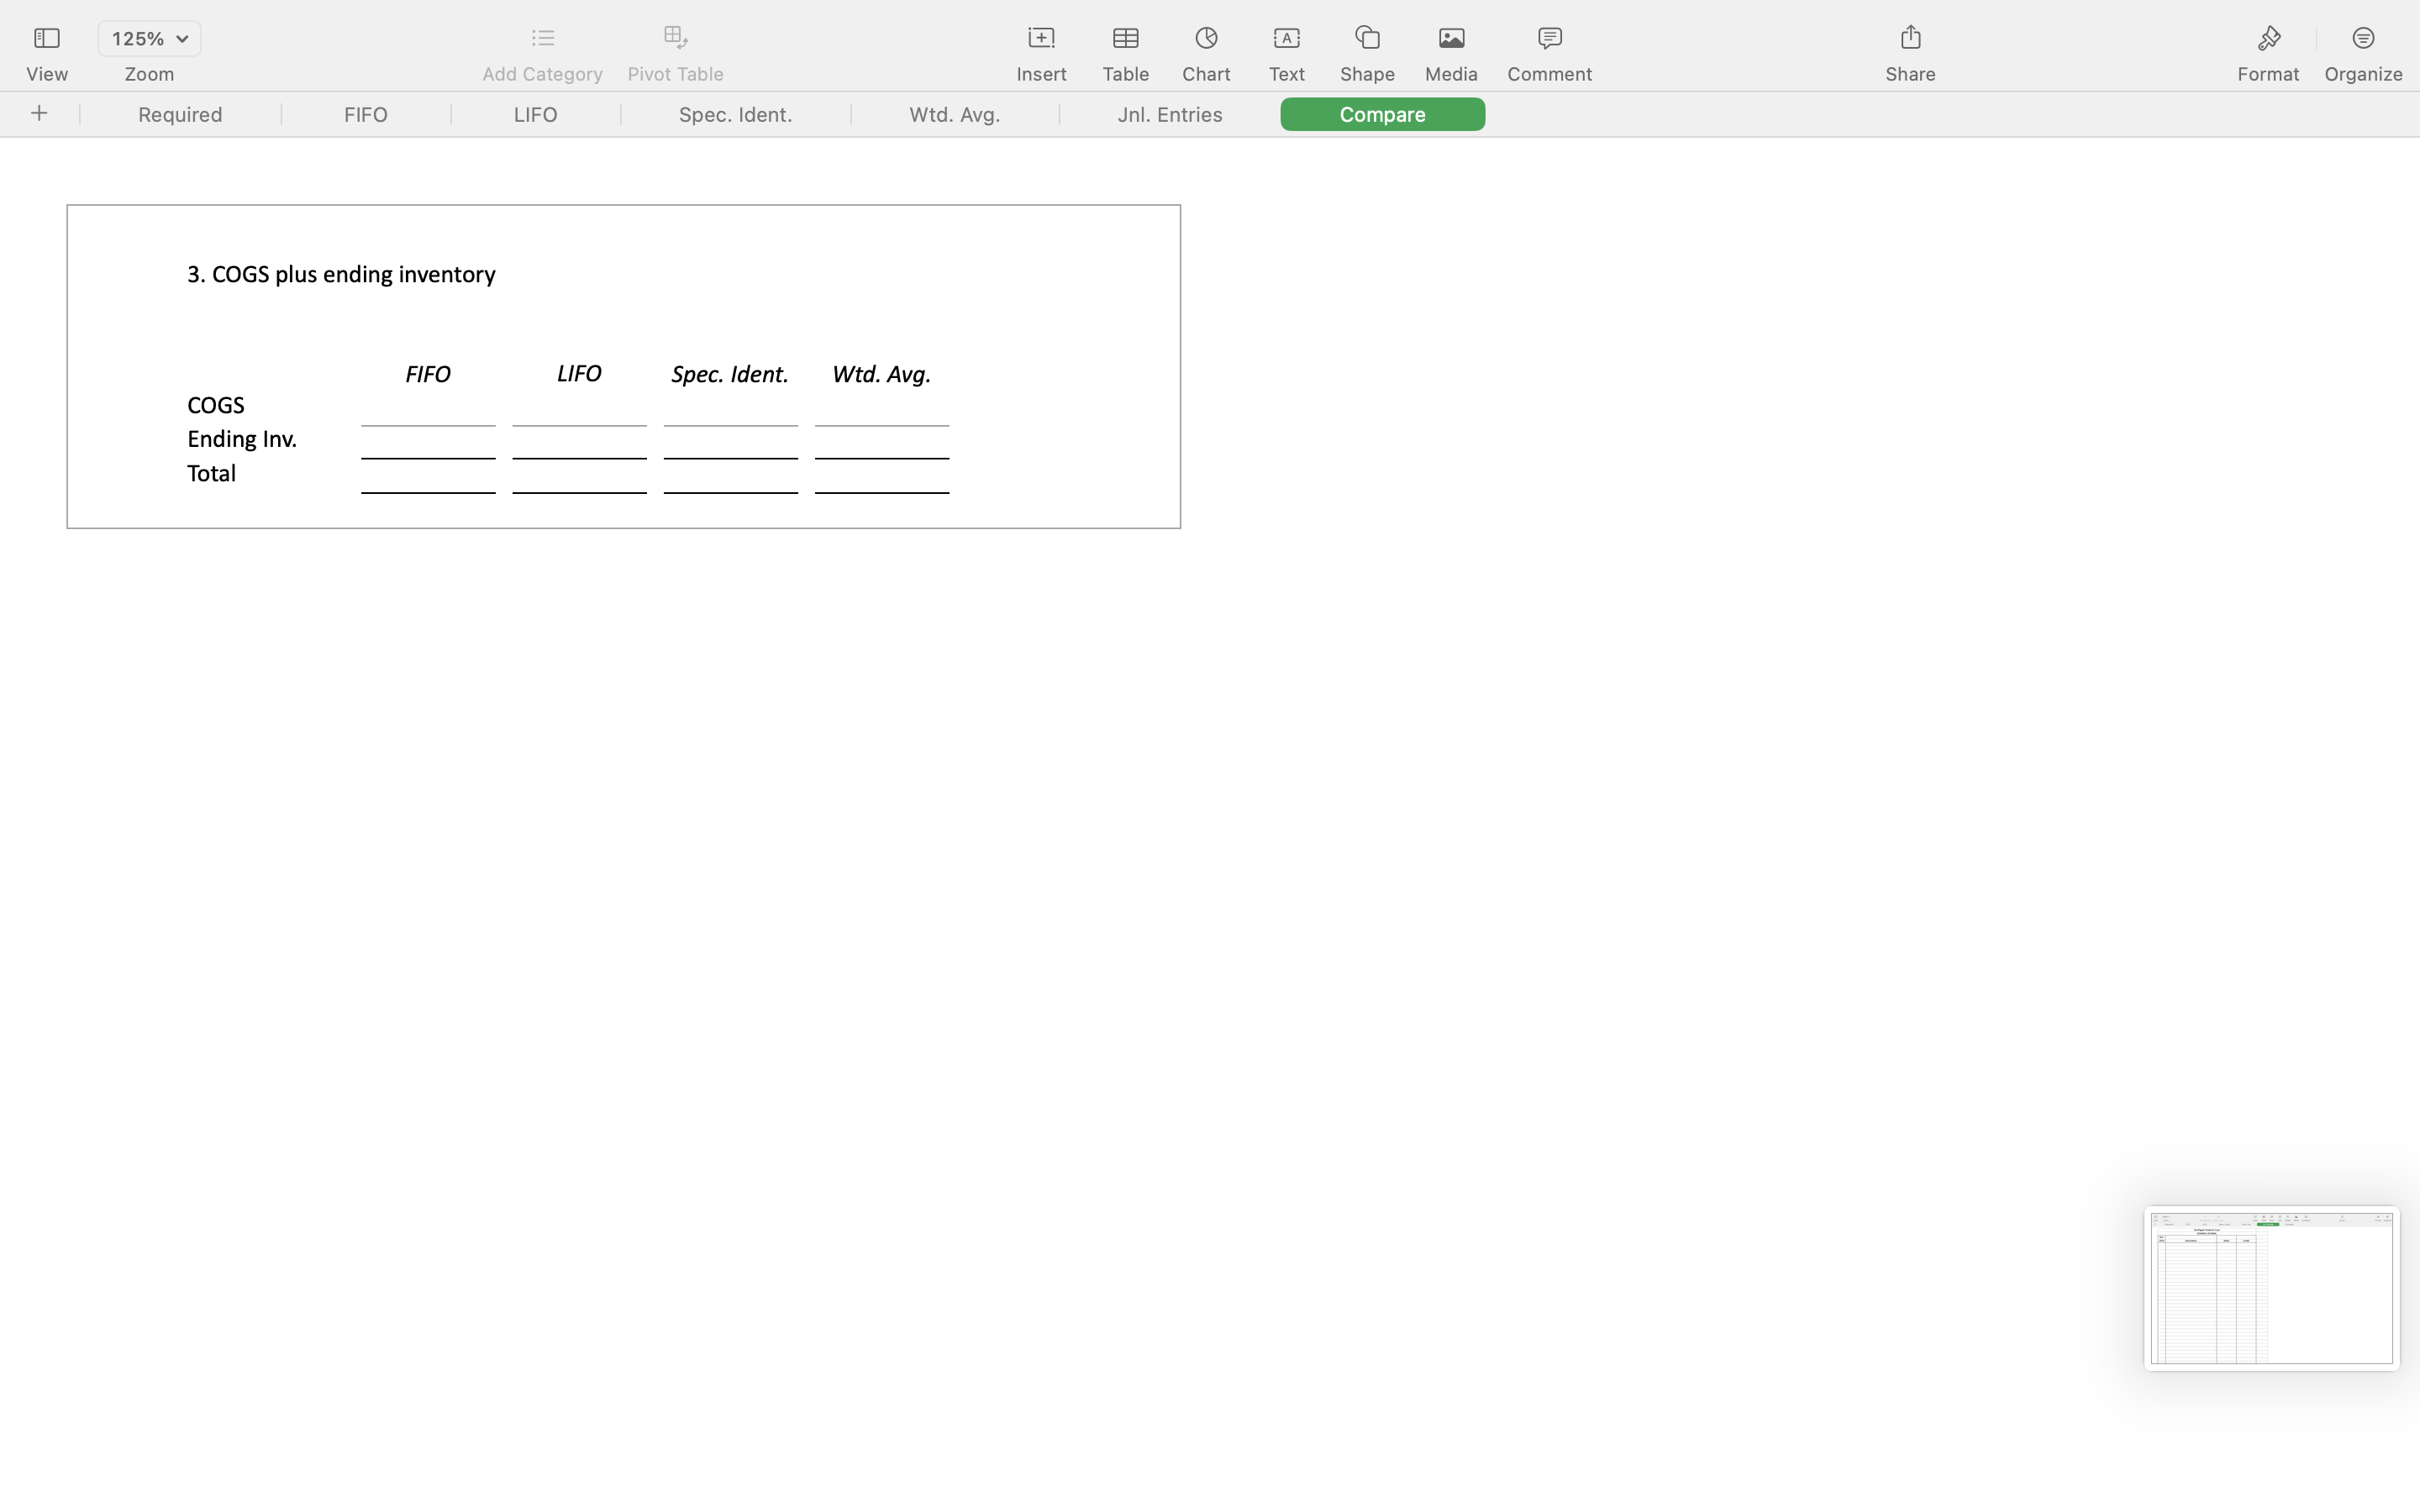
Northgate Products Corp. sells gadgets and uses the perpetual inventory system. During the month of January 2019, the number of gadgets purchased and sold was as follows: Purchased Sold Balance in inventory Date Units Unit cost Total $ Units Unit cost Total $ Units Jan. 1 200 Unit cost $2 Total $ 3 400 $3 8 400 $5 10 700 * 15 300 $7 ** 20 300 27 400 $7 Units were sold for the following amount: Jan 10 Jan 20 $11 $12 *for specific identification, units sold on June 10 came from: Opening inventory Jan. 3 purchase Jan. 8 purchase 0 380 320 700 **for specific identification, units sold on June 20 came from: Opening inventory Jan. 3 purchase Jan. 8 purchase 0 0 60 Jan. 15 purchase Required: 240 300 1 Complete the applicable inventory record card, and calculate cost of goods sold and the cost of ending inventory under each of the following inventory cost flow assumptions: a. FIFO b. LIFO c. Specific identification d. Weighted average. 2 Prepare the journal entries required to record purchases and sales using the FIFO inventory cost flow View 125% E + A M Zoom Add Category Pivot Table Insert Table Chart Text Shape Media Comment Share Format Organize + Required FIFO LIFO Spec. Ident. Wtd. Avg. Jnl. Entries Compare Date Units Unit cost Total $ Units Unit cost Total $ Jan. 1 Units 200 Unit cost Total $ $2 3 400 $3 8 400 $5 10 700 * 15 300 $7 ** 20 300 27 400 $7 Units were sold for the following amount: Jan 10 Jan 20 $11 $12 *for specific identification, units sold on June 10 came from: Opening inventory Jan. 3 purchase Jan. 8 purchase 0 380 320 700 **for specific identification, units sold on June 20 came from: Opening inventory Jan. 3 purchase Jan. 8 purchase Jan. 15 purchase Required: 0 0 60 240 300 1 Complete the applicable inventory record card, and calculate cost of goods sold and the cost of ending inventory under each of the following inventory cost flow assumptions: a. FIFO b. LIFO c. Specific identification d. Weighted average. 2 Prepare the journal entries required to record purchases and sales using the FIFO inventory cost flow assumption. Descriptions are not necessary. 3 Refer to the "Compare" page. Calculate the sum of cost of goods sold and ending inventory balances under each of the four inventory cost flow assumptions. Explain the results. View 125% ||| + A M Zoom Add Category Pivot Table Insert Table Chart Text + Required FIFO LIFO Spec. Ident. Wtd. Avg. Jnl. Entries Shape Compare Media Comment Share Format Organize 1.a. FIFO Goods Purchased Cost of Goods Sold Balance in Inventory Date Units Unit Cost Total $ Units Unit Cost Total $ Units Unit Cost Total $ Jan. 1 200 $2 3 400 $3 8 400 $5 10 15 300 $7 20 20 22 27 400 $7 Total COGS View 125% + A M Zoom Add Category Pivot Table Insert Table Chart Text + Required FIFO LIFO Spec. Ident. Wtd. Avg. Jnl. Entries Shape Compare Media Comment Share Format Organize Goods Purchased Cost of Goods Sold Balance in Inventory Date Units Unit Cost Total $ Units Unit Cost Total $ Units Unit Cost Total $ Jan. 1 200 $2 1.b. LIFO 3 400 $3 8 400 $5 10 10 15 300 $7 20 20 22 27 400 $7 Total COGS 125% !!! + A M View Zoom Add Category Pivot Table Insert Table Chart Text + Required FIFO LIFO Spec. Ident. Wtd. Avg. Jnl. Entries Shape Media Comment Compare Share Format Organize 1.c. Specific identification Balance in Inventory Goods Purchased Cost of Goods Sold Date Unit Cost Unit Cost Units Total $ Units Total $ Jan. 1 Units 200 3 400 $3 8 400 $5 10 15 300 $7 20 20 27 22 400 $7 Total COGS Unit Cost Total $ $2 View 125% + A M Zoom Add Category Pivot Table Insert Table Chart Text + Required FIFO LIFO Spec. Ident. Wtd. Avg. Jnl. Entries Shape Compare Media Comment Share Format Organize 1.d. Weighted average Goods Purchased Cost of Goods Sold Date Unit Cost Unit Cost Units Total $ Units Total $ Units Jan. 1 200 3 400 $3.00 8 400 $5.00 10 15 300 $7.00 20 27 400 $7.00 Balance in Inventory Unit Cost Total $ $2.00 View + 125% E + Zoom Add Category Pivot Table Insert A Table Chart Text M Shape Media Comment Share Format Organize Required FIFO LIFO Spec. Ident. Wtd. Avg. Jnl. Entries Compare Northgate Products Corp Dec. 2019 Description GENERAL JOURNAL Debit Credit View 125% + A M Zoom Add Category Pivot Table Insert Table Chart Text Shape Media Comment Share Format Organize + Required FIFO LIFO Spec. Ident. Wtd. Avg. Jnl. Entries Compare 3. COGS plus ending inventory COGS Ending Inv. Total FIFO LIFO Spec. Ident. Wtd. Avg. 16
Step by Step Solution
★★★★★
3.29 Rating (149 Votes )
There are 3 Steps involved in it
Step: 1

Get Instant Access to Expert-Tailored Solutions
See step-by-step solutions with expert insights and AI powered tools for academic success
Step: 2

Step: 3

Ace Your Homework with AI
Get the answers you need in no time with our AI-driven, step-by-step assistance
Get Started


