Answered step by step
Verified Expert Solution
Question
1 Approved Answer
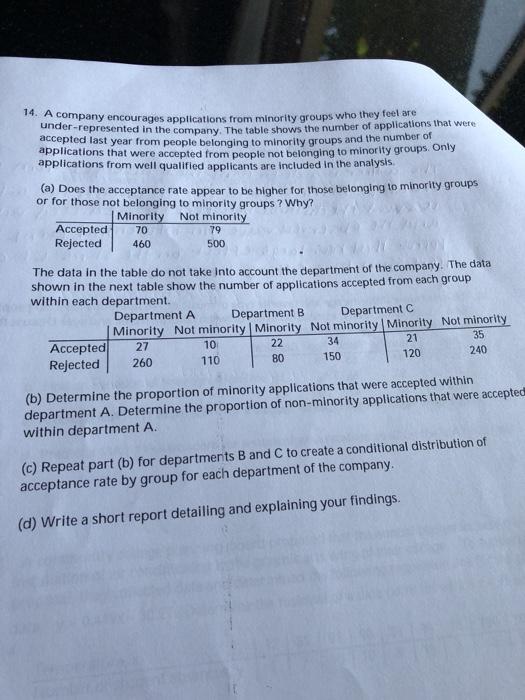
14. A company encourages applications from minority groups who they feel are under-represented in the company. The table shows the number of applications that

14. A company encourages applications from minority groups who they feel are under-represented in the company. The table shows the number of applications that were accepted last year from people belonging to minority groups and the number of applications that were accepted from people not belonging to minority groups. Only applications from well qualified applicants are included in the analysis. (a) Does the acceptance rate appear to be higher for those belonging to minority groups or for those not belonging to minority groups? Why? Accepted Rejected Minority Not minority 70 460 Accepted Rejected 79 500 201 The data in the table do not take into account the department of the company. The data shown in the next table show the number of applications accepted from each group within each department. Department A Department B Department C Minority Not minority | Minority Not minority | Minority Not minority 27 10 22 21 35 110 260 80 120 240 34 150 (b) Determine the proportion of minority applications that were accepted within department A. Determine the proportion of non-minority applications that were accepted within department A. (c) Repeat part (b) for departments B and C to create a conditional distribution of acceptance rate by group for each department of the company. (d) Write a short report detailing and explaining your findings.
Step by Step Solution
★★★★★
3.58 Rating (172 Votes )
There are 3 Steps involved in it
Step: 1
a Application acceptance rate for minority group 70 70 460 0132 Application acceptance rate for nonm...
Get Instant Access to Expert-Tailored Solutions
See step-by-step solutions with expert insights and AI powered tools for academic success
Step: 2

Step: 3

Ace Your Homework with AI
Get the answers you need in no time with our AI-driven, step-by-step assistance
Get Started


