Question
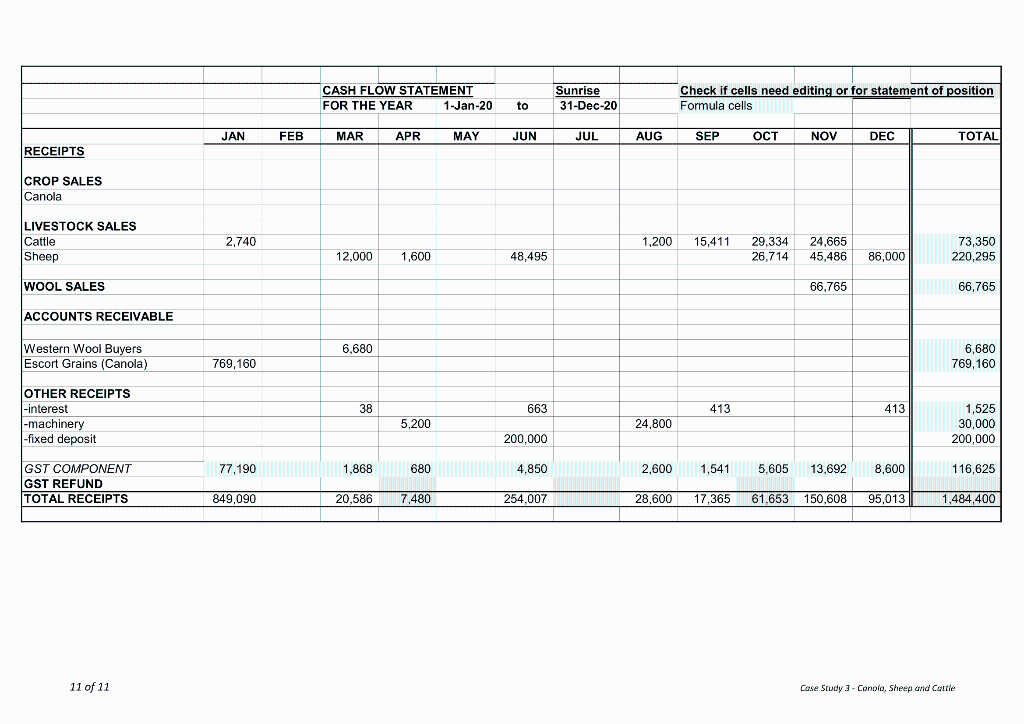
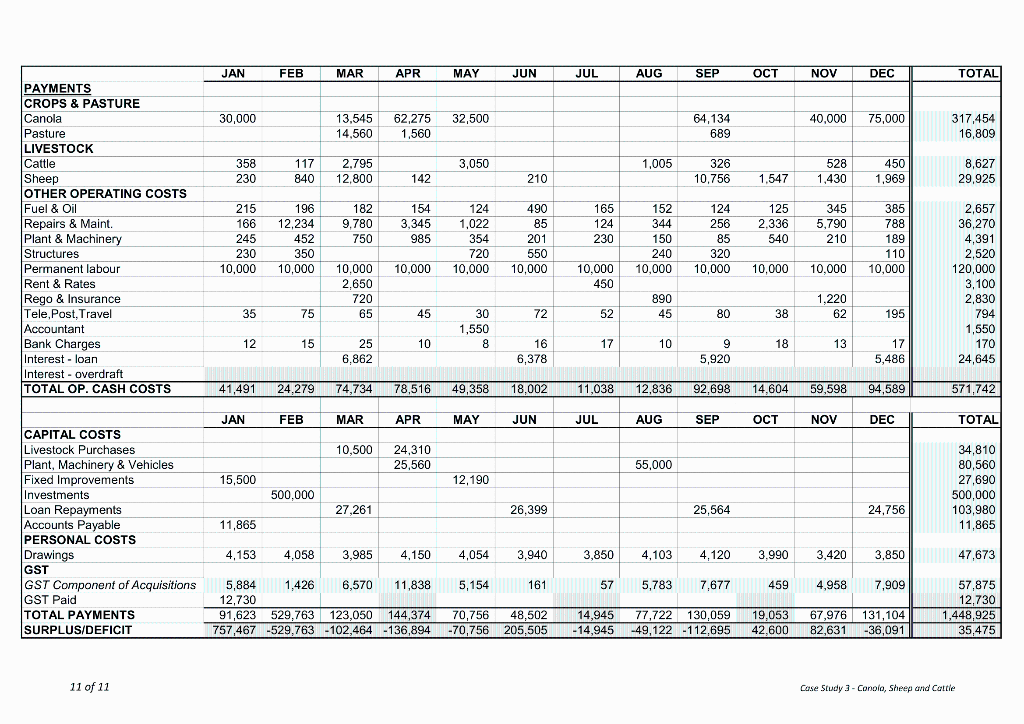
Note - Cash Flow report - In completing the information in the 'CashMth' sheet you will have to include any interest paid by the business
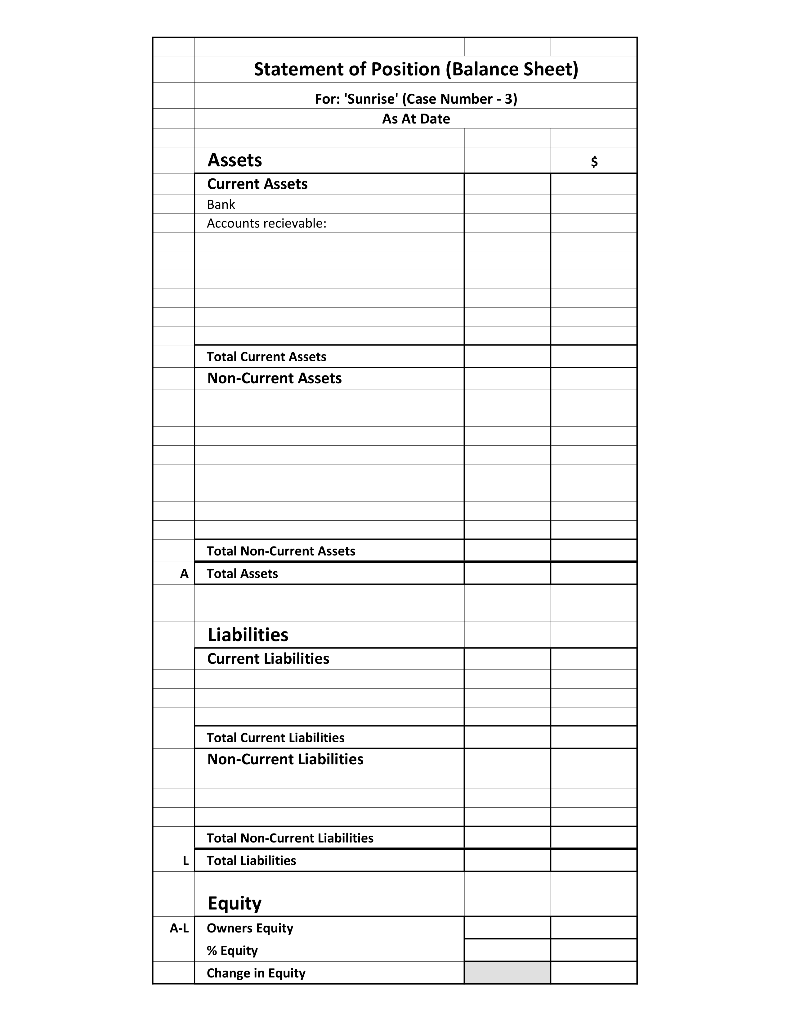
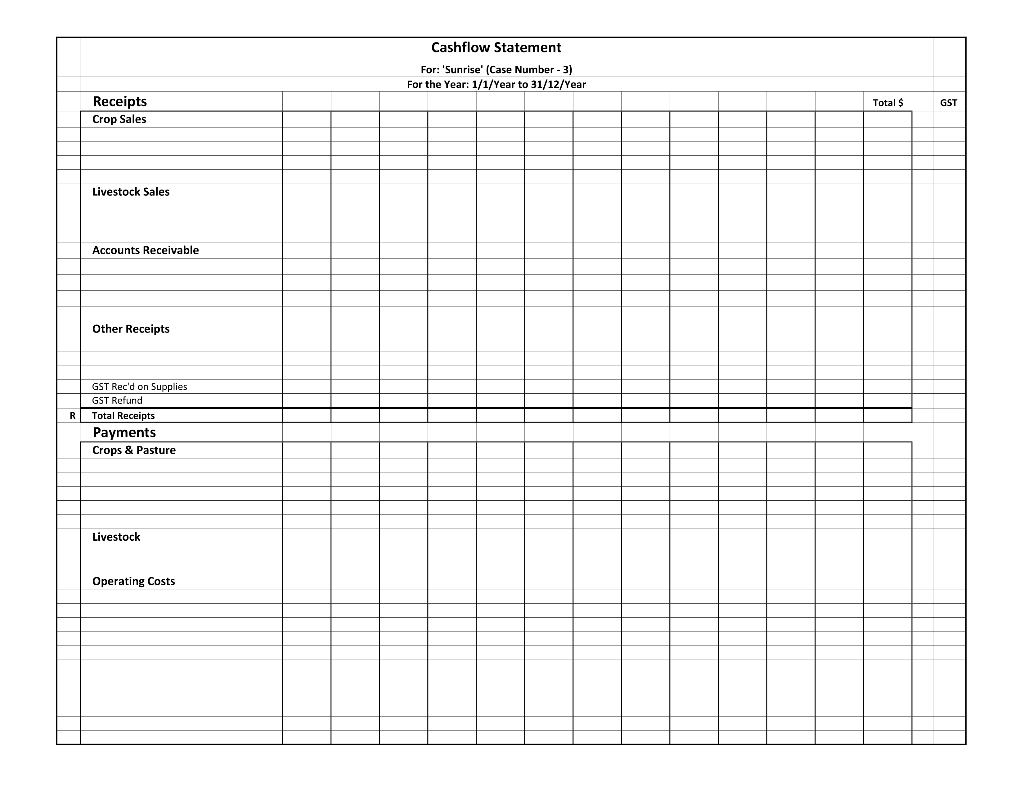
 Note -
Cash Flow report -
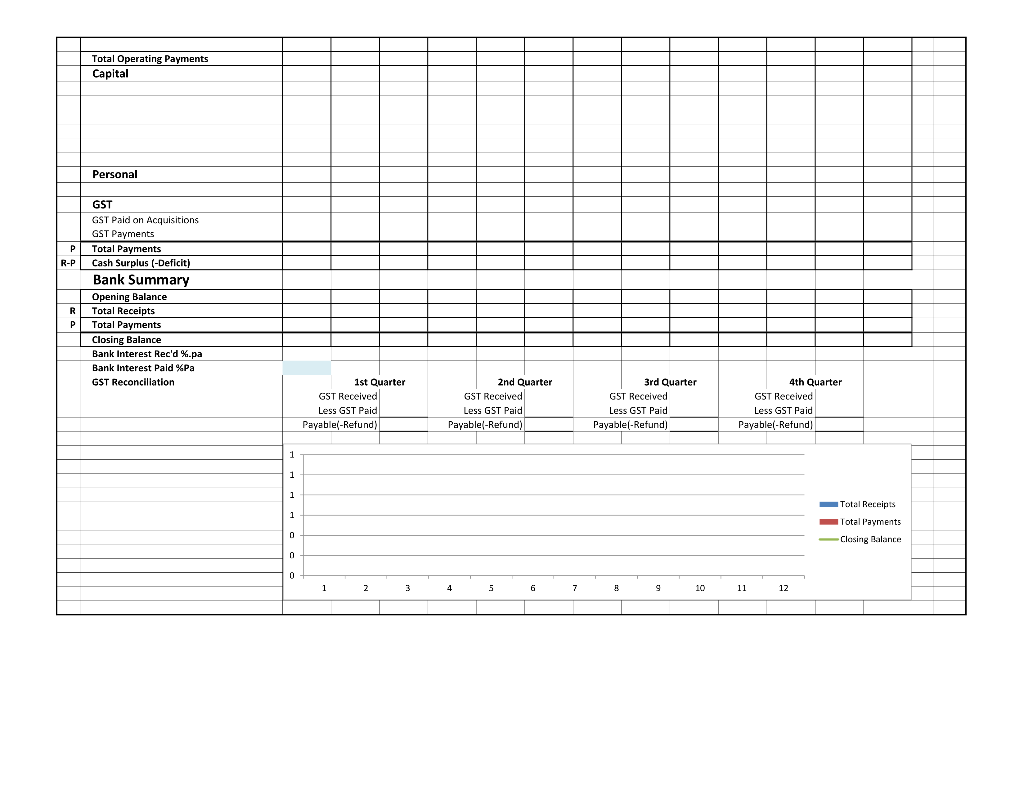
In completing the information in the 'CashMth' sheet you will have to include any interest paid by the business in the row called "interest - Overdraft". At the end of the cash flow report, you will provide the following.
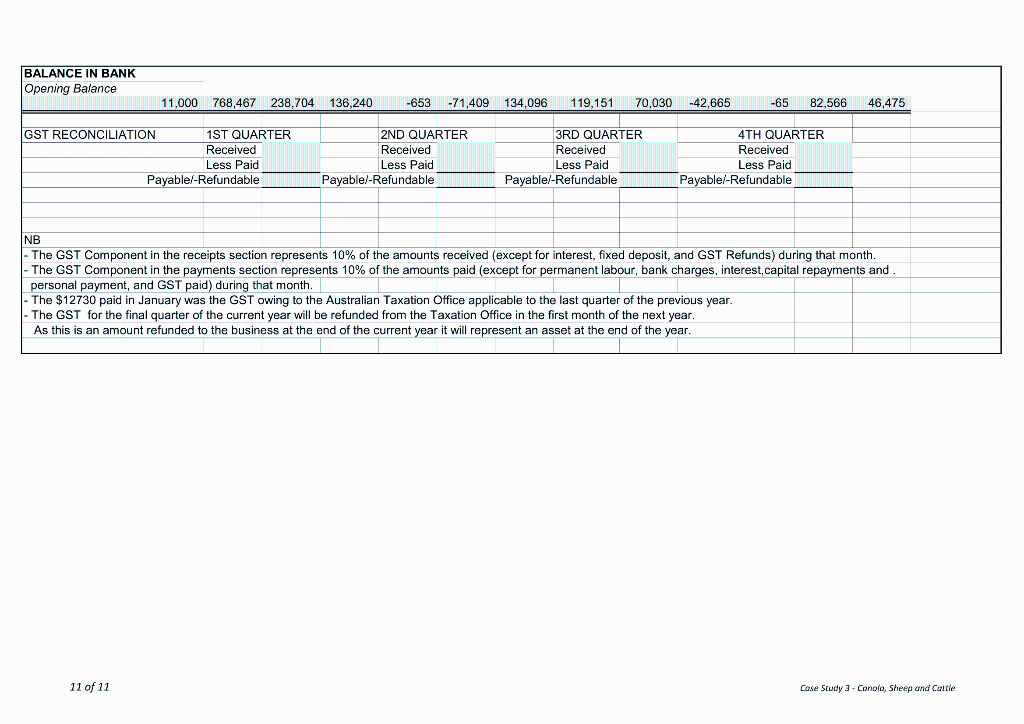
A quarterly GST reconciliation and insert the amount payable or refund receivable in the correct quarter. A graph reflecting receipts, payments and monthly cash flow.
THE RELEVANT INFORMATION WHICH IS TO BE USED IS HIGHLIGHTED IN GREEN HOWEVER IT CAN'T BE SEEN PROPERLY THE CONTENT WHICH IS RELEVANT HAS BLUE AND WHITE LINES BEHIND IT. HOPE IT IS NOT CONFUSING.
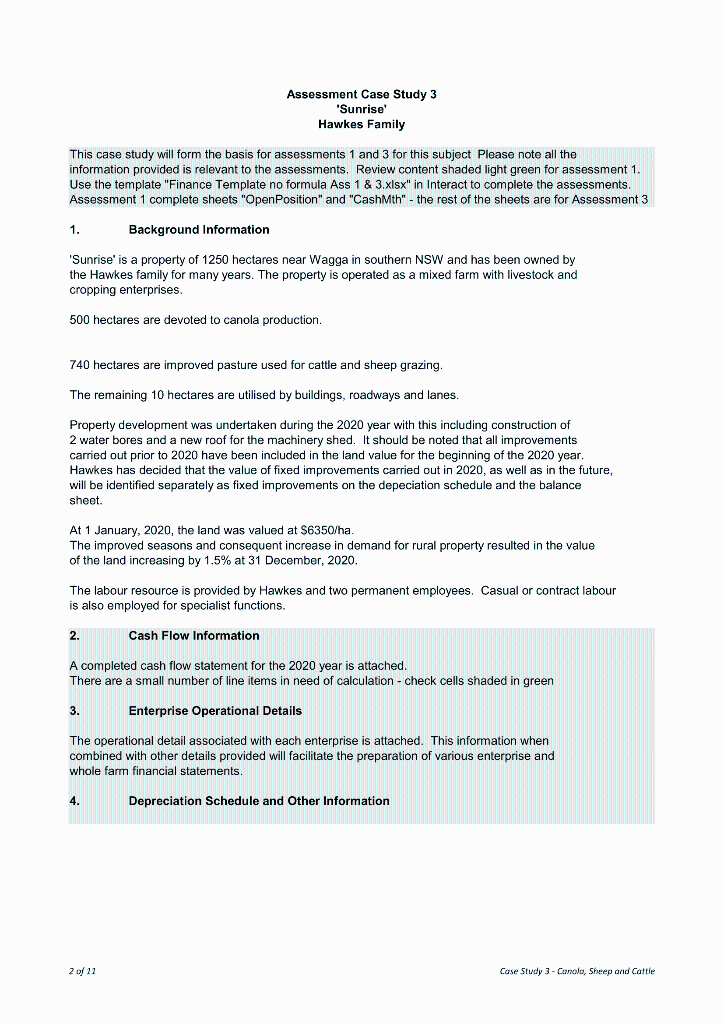
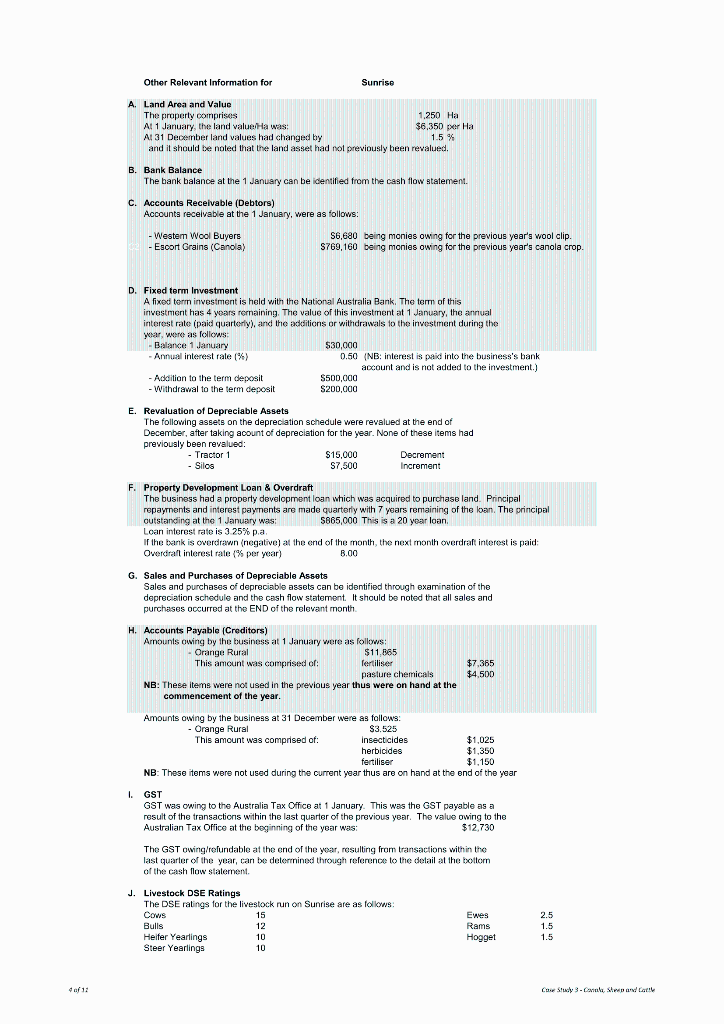
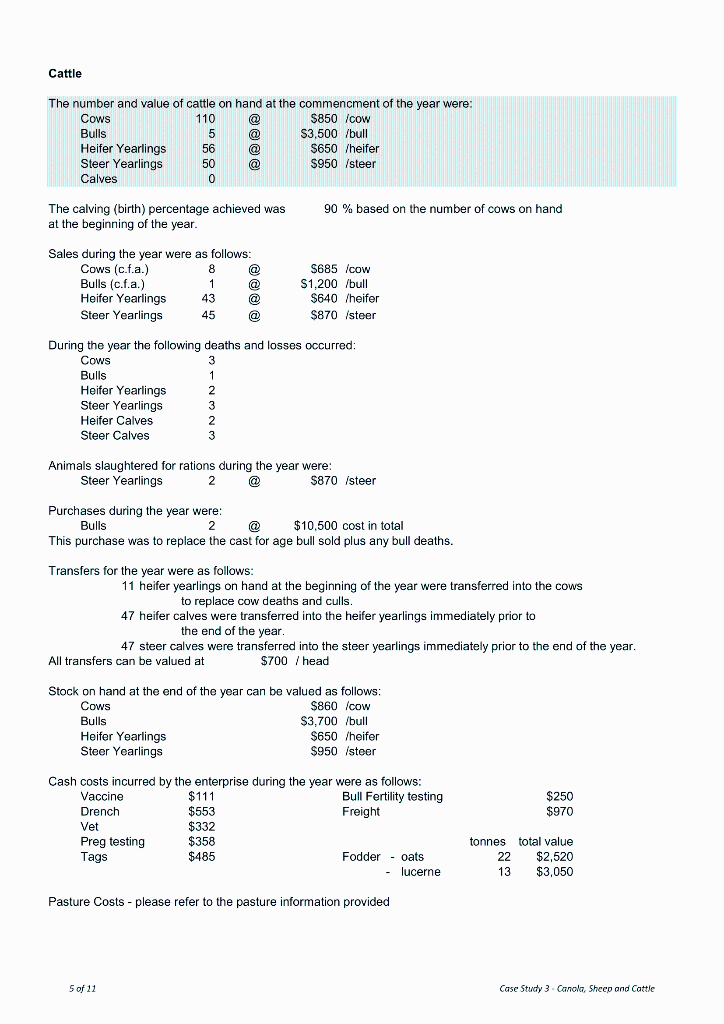
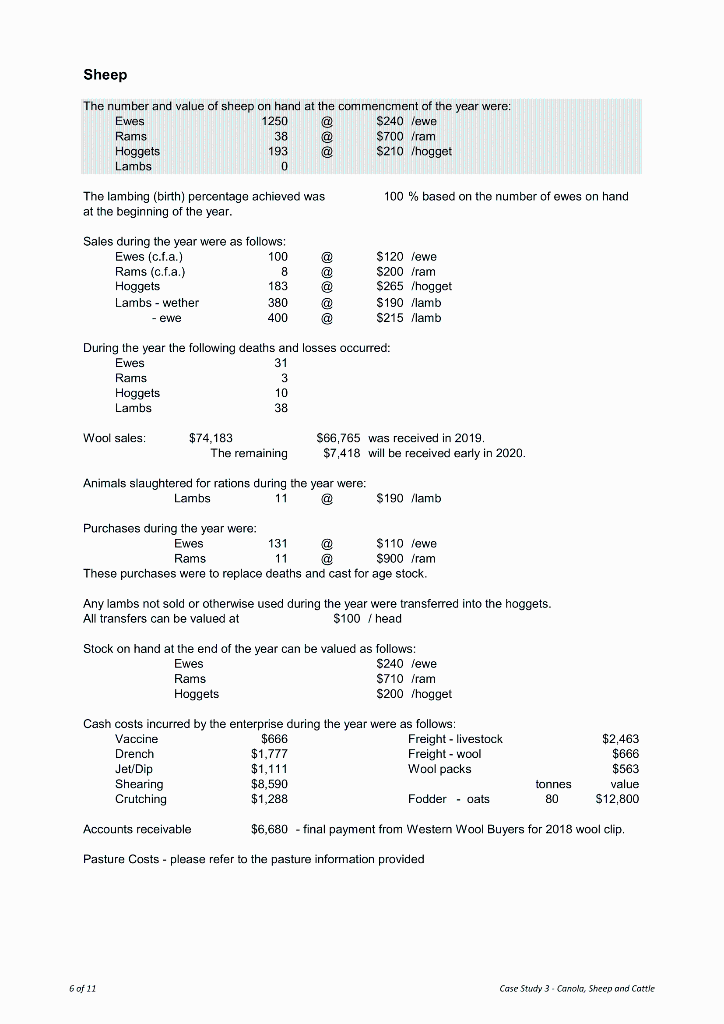
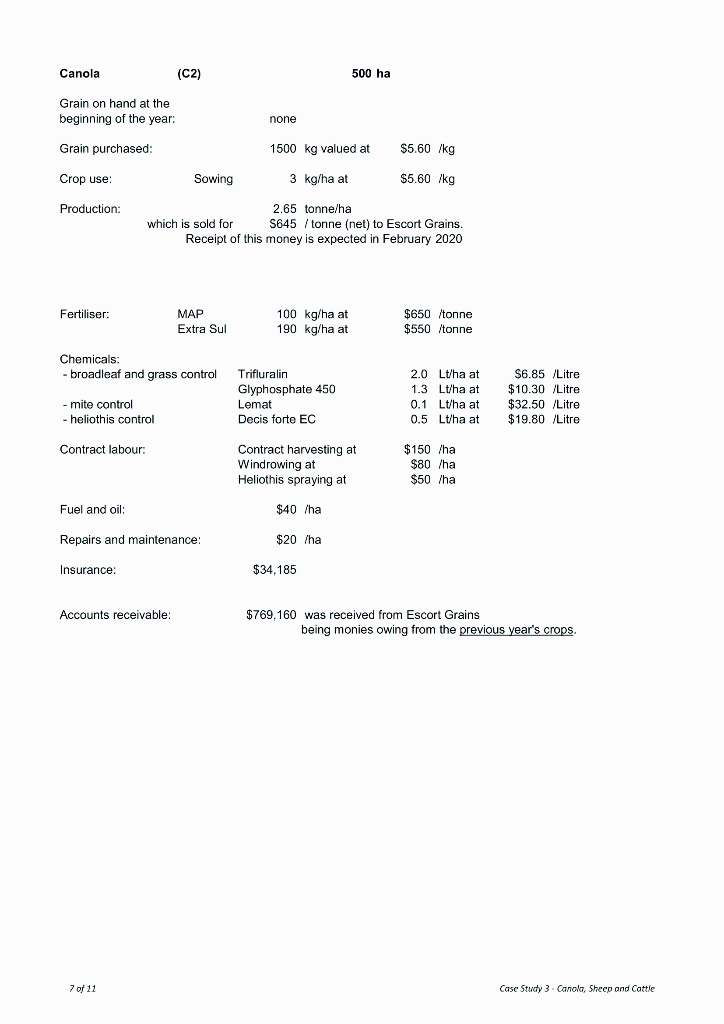
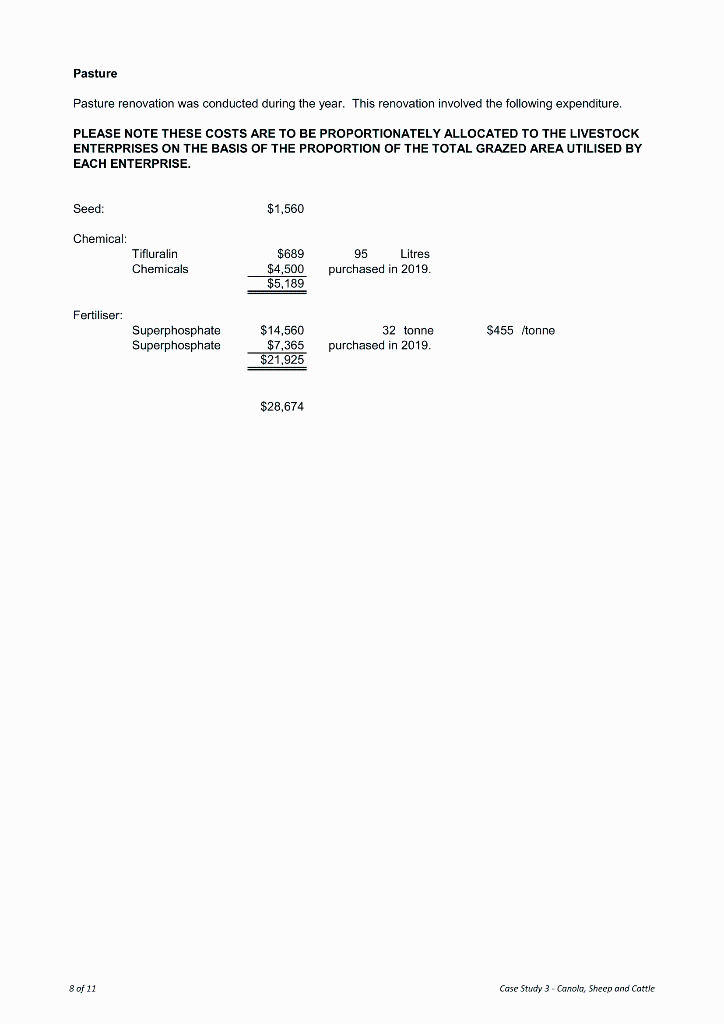
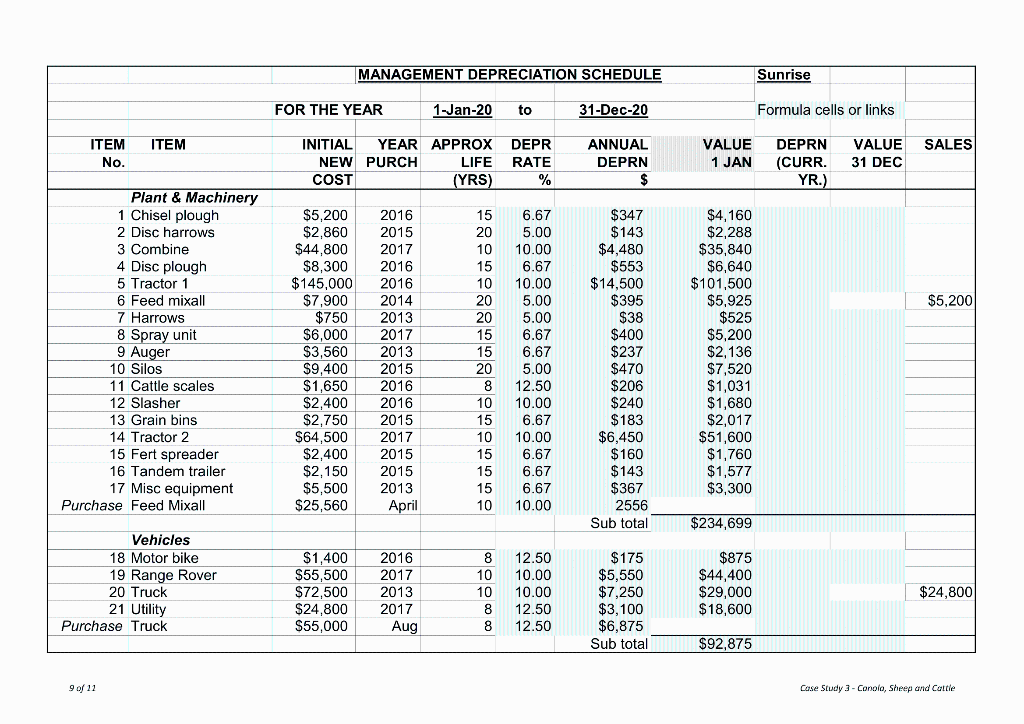
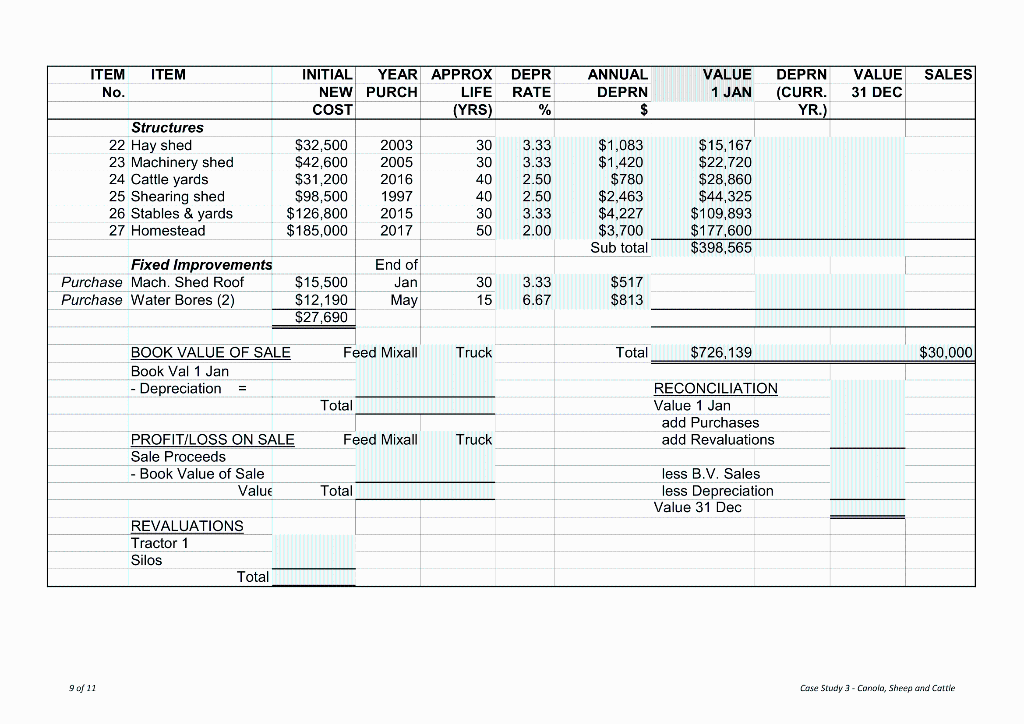
Assessment Case Study 3 'Sunrise Hawkes Family This case study will form the basis for assessments 1 and 3 for this subject Please note all the information provided is relevant to the assessments. Review content shaded light green for assessment 1. Use the template "Finance Template no formula Ass 1 & 3.xlsx" in Interact to complete the assessments Assessment 1 complete sheets "OpenPosition" and "CashMth" - the rest of the sheets are for Assessment 3 1. Background Information Sunrise' is a property of 1250 hectares near Wagga in southern NSW and has been owned by the Hawkes family for many years. The property is operated as a mixed farm with livestock and cropping enterprises. 500 hectares are devoted to canola production. 740 hectares are improved pasture used for cattle and sheep grazing. The remaining 10 hectares are utilised by buildings, roadways and lanes. Property development was undertaken during the 2020 year with this including construction of 2 water bores and a new roof for the machinery shed. It should be noted that all improvements carried out prior to 2020 have been included in the land value for the beginning of the 2020 year. Hawkes has decided that the value of fixed improvements carried out in 2020, as well as in the future, will be identified separately as fixed improvements on the depeciation schedule and the balance sheet. At 1 January, 2020, the land was valued at $6350/ha. The improved seasons and consequent increase in demand for rural property resulted in the value of the land increasing by 1.5% at 31 December, 2020. The labour resource is provided by Hawkes and two permanent employees. Casual or contract labour is also employed for specialist functions. 2. Cash Flow Information A completed cash flow statement for the 2020 year is attached. There are a small number of line items in need of calculation - check cells shaded in green 3. Enterprise Operational Details The operational detail associated with each enterprise is attached. This information when combined with other details provided will facilitate the preparation of various enterprise and whole farm financial statements. 4. Depreciation Schedule and Other Information 2 of 22 Case Study 3 - Canola, Sheep and Cattle Other Relevant Information for Sunrise A. Land Area and Value The property comprises 1.250 Ha Al 1 January, the land value Hawas: $6,350 per Ha Al 31 December land values had changed by 1.5 % and it should be noted that the land asset had not previously been revalued. B. Bank Balance The bank balance at the 1 January can be identified from the cash flow statement. C. Accounts Receivable (Debtors) Accounts receivable at the 1 January, were as follows: - Westem Wool Buyers S6,680 being monies owing for the previous year's wool clip. - Escort Grains (Canola) S769,160 being monies owing for the previous year's canola crop D. Fixed term Investment A fixed term investment is held with the National Australia Bank. The term of this investment has 4 years remaining. The value of this investment at 1 January, the annual interest rate (paid quarterly), and the additions or withdrawals to the investment during the year, were as follows: - Balance 1 January $30,000 - Annual interest rate (%) 0.50 (NB: interest is paid into the business's bank account and is not added to the investment.) - Addition to the term deposit $500,000 - Withdrawal to the term deposit $200,000 E. Revaluation of Depreciable Assets The following assets on the depreciation schedule were revalued at the end of December, after taking acount of depreciation for the year. None of these items had previously been revalued: - Tractor 1 $15,000 Decrement - Silos S7,500 Increment F. Property Development Loan & Overdraft The business had a property development loan which was acquired to purchase land. Principal repayments and interest payments are made quarterly with 7 years remaining of the loan. The principal outstanding at the 1 January was 5865,000 This is a 20 year loan, Loan interest rate is 3 25% pa If the bank is overdrawn (negative) at the end of the month, the next month overdraft interest is paid: Overdraft interest rale % per year) 8.00 G. Sales and Purchases of Depreciable Assets Sales and purchases of depreciable assets can be identified through examination of the depreciation schedule and the cash flow statement. It should be noted that all sales and purchases occurred at the END of the relevant month H. Accounts Payable (Creditors) Arnounts owing by the business at 1 January were as follows: - Orange Rural $11.865 This amount was comprised of: fertiliser pasture chemicals NB: These items were not used in the previous year thus were on hand at the commencement of the year. $7,365 $4,500 Amounts owing by the business at 31 December were as follows: - Orange Rural $3.525 This amount was comprised of: Insecticides $1,025 herbicides $1,350 fertiliser $1,150 NB: These items were not used during the current year thus are on hand at the end of the year IGST GST was owing to the Australia Tax Office at 1 January. This was the GST payable as a result of the transactions within the last quarter of the previous year. The value owing to the Australian Tax Office at the beginning of the year was: $12,730 The GST owing/refundable at the end of the year, resulting from transactions within the last quarter of the year, can be determined through reference to the detail at the bottom of the cash flow statement J. Livestock DSE Ratings The DSE ratings for the livestock run on Sunrise are as follows Cows 15 Bulls 12 Heifer Yearlings 10 Steer Yearlings 10 Ewes Rams Hogget 2.5 1.5 1.5 do1: Co Study 3 Col, Strand Lark Cattle The number and value of cattle on hand at the commencment of the year were: Cows 110 @ $850 /cow Bulls 5 @ $3.500 /bull Heifer Yearlings 56 @ $650 /heifer Steer Yearlings 50 @ $950 /steer Calves 0 90 % based on the number of cows on hand The calving (birth) percentage achieved was at the beginning of the year. Sales during the year were as follows: Cows (c.f.a.) 8 @ Bulls (c.f.a.) 1 @ Heifer Yearlings 43 @ Steer Yearlings 45 @ S685 Icow $1,200 /bull $640 /heifer $870 /steer During the year the following deaths and losses occurred: Cows 3 Bulls 1 Heifer Yearlings 2 Steer Yearlings 3 Heifer Calves 2 Steer Calves 3 Animals slaughtered for rations during the year were: Steer Yearlings 2 @ $870 /steer Purchases during the year were: Bulls 2 @ $10.500 cost in total This purchase was to replace the cast for age bull sold plus any bull deaths. Transfers for the year were as follows: 11 heifer yearlings on hand at the beginning of the year were transferred into the cows to replace cow deaths and culls. 47 heifer calves were transferred into the heifer yearlings immediately prior to the end of the year. 47 steer calves were transferred into the steer yearlings immediately prior to the end of the year. All transfers can be valued at $700 / head Stock on hand at the end of the year can be valued as follows: Cows $860 Icow Bulls $3.700 /bull Heifer Yearlings $650 /heifer Steer Yearlings $950 /steer $250 $970 Cash costs incurred by the enterprise during the year were as follows: Vaccine $111 Bull Fertility testing Drench $553 Freight Vet $332 Preg testing $358 Tags $485 Fodder - oats - lucerne tonnes total value 22 $2,520 13 $3,050 Pasture Costs - please refer to the pasture information provided 5 of 11 Case Study 3. Canola, Sheep and Cattle Sheep The number and value of sheep on hand at the commencment of the year were: Ewes 1250 @ $240 lewe Rams 38 @ $700 /ram Hoggets 193 @ $210 /hogget Lambs 0 The lambing (birth) percentage achieved was at the beginning of the year. 100 % based on the number of ewes on hand % Sales during the year were as follows: Ewes (c.f.a.) 100 Rams (cf.a.) 8 Hoggets 183 Lambs - wether 380 - ewe 400 @ @ @ @ @ $120 lewe $200 /ram $265 /hogget S190 llamb $215 /lamb During the year the following deaths and losses occurred: Ewes 31 Rams 3 Hoggets 10 Lambs 38 Wool sales: $74,183 The remaining $66,765 was received in 2019. $7,418 will be received early in 2020. Animals slaughtered for rations during the year were: Lambs 11 $190 /lamb Purchases during the year were: Ewes 131 @ $110 lewe Rams 11 @ $900 /ram These purchases were to replace deaths and cast for age stock. Any lambs not sold or otherwise used during the year were transferred into the hoggets. All transfers can be valued at $100 / head Stock on hand at the end of the year can be valued as follows: Ewes $240 lewe Rams $710 /ram Hoggets $200 /hogget Cash costs incurred by the enterprise during the year were as follows: Vaccine $666 Freight - livestock Drench $1.777 Freight - wool Jet/Dip $1,111 Wool packs Shearing $8,590 Crutching $1,288 Fodder - oats $2,463 $666 $563 value $12,800 tonnes 80 Accounts receivable $6,680 - final payment from Westem Wool Buyers for 2018 wool clip Pasture Costs - please refer to the pasture information provided 6 of 11 Case Study 3 - Canola, Sheep and Cattle Canola (C2) 500 ha Grain on hand at the beginning of the year: none Grain purchased: 1500 kg valued at $5.60 /kg Crop use: Sowing 3 kg/ha at $5.60 /kg Production: 2.65 tonne/ha which is sold for S645 / tonne (net) to Escort Grains. Receipt of this money is expected in February 2020 Fertiliser: MAP Extra Sul 100 kg/ha at 190 kg/ha at $650 tonne $550 tonne Chemicals: broadleaf and grass control Trifluralin Glyphosphate 450 Lemat Decis forte EC 2.0 Lt/ha at 1.3 Lt/ha at 0.1 Lt/ha at 0.5 Lt/ha at $6.85 /Litre $10.30 /Litre $32.50 /Litre $19.80 Litre mite control - heliothis control Contract labour: Contract harvesting at Windrowing at Heliothis spraying at $150 /ha $80 /ha $50 /ha Fuel and oil: $40 /ha Repairs and maintenance: $20 /ha Insurance: : $34,185 Accounts receivable: $769,160 was received from Escort Grains being monies owing from the previous year's crops. 7 of 11 Case Study 3. Canola, Sheep and Cattle Pasture Pasture renovation was conducted during the year. This renovation involved the following expenditure. PLEASE NOTE THESE COSTS ARE TO BE PROPORTIONATELY ALLOCATED TO THE LIVESTOCK ENTERPRISES ON THE BASIS OF THE PROPORTION OF THE TOTAL GRAZED AREA UTILISED BY EACH ENTERPRISE. Seed: $1,560 Chemical: Tifluralin Chemicals $689 $4,500 $5,189 95 Litres purchased in 2019 Fertiliser: $455 /tonne Superphosphate Superphosphate $14,560 $7,365 $21.925 32 tonne purchased in 2019. $28,674 8 of 11 Case Study 3 Canola, Sheep and Cattle MANAGEMENT DEPRECIATION SCHEDULE Sunrise FOR THE YEAR 1-Jan-20 to 31-Dec-20 Formula cells or links ITEM No. ITEM SALES INITIAL YEAR APPROX NEW PURCH LIFE COST (YRS) DEPR RATE % ANNUAL DEPRN VALUE 1 JAN DEPRN (CURR. YR.) VALUE 31 DEC 6.67 5.00 10.00 6.67 10.00 5.00 5.00 6.67 $5,200 Plant & Machinery 1 Chisel plough 2 Disc harrows 3 Combine 4 Disc plough 5 Tractor 1 6 Feed mixall 7 Harrows 8 Spray unit 9 Auger 10 Silos 11 Cattle scales 12 Slasher 13 Grain bins 14 Tractor 2 15 Fert spreader 16 Tandem trailer 17 Misc equipment Purchase Feed Mixall $5,200 $2,860 $44.800 $8,300 $145,000 $7,900 $750 $6,000 $3,560 $9,400 $1,650 $2,400 $2,750 $64,500 $2,400 $2,150 $5,500 $25,560 2016 2015 2017 2016 2016 2014 2013 2017 2013 2015 2016 2016 2015 2017 2015 2015 2013 April 15 20 10 15 10 20 20 15 15 20 8 10 15 10 15 15 15 10 6.67 $347 $143 $4,480 $553 $14,500 $395 $38 $400 $237 $470 $206 $240 $183 $6,450 $160 $143 $367 2556 Sub total $4,160 $2,288 $35,840 $6,640 $101,500 $5,925 $525 $5,200 $2,136 $7,520 $1,031 $1,680 $2,017 $51,600 $1,760 $1,577 $3,300 5.00 12.50 10.00 6.67 10.00 6.67 6.67 6.67 10.00 $234,699 Vehicles 18 Motor bike 19 Range Rover 20 Truck 21 Utility Purchase Truck $1,400 $55,500 $72,500 $24,800 $55,000 2016 2017 2013 2017 Aug 8 10 10 8 12.50 10.00 10.00 12.50 12.50 $175 $5,550 $7,250 $3,100 $6,875 Sub total $875 $44,400 $29,000 $18,600 $24,800 $92,875 9 of 12 Case Study 3 - Conolo, Sheep and Cattle ITEM SALES ITEM No. INITIAL YEAR APPROX NEW PURCH LIFE COST (YRS) DEPR RATE % ANNUAL DEPRN $ VALUE 1 JAN DEPRN (CURR. YR.) VALUE 31 DEC Structures 22 Hay shed 23 Machinery shed 24 Cattle yards 25 Shearing shed 26 Stables & yards 27 Homestead $32,500 $42,600 $31,200 $98,500 $126,800 $185,000 2003 2005 2016 1997 2015 2017 30 30 40 40 30 50 3.33 3.33 2.50 2.50 3.33 2.00 $1,083 $1,420 $780 $2,463 $4,227 $3.700 Sub total $15,167 $22,720 $28,860 $44,325 $109,893 $177,600 $398,565 Fixed Improvements Purchase Mach. Shed Roof Purchase Water Bores (2) $15,500 $12,190 $27,690 End of Jan May 30 15 3.33 6.67 $517 $813 Feed Mixall Truck Total $726,139 $30,000 BOOK VALUE OF SALE Book Val 1 Jan - Depreciation Total RECONCILIATION Value 1 Jan add Purchases add Revaluations Feed Mixall Truck PROFIT/LOSS ON SALE Sale Proceeds Book Value of Sale Value Total less B.V. Sales less Depreciation Value 31 Dec REVALUATIONS Tractor 1 Silos Total 9 of 11 Case Study 3 - Conolo, Sheep and Cattie CASH FLOW STATEMENT FOR THE YEAR 1-Jan-20 Sunrise 31-Dec-20 Check if cells need editing or for statement of position Formula cells to JAN FEB MAR APR MAY JUN JUL AUG SEP OCT NOV DEC TOTAL RECEIPTS CROP SALES Canola LIVESTOCK SALES Cattle Sheep 2,740 1,200 15,411 29,334 26,714 24,665 45,486 73,350 220,295 12,000 1,600 48,495 86,000 WOOL SALES 66.765 66,765 ACCOUNTS RECEIVABLE 6,680 Western Wool Buyers Escort Grains (Canola) 769,160 6,680 769,160 38 663 413 413 OTHER RECEIPTS |-interest -machinery -fixed deposit 5,200 24.800 1,525 30,000 200,000 200,000 77,1901,868 680 4,850 2,600 1,541 5,605 13,692 8,600 116,625 GST COMPONENT GST REFUND TOTAL RECEIPTS 849,090 20,586 7.480 254,007 28.600 17,365 61.653 150,608 95,013 1,484,400 11 of 11 Case Study 3 - Conolo, Sheep and Cattle JAN FEB MAR APR MAY JUN JUL AUG SEP OCT NOV DEC TOTAL 30,000 32,500 40,000 75,000 13,545 14.560 62,275 1,560 64,134 689 317,454 16,809 3,050 1,005 358 230 117 840 2.795 12,800 326 10.756 528 1,430 450 1.969 8,627 29,925 142 210 1,547 PAYMENTS CROPS & PASTURE Canola Pasture LIVESTOCK Cattle Sheep OTHER OPERATING COSTS Fuel & Oil Repairs & Maint Plant & Machinery Structures Permanent labour Rent & Rates Rego & Insurance Tele, Post, Travel Accountant Bank Charges Interest - loan Interest - overdraft TOTAL OP. CASH COSTS 215 166 245 230 10,000 196 12,234 452 350 10,000 182 9,780 750 154 3,345 985 124 1,022 354 720 10,000 490 85 201 550 10,000 165 124 230 152 344 150 240 10,000 124 256 85 320 10,000 125 2,336 540 345 5,790 210 385 788 189 110 10,000 10,000 10,000 10.000 10.000 450 10.000 2,650 720 65 2,657 36,270 4,391 2,520 120,000 3,100 2,830 794 1,550 170 24,645 890 45 1.220 62 35 75 45 72 52 80 38 195 30 1,550 8 12 15 10 17 10 18 13 25 6.862 16 6,378 9 5,920 17 5,486 41,491 24.279 74,734 78,516 49,358 18,002 11,038 12,836 92,698 14.604 59,598 94,589 571,742 JAN FEB MAR APR MAY JUN JUL AUG SEP OCT NOV DEC TOTAL 10,500 24.310 25,560 55,000 15,500 12,190 34,810 80,560 27,690 500,000 103.980 11,865 500,000 27,261 26,399 25,564 24,756 CAPITAL COSTS Livestock Purchases Plant, Machinery & Vehicles Fixed Improvements Investments Loan Repayments Accounts Payable PERSONAL COSTS Drawings GST GST Component of Acquisitions GST Paid TOTAL PAYMENTS SURPLUS/DEFICIT 11,865 4,153 4,058 3,985 4,150 4,054 3.940 3,850 4,103 4.120 3.990 3,420 3,850 47,673 5,154 161 57 5,783 7,677 459 4,958 7,909 5,884 1,426 6,570 11,838 12,730 91,623 529.763 123,050 144,374 757,467 -529,763 -102,464 -136,894 70,756 -70,756 48,502 205,505 14,945 -14,945 77,722 130,059 -49,122 -112,695 57,875 12,730 1,448,925 35,475 19,053 42,600 67,976 82,631 131,104 -36,091 11 of 11 Case Study 3 - Conolo, Sheep and Cattle BALANCE IN BANK Opening Balance 11,000 768,467 238,704 136,240 -653 -71,409 134.096 119,151 70,030 -42,665 -65 82,566 46,475 GST RECONCILIATION 1ST QUARTER Received Less Paid Payable/-Refundable 2ND QUARTER Received Less Paid Payable/-Refundable 3RD QUARTER Received Less Paid Payable/-Refundable 4TH QUARTER Received Less Paid Payable/-Refundable NB - The GST Component in the receipts section represents 10% of the amounts received (except for interest, fixed deposit, and GST Refunds) during that month. - The GST Component in the payments section represents 10% of the amounts paid (except for permanent labour, bank charges, interest, capital repayments and personal payment, and GST paid) during that month. - The $12730 paid in January was the GST owing to the Australian Taxation Office applicable to the last quarter of the previous year. - The GST for the final quarter of the current year will be refunded from the Taxation Office in the first month of the next year. As this is an amount refunded to the business at the end of the current year it will represent an asset at the end of the year. 11 of 12 Case Study 3 - Conolo, Sheep and Cattie Statement of Position (Balance Sheet) For: 'Sunrise' (Case Number - 3) As At Date $ Assets Current Assets Bank Accounts recievable: Total Current Assets Non-Current Assets Total Non-Current Assets Total Assets Liabilities Current Liabilities Total Current Liabilities Non-Current Liabilities Total Non-Current Liabilities Total Liabilities A-L Equity Owners Equity % Equity Change in Equity Cashflow Statement For: 'Sunrise' (Case Number - 3) For the Year: 1/1/Year to 31/12/Year Total $ GST Receipts Crop Sales Livestock Sales Accounts Receivable Other Receipts GST Rec'd on Supplies GST Refund Total Receipts Payments Crops & Pasture Livestock Operating Costs Total Operating Payments Capital Personal GST GST Pald on Acquisitions GST Payments Total Payments R-P Cash Surplus (-Deficit) Bank Summary Opening Balance R Total Receipts P Total Payments Closing Balance Bank Interest Rec'd %.pa Bank Interest Paid %Pa GST Reconciliation 1st Quarter GST Received Less GST Paid Payable-Refund) 2nd Quarter GST Received Less GST Paid Payable-Refund) 3rd Quarter GST Received Less GST Paid Payable(-Refund) 4th Quarter GST Received Less GST Paid Payable(- Refund) 1 1 1 1 Total Receipts Total Payments 0 Clasing Balance 0 0 1 2 3 4 5 7 9 11 12 Assessment Case Study 3 'Sunrise Hawkes Family This case study will form the basis for assessments 1 and 3 for this subject Please note all the information provided is relevant to the assessments. Review content shaded light green for assessment 1. Use the template "Finance Template no formula Ass 1 & 3.xlsx" in Interact to complete the assessments Assessment 1 complete sheets "OpenPosition" and "CashMth" - the rest of the sheets are for Assessment 3 1. Background Information Sunrise' is a property of 1250 hectares near Wagga in southern NSW and has been owned by the Hawkes family for many years. The property is operated as a mixed farm with livestock and cropping enterprises. 500 hectares are devoted to canola production. 740 hectares are improved pasture used for cattle and sheep grazing. The remaining 10 hectares are utilised by buildings, roadways and lanes. Property development was undertaken during the 2020 year with this including construction of 2 water bores and a new roof for the machinery shed. It should be noted that all improvements carried out prior to 2020 have been included in the land value for the beginning of the 2020 year. Hawkes has decided that the value of fixed improvements carried out in 2020, as well as in the future, will be identified separately as fixed improvements on the depeciation schedule and the balance sheet. At 1 January, 2020, the land was valued at $6350/ha. The improved seasons and consequent increase in demand for rural property resulted in the value of the land increasing by 1.5% at 31 December, 2020. The labour resource is provided by Hawkes and two permanent employees. Casual or contract labour is also employed for specialist functions. 2. Cash Flow Information A completed cash flow statement for the 2020 year is attached. There are a small number of line items in need of calculation - check cells shaded in green 3. Enterprise Operational Details The operational detail associated with each enterprise is attached. This information when combined with other details provided will facilitate the preparation of various enterprise and whole farm financial statements. 4. Depreciation Schedule and Other Information 2 of 22 Case Study 3 - Canola, Sheep and Cattle Other Relevant Information for Sunrise A. Land Area and Value The property comprises 1.250 Ha Al 1 January, the land value Hawas: $6,350 per Ha Al 31 December land values had changed by 1.5 % and it should be noted that the land asset had not previously been revalued. B. Bank Balance The bank balance at the 1 January can be identified from the cash flow statement. C. Accounts Receivable (Debtors) Accounts receivable at the 1 January, were as follows: - Westem Wool Buyers S6,680 being monies owing for the previous year's wool clip. - Escort Grains (Canola) S769,160 being monies owing for the previous year's canola crop D. Fixed term Investment A fixed term investment is held with the National Australia Bank. The term of this investment has 4 years remaining. The value of this investment at 1 January, the annual interest rate (paid quarterly), and the additions or withdrawals to the investment during the year, were as follows: - Balance 1 January $30,000 - Annual interest rate (%) 0.50 (NB: interest is paid into the business's bank account and is not added to the investment.) - Addition to the term deposit $500,000 - Withdrawal to the term deposit $200,000 E. Revaluation of Depreciable Assets The following assets on the depreciation schedule were revalued at the end of December, after taking acount of depreciation for the year. None of these items had previously been revalued: - Tractor 1 $15,000 Decrement - Silos S7,500 Increment F. Property Development Loan & Overdraft The business had a property development loan which was acquired to purchase land. Principal repayments and interest payments are made quarterly with 7 years remaining of the loan. The principal outstanding at the 1 January was 5865,000 This is a 20 year loan, Loan interest rate is 3 25% pa If the bank is overdrawn (negative) at the end of the month, the next month overdraft interest is paid: Overdraft interest rale % per year) 8.00 G. Sales and Purchases of Depreciable Assets Sales and purchases of depreciable assets can be identified through examination of the depreciation schedule and the cash flow statement. It should be noted that all sales and purchases occurred at the END of the relevant month H. Accounts Payable (Creditors) Arnounts owing by the business at 1 January were as follows: - Orange Rural $11.865 This amount was comprised of: fertiliser pasture chemicals NB: These items were not used in the previous year thus were on hand at the commencement of the year. $7,365 $4,500 Amounts owing by the business at 31 December were as follows: - Orange Rural $3.525 This amount was comprised of: Insecticides $1,025 herbicides $1,350 fertiliser $1,150 NB: These items were not used during the current year thus are on hand at the end of the year IGST GST was owing to the Australia Tax Office at 1 January. This was the GST payable as a result of the transactions within the last quarter of the previous year. The value owing to the Australian Tax Office at the beginning of the year was: $12,730 The GST owing/refundable at the end of the year, resulting from transactions within the last quarter of the year, can be determined through reference to the detail at the bottom of the cash flow statement J. Livestock DSE Ratings The DSE ratings for the livestock run on Sunrise are as follows Cows 15 Bulls 12 Heifer Yearlings 10 Steer Yearlings 10 Ewes Rams Hogget 2.5 1.5 1.5 do1: Co Study 3 Col, Strand Lark Cattle The number and value of cattle on hand at the commencment of the year were: Cows 110 @ $850 /cow Bulls 5 @ $3.500 /bull Heifer Yearlings 56 @ $650 /heifer Steer Yearlings 50 @ $950 /steer Calves 0 90 % based on the number of cows on hand The calving (birth) percentage achieved was at the beginning of the year. Sales during the year were as follows: Cows (c.f.a.) 8 @ Bulls (c.f.a.) 1 @ Heifer Yearlings 43 @ Steer Yearlings 45 @ S685 Icow $1,200 /bull $640 /heifer $870 /steer During the year the following deaths and losses occurred: Cows 3 Bulls 1 Heifer Yearlings 2 Steer Yearlings 3 Heifer Calves 2 Steer Calves 3 Animals slaughtered for rations during the year were: Steer Yearlings 2 @ $870 /steer Purchases during the year were: Bulls 2 @ $10.500 cost in total This purchase was to replace the cast for age bull sold plus any bull deaths. Transfers for the year were as follows: 11 heifer yearlings on hand at the beginning of the year were transferred into the cows to replace cow deaths and culls. 47 heifer calves were transferred into the heifer yearlings immediately prior to the end of the year. 47 steer calves were transferred into the steer yearlings immediately prior to the end of the year. All transfers can be valued at $700 / head Stock on hand at the end of the year can be valued as follows: Cows $860 Icow Bulls $3.700 /bull Heifer Yearlings $650 /heifer Steer Yearlings $950 /steer $250 $970 Cash costs incurred by the enterprise during the year were as follows: Vaccine $111 Bull Fertility testing Drench $553 Freight Vet $332 Preg testing $358 Tags $485 Fodder - oats - lucerne tonnes total value 22 $2,520 13 $3,050 Pasture Costs - please refer to the pasture information provided 5 of 11 Case Study 3. Canola, Sheep and Cattle Sheep The number and value of sheep on hand at the commencment of the year were: Ewes 1250 @ $240 lewe Rams 38 @ $700 /ram Hoggets 193 @ $210 /hogget Lambs 0 The lambing (birth) percentage achieved was at the beginning of the year. 100 % based on the number of ewes on hand % Sales during the year were as follows: Ewes (c.f.a.) 100 Rams (cf.a.) 8 Hoggets 183 Lambs - wether 380 - ewe 400 @ @ @ @ @ $120 lewe $200 /ram $265 /hogget S190 llamb $215 /lamb During the year the following deaths and losses occurred: Ewes 31 Rams 3 Hoggets 10 Lambs 38 Wool sales: $74,183 The remaining $66,765 was received in 2019. $7,418 will be received early in 2020. Animals slaughtered for rations during the year were: Lambs 11 $190 /lamb Purchases during the year were: Ewes 131 @ $110 lewe Rams 11 @ $900 /ram These purchases were to replace deaths and cast for age stock. Any lambs not sold or otherwise used during the year were transferred into the hoggets. All transfers can be valued at $100 / head Stock on hand at the end of the year can be valued as follows: Ewes $240 lewe Rams $710 /ram Hoggets $200 /hogget Cash costs incurred by the enterprise during the year were as follows: Vaccine $666 Freight - livestock Drench $1.777 Freight - wool Jet/Dip $1,111 Wool packs Shearing $8,590 Crutching $1,288 Fodder - oats $2,463 $666 $563 value $12,800 tonnes 80 Accounts receivable $6,680 - final payment from Westem Wool Buyers for 2018 wool clip Pasture Costs - please refer to the pasture information provided 6 of 11 Case Study 3 - Canola, Sheep and Cattle Canola (C2) 500 ha Grain on hand at the beginning of the year: none Grain purchased: 1500 kg valued at $5.60 /kg Crop use: Sowing 3 kg/ha at $5.60 /kg Production: 2.65 tonne/ha which is sold for S645 / tonne (net) to Escort Grains. Receipt of this money is expected in February 2020 Fertiliser: MAP Extra Sul 100 kg/ha at 190 kg/ha at $650 tonne $550 tonne Chemicals: broadleaf and grass control Trifluralin Glyphosphate 450 Lemat Decis forte EC 2.0 Lt/ha at 1.3 Lt/ha at 0.1 Lt/ha at 0.5 Lt/ha at $6.85 /Litre $10.30 /Litre $32.50 /Litre $19.80 Litre mite control - heliothis control Contract labour: Contract harvesting at Windrowing at Heliothis spraying at $150 /ha $80 /ha $50 /ha Fuel and oil: $40 /ha Repairs and maintenance: $20 /ha Insurance: : $34,185 Accounts receivable: $769,160 was received from Escort Grains being monies owing from the previous year's crops. 7 of 11 Case Study 3. Canola, Sheep and Cattle Pasture Pasture renovation was conducted during the year. This renovation involved the following expenditure. PLEASE NOTE THESE COSTS ARE TO BE PROPORTIONATELY ALLOCATED TO THE LIVESTOCK ENTERPRISES ON THE BASIS OF THE PROPORTION OF THE TOTAL GRAZED AREA UTILISED BY EACH ENTERPRISE. Seed: $1,560 Chemical: Tifluralin Chemicals $689 $4,500 $5,189 95 Litres purchased in 2019 Fertiliser: $455 /tonne Superphosphate Superphosphate $14,560 $7,365 $21.925 32 tonne purchased in 2019. $28,674 8 of 11 Case Study 3 Canola, Sheep and Cattle MANAGEMENT DEPRECIATION SCHEDULE Sunrise FOR THE YEAR 1-Jan-20 to 31-Dec-20 Formula cells or links ITEM No. ITEM SALES INITIAL YEAR APPROX NEW PURCH LIFE COST (YRS) DEPR RATE % ANNUAL DEPRN VALUE 1 JAN DEPRN (CURR. YR.) VALUE 31 DEC 6.67 5.00 10.00 6.67 10.00 5.00 5.00 6.67 $5,200 Plant & Machinery 1 Chisel plough 2 Disc harrows 3 Combine 4 Disc plough 5 Tractor 1 6 Feed mixall 7 Harrows 8 Spray unit 9 Auger 10 Silos 11 Cattle scales 12 Slasher 13 Grain bins 14 Tractor 2 15 Fert spreader 16 Tandem trailer 17 Misc equipment Purchase Feed Mixall $5,200 $2,860 $44.800 $8,300 $145,000 $7,900 $750 $6,000 $3,560 $9,400 $1,650 $2,400 $2,750 $64,500 $2,400 $2,150 $5,500 $25,560 2016 2015 2017 2016 2016 2014 2013 2017 2013 2015 2016 2016 2015 2017 2015 2015 2013 April 15 20 10 15 10 20 20 15 15 20 8 10 15 10 15 15 15 10 6.67 $347 $143 $4,480 $553 $14,500 $395 $38 $400 $237 $470 $206 $240 $183 $6,450 $160 $143 $367 2556 Sub total $4,160 $2,288 $35,840 $6,640 $101,500 $5,925 $525 $5,200 $2,136 $7,520 $1,031 $1,680 $2,017 $51,600 $1,760 $1,577 $3,300 5.00 12.50 10.00 6.67 10.00 6.67 6.67 6.67 10.00 $234,699 Vehicles 18 Motor bike 19 Range Rover 20 Truck 21 Utility Purchase Truck $1,400 $55,500 $72,500 $24,800 $55,000 2016 2017 2013 2017 Aug 8 10 10 8 12.50 10.00 10.00 12.50 12.50 $175 $5,550 $7,250 $3,100 $6,875 Sub total $875 $44,400 $29,000 $18,600 $24,800 $92,875 9 of 12 Case Study 3 - Conolo, Sheep and Cattle ITEM SALES ITEM No. INITIAL YEAR APPROX NEW PURCH LIFE COST (YRS) DEPR RATE % ANNUAL DEPRN $ VALUE 1 JAN DEPRN (CURR. YR.) VALUE 31 DEC Structures 22 Hay shed 23 Machinery shed 24 Cattle yards 25 Shearing shed 26 Stables & yards 27 Homestead $32,500 $42,600 $31,200 $98,500 $126,800 $185,000 2003 2005 2016 1997 2015 2017 30 30 40 40 30 50 3.33 3.33 2.50 2.50 3.33 2.00 $1,083 $1,420 $780 $2,463 $4,227 $3.700 Sub total $15,167 $22,720 $28,860 $44,325 $109,893 $177,600 $398,565 Fixed Improvements Purchase Mach. Shed Roof Purchase Water Bores (2) $15,500 $12,190 $27,690 End of Jan May 30 15 3.33 6.67 $517 $813 Feed Mixall Truck Total $726,139 $30,000 BOOK VALUE OF SALE Book Val 1 Jan - Depreciation Total RECONCILIATION Value 1 Jan add Purchases add Revaluations Feed Mixall Truck PROFIT/LOSS ON SALE Sale Proceeds Book Value of Sale Value Total less B.V. Sales less Depreciation Value 31 Dec REVALUATIONS Tractor 1 Silos Total 9 of 11 Case Study 3 - Conolo, Sheep and Cattie CASH FLOW STATEMENT FOR THE YEAR 1-Jan-20 Sunrise 31-Dec-20 Check if cells need editing or for statement of position Formula cells to JAN FEB MAR APR MAY JUN JUL AUG SEP OCT NOV DEC TOTAL RECEIPTS CROP SALES Canola LIVESTOCK SALES Cattle Sheep 2,740 1,200 15,411 29,334 26,714 24,665 45,486 73,350 220,295 12,000 1,600 48,495 86,000 WOOL SALES 66.765 66,765 ACCOUNTS RECEIVABLE 6,680 Western Wool Buyers Escort Grains (Canola) 769,160 6,680 769,160 38 663 413 413 OTHER RECEIPTS |-interest -machinery -fixed deposit 5,200 24.800 1,525 30,000 200,000 200,000 77,1901,868 680 4,850 2,600 1,541 5,605 13,692 8,600 116,625 GST COMPONENT GST REFUND TOTAL RECEIPTS 849,090 20,586 7.480 254,007 28.600 17,365 61.653 150,608 95,013 1,484,400 11 of 11 Case Study 3 - Conolo, Sheep and Cattle JAN FEB MAR APR MAY JUN JUL AUG SEP OCT NOV DEC TOTAL 30,000 32,500 40,000 75,000 13,545 14.560 62,275 1,560 64,134 689 317,454 16,809 3,050 1,005 358 230 117 840 2.795 12,800 326 10.756 528 1,430 450 1.969 8,627 29,925 142 210 1,547 PAYMENTS CROPS & PASTURE Canola Pasture LIVESTOCK Cattle Sheep OTHER OPERATING COSTS Fuel & Oil Repairs & Maint Plant & Machinery Structures Permanent labour Rent & Rates Rego & Insurance Tele, Post, Travel Accountant Bank Charges Interest - loan Interest - overdraft TOTAL OP. CASH COSTS 215 166 245 230 10,000 196 12,234 452 350 10,000 182 9,780 750 154 3,345 985 124 1,022 354 720 10,000 490 85 201 550 10,000 165 124 230 152 344 150 240 10,000 124 256 85 320 10,000 125 2,336 540 345 5,790 210 385 788 189 110 10,000 10,000 10,000 10.000 10.000 450 10.000 2,650 720 65 2,657 36,270 4,391 2,520 120,000 3,100 2,830 794 1,550 170 24,645 890 45 1.220 62 35 75 45 72 52 80 38 195 30 1,550 8 12 15 10 17 10 18 13 25 6.862 16 6,378 9 5,920 17 5,486 41,491 24.279 74,734 78,516 49,358 18,002 11,038 12,836 92,698 14.604 59,598 94,589 571,742 JAN FEB MAR APR MAY JUN JUL AUG SEP OCT NOV DEC TOTAL 10,500 24.310 25,560 55,000 15,500 12,190 34,810 80,560 27,690 500,000 103.980 11,865 500,000 27,261 26,399 25,564 24,756 CAPITAL COSTS Livestock Purchases Plant, Machinery & Vehicles Fixed Improvements Investments Loan Repayments Accounts Payable PERSONAL COSTS Drawings GST GST Component of Acquisitions GST Paid TOTAL PAYMENTS SURPLUS/DEFICIT 11,865 4,153 4,058 3,985 4,150 4,054 3.940 3,850 4,103 4.120 3.990 3,420 3,850 47,673 5,154 161 57 5,783 7,677 459 4,958 7,909 5,884 1,426 6,570 11,838 12,730 91,623 529.763 123,050 144,374 757,467 -529,763 -102,464 -136,894 70,756 -70,756 48,502 205,505 14,945 -14,945 77,722 130,059 -49,122 -112,695 57,875 12,730 1,448,925 35,475 19,053 42,600 67,976 82,631 131,104 -36,091 11 of 11 Case Study 3 - Conolo, Sheep and Cattle BALANCE IN BANK Opening Balance 11,000 768,467 238,704 136,240 -653 -71,409 134.096 119,151 70,030 -42,665 -65 82,566 46,475 GST RECONCILIATION 1ST QUARTER Received Less Paid Payable/-Refundable 2ND QUARTER Received Less Paid Payable/-Refundable 3RD QUARTER Received Less Paid Payable/-Refundable 4TH QUARTER Received Less Paid Payable/-Refundable NB - The GST Component in the receipts section represents 10% of the amounts received (except for interest, fixed deposit, and GST Refunds) during that month. - The GST Component in the payments section represents 10% of the amounts paid (except for permanent labour, bank charges, interest, capital repayments and personal payment, and GST paid) during that month. - The $12730 paid in January was the GST owing to the Australian Taxation Office applicable to the last quarter of the previous year. - The GST for the final quarter of the current year will be refunded from the Taxation Office in the first month of the next year. As this is an amount refunded to the business at the end of the current year it will represent an asset at the end of the year. 11 of 12 Case Study 3 - Conolo, Sheep and Cattie Statement of Position (Balance Sheet) For: 'Sunrise' (Case Number - 3) As At Date $ Assets Current Assets Bank Accounts recievable: Total Current Assets Non-Current Assets Total Non-Current Assets Total Assets Liabilities Current Liabilities Total Current Liabilities Non-Current Liabilities Total Non-Current Liabilities Total Liabilities A-L Equity Owners Equity % Equity Change in Equity Cashflow Statement For: 'Sunrise' (Case Number - 3) For the Year: 1/1/Year to 31/12/Year Total $ GST Receipts Crop Sales Livestock Sales Accounts Receivable Other Receipts GST Rec'd on Supplies GST Refund Total Receipts Payments Crops & Pasture Livestock Operating Costs Total Operating Payments Capital Personal GST GST Pald on Acquisitions GST Payments Total Payments R-P Cash Surplus (-Deficit) Bank Summary Opening Balance R Total Receipts P Total Payments Closing Balance Bank Interest Rec'd %.pa Bank Interest Paid %Pa GST Reconciliation 1st Quarter GST Received Less GST Paid Payable-Refund) 2nd Quarter GST Received Less GST Paid Payable-Refund) 3rd Quarter GST Received Less GST Paid Payable(-Refund) 4th Quarter GST Received Less GST Paid Payable(- Refund) 1 1 1 1 Total Receipts Total Payments 0 Clasing Balance 0 0 1 2 3 4 5 7 9 11 12Step by Step Solution
There are 3 Steps involved in it
Step: 1

Get Instant Access to Expert-Tailored Solutions
See step-by-step solutions with expert insights and AI powered tools for academic success
Step: 2

Step: 3

Ace Your Homework with AI
Get the answers you need in no time with our AI-driven, step-by-step assistance
Get Started


