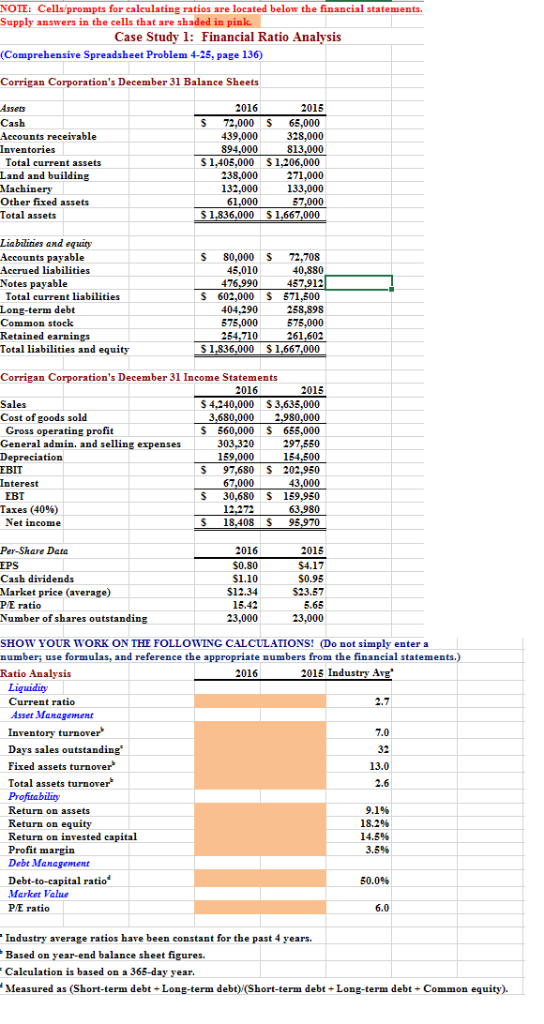
NOTE: Cells/prompts for caleulating ratios are located below the financial statements Supply answers in the cells that are shaded in pink. Case Study 1: Financial Ratio Analysis (Comprehensive Spreadsheet Problem 4-25, page 136) Corrigan Corporation's December 31 Balance Sheets 2015 S 72,000 $ 65,000 39,000328,000 2016 Assers Cash Accounts receivable Inventories 894.000 Total current assets Land and building Machinery Other fixed assets Total assets S 1,405,000 $1,206,000 238,000 271.000 32,000133,000 57 S 1,836,000 S1,667,000 Liabilines and equity ccounts payable Accrued liabilities Notes payable Total current liabilities Long-term debt Common stock Retained earnings Total liabilities and equity S 80,000 72,708 40,880 457912 S 602,000$ 871,500 404,290 258,898 75,000 575,000 45,010 476 264.710 S 1,836,000 S1,667,000 Corrigan Corporation's December 31 Income Statements Sales Cost of goods sold S 4,240,000 S3,635,000 3.680.000 2,980.000 S 560,000$ 655,000 97,550 Gross operating profit Ceneral admin, and selling expenses Depreciation EBIT Interest 303,320 159,000 S 97,680 S 202,950 43.000 S 30,680 S 159,950 67.000 EBT Taxes (40%) 63 Net income S 18.408 S 95,970 Per-Share Data EPS Cash dividends Market price (average) PE ratio Number of shares outstanding 0.80 $4.17 50.95 $23.57 $12.34 15.42 23,000 SHOW YOUR WORK ON THE FOLLOWING CALCULATIONS! Do not simply enter a number, use formulas, and reference the appropriate numbers from the finaneial statements.) Ratio Analysis 2015 Industry Ave Liguidity Current ratio Asset Management Inventory turnover Days sales outstanding Fixed assets turnover Total assets turnorer 13.0 Return on assets Return on equity Return on invested capital Profit margin Debt Management 18.2% 14.5% 3.5% l ratio 50.0% Market Value P/E ratio Industry average ratios have been constant for the past 4 years. Based on year-end balance sheet figures. Caleulation is based on a 365-day year Measured as (Short-term debt Long-term debt) (Short-term debt Long-term debt Common equity)