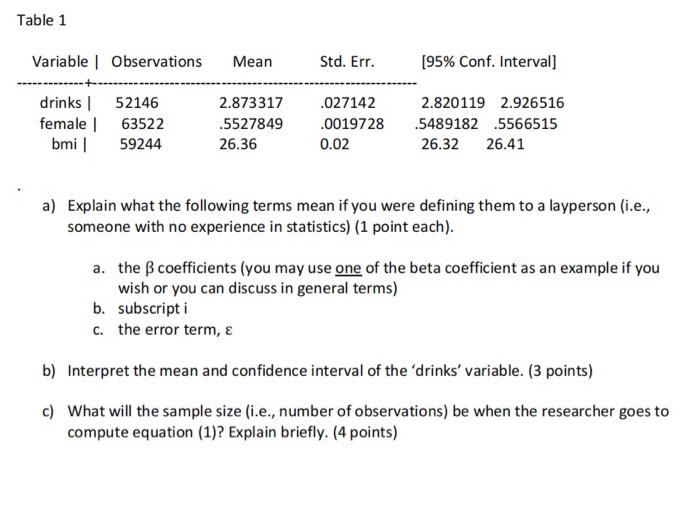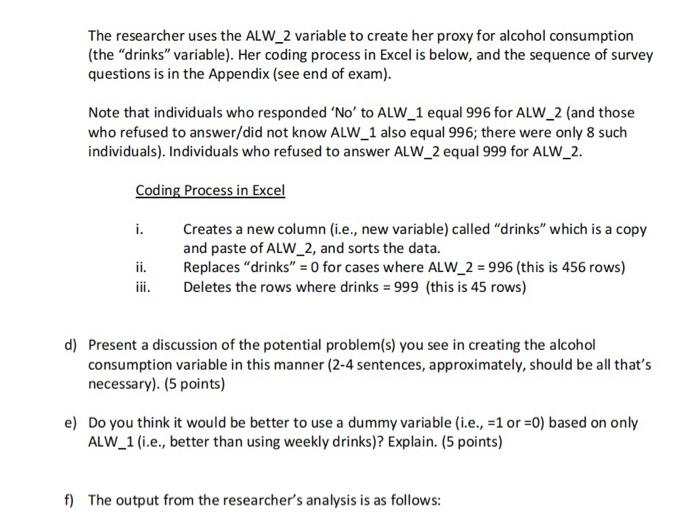
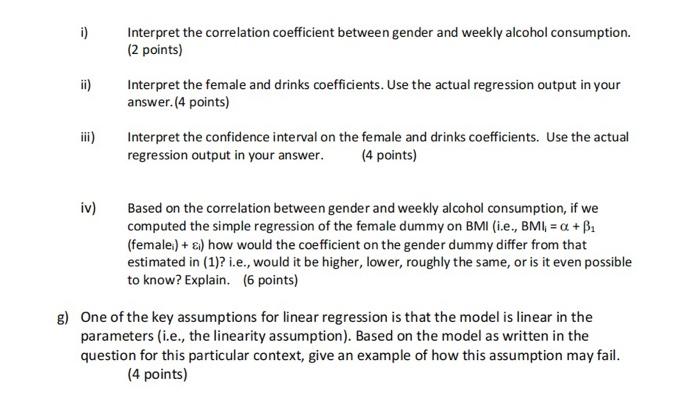
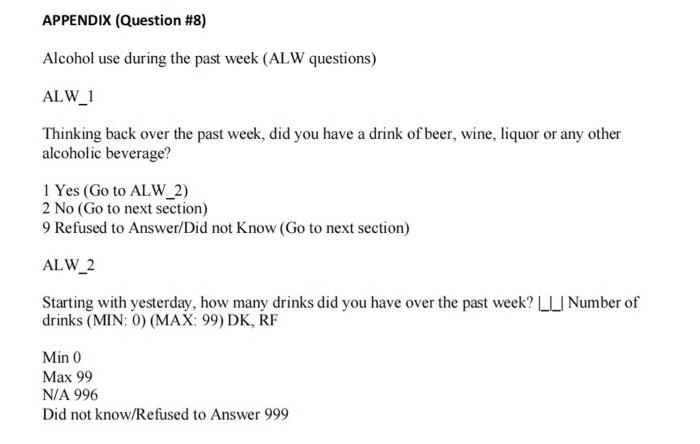
Note: For this question you will need to refer to information in the Appendix; see the end of the exam Recently it was reported in the Globe and Mail that Canadians generally underestimate the calories in alcohol. The article referred to a British study that found a positive correlation between alcohol consumption and Body Mass Index (BMI). The article also discussed a recent poll at the University of Toronto that suggested male students had different views about the health effects of alcohol than female students. A researcher is interested in exploring these issues, and utilizes the 2016 Canadian Community health Survey. The researcher writes down the following regression model: BMI = a + B1(women.) + B2(drinks.) + (1) where: women=1 for women, =0 for men; BMI is the metric body mass index (BMI units); and drinks is # standard drinks consumed during the reference week of the survey. Health Canada recommendations are that individuals are at an elevated risk of health problems with a BMI over 25 or under 18.5, with 18.5 to 24.9 being the recommended range. The descriptive statistics are as follows: Table 1 Variable Observations Mean Std. Err. [95% Conf. Interval) drinks 52146 female 63522 bmi 59244 2.873317 .5527849 26.36 .027142 .0019728 0.02 2.820119 2.926516 .5489182 5566515 26.32 26.41 a) Explain what the following terms mean if you were defining them to a layperson (i.e., someone with no experience in statistics) (1 point each). a. the coefficients (you may use one of the beta coefficient as an example if you wish or you can discuss in general terms) b. subscript i c. the error term, b) Interpret the mean and confidence interval of the 'drinks' variable. (3 points) c) What will the sample size (i.e., number of observations) be when the researcher goes to compute equation (1)? Explain briefly. (4 points) The researcher uses the ALW_2 variable to create her proxy for alcohol consumption (the "drinks variable). Her coding process in Excel is below, and the sequence of survey questions is in the Appendix (see end of exam). Note that individuals who responded 'No' to ALW_1 equal 996 for ALW_2 (and those who refused to answer/did not know ALW_1 also equal 996; there were only 8 such individuals). Individuals who refused to answer ALW_2 equal 999 for ALW_2. Coding Process in Excel i. ii. iii. Creates a new column (i.e., new variable) called "drinks which is a copy and paste of ALW_2, and sorts the data. Replaces "drinks" = 0 for cases where ALW_2 = 996 (this is 456 rows) Deletes the rows where drinks = 999 (this is 45 rows) d) Present a discussion of the potential problem(s) you see in creating the alcohol consumption variable in this manner (2-4 sentences, approximately, should be all that's necessary). (5 points) e) Do you think it would be better to use a dummy variable (i.e., -1 or =0) based on only ALW_1 (i.e., better than using weekly drinks)? Explain. (5 points) f) The output from the researcher's analysis is as follows: i) Interpret the correlation coefficient between gender and weekly alcohol consumption. (2 points) ii) Interpret the female and drinks coefficients. Use the actual regression output in your answer.(4 points) iii) Interpret the confidence interval on the female and drinks coefficients. Use the actual regression output in your answer. (4 points) iv) Based on the correlation between gender and weekly alcohol consumption, if we computed the simple regression of the female dummy on BMI (i.e., BMI = a + B1 (female:) + i) how would the coefficient on the gender dummy differ from that estimated in (1)? i.e., would it be higher, lower, roughly the same, or is it even possible to know? Explain. (6 points) g) One of the key assumptions for linear regression is that the model is linear in the parameters (i.e., the linearity assumption). Based on the model as written in the question for this particular context, give an example of how this assumption may fail. (4 points) APPENDIX (Question #8) Alcohol use during the past week (ALW questions) ALW_1 Thinking back over the past week, did you have a drink of beer, wine, liquor or any other alcoholic beverage? 1 Yes (Go to ALW_2) 2 No (Go to next section) 9 Refused to Answer/Did not know (Go to next section) ALW_2 Starting with yesterday, how many drinks did you have over the past week? LL Number of drinks (MIN: 0) (MAX: 99) DK, RF Min 0 Max 99 N/A 996 Did not know/Refused to Answer 999 Note: For this question you will need to refer to information in the Appendix; see the end of the exam Recently it was reported in the Globe and Mail that Canadians generally underestimate the calories in alcohol. The article referred to a British study that found a positive correlation between alcohol consumption and Body Mass Index (BMI). The article also discussed a recent poll at the University of Toronto that suggested male students had different views about the health effects of alcohol than female students. A researcher is interested in exploring these issues, and utilizes the 2016 Canadian Community health Survey. The researcher writes down the following regression model: BMI = a + B1(women.) + B2(drinks.) + (1) where: women=1 for women, =0 for men; BMI is the metric body mass index (BMI units); and drinks is # standard drinks consumed during the reference week of the survey. Health Canada recommendations are that individuals are at an elevated risk of health problems with a BMI over 25 or under 18.5, with 18.5 to 24.9 being the recommended range. The descriptive statistics are as follows: Table 1 Variable Observations Mean Std. Err. [95% Conf. Interval) drinks 52146 female 63522 bmi 59244 2.873317 .5527849 26.36 .027142 .0019728 0.02 2.820119 2.926516 .5489182 5566515 26.32 26.41 a) Explain what the following terms mean if you were defining them to a layperson (i.e., someone with no experience in statistics) (1 point each). a. the coefficients (you may use one of the beta coefficient as an example if you wish or you can discuss in general terms) b. subscript i c. the error term, b) Interpret the mean and confidence interval of the 'drinks' variable. (3 points) c) What will the sample size (i.e., number of observations) be when the researcher goes to compute equation (1)? Explain briefly. (4 points) The researcher uses the ALW_2 variable to create her proxy for alcohol consumption (the "drinks variable). Her coding process in Excel is below, and the sequence of survey questions is in the Appendix (see end of exam). Note that individuals who responded 'No' to ALW_1 equal 996 for ALW_2 (and those who refused to answer/did not know ALW_1 also equal 996; there were only 8 such individuals). Individuals who refused to answer ALW_2 equal 999 for ALW_2. Coding Process in Excel i. ii. iii. Creates a new column (i.e., new variable) called "drinks which is a copy and paste of ALW_2, and sorts the data. Replaces "drinks" = 0 for cases where ALW_2 = 996 (this is 456 rows) Deletes the rows where drinks = 999 (this is 45 rows) d) Present a discussion of the potential problem(s) you see in creating the alcohol consumption variable in this manner (2-4 sentences, approximately, should be all that's necessary). (5 points) e) Do you think it would be better to use a dummy variable (i.e., -1 or =0) based on only ALW_1 (i.e., better than using weekly drinks)? Explain. (5 points) f) The output from the researcher's analysis is as follows: i) Interpret the correlation coefficient between gender and weekly alcohol consumption. (2 points) ii) Interpret the female and drinks coefficients. Use the actual regression output in your answer.(4 points) iii) Interpret the confidence interval on the female and drinks coefficients. Use the actual regression output in your answer. (4 points) iv) Based on the correlation between gender and weekly alcohol consumption, if we computed the simple regression of the female dummy on BMI (i.e., BMI = a + B1 (female:) + i) how would the coefficient on the gender dummy differ from that estimated in (1)? i.e., would it be higher, lower, roughly the same, or is it even possible to know? Explain. (6 points) g) One of the key assumptions for linear regression is that the model is linear in the parameters (i.e., the linearity assumption). Based on the model as written in the question for this particular context, give an example of how this assumption may fail. (4 points) APPENDIX (Question #8) Alcohol use during the past week (ALW questions) ALW_1 Thinking back over the past week, did you have a drink of beer, wine, liquor or any other alcoholic beverage? 1 Yes (Go to ALW_2) 2 No (Go to next section) 9 Refused to Answer/Did not know (Go to next section) ALW_2 Starting with yesterday, how many drinks did you have over the past week? LL Number of drinks (MIN: 0) (MAX: 99) DK, RF Min 0 Max 99 N/A 996 Did not know/Refused to Answer 999