*Note - ignore the 20 and go with the 65 that are listed in the table In this exercise, you will investigate the relationship between
*Note - ignore the 20 and go with the 65 that are listed in the table
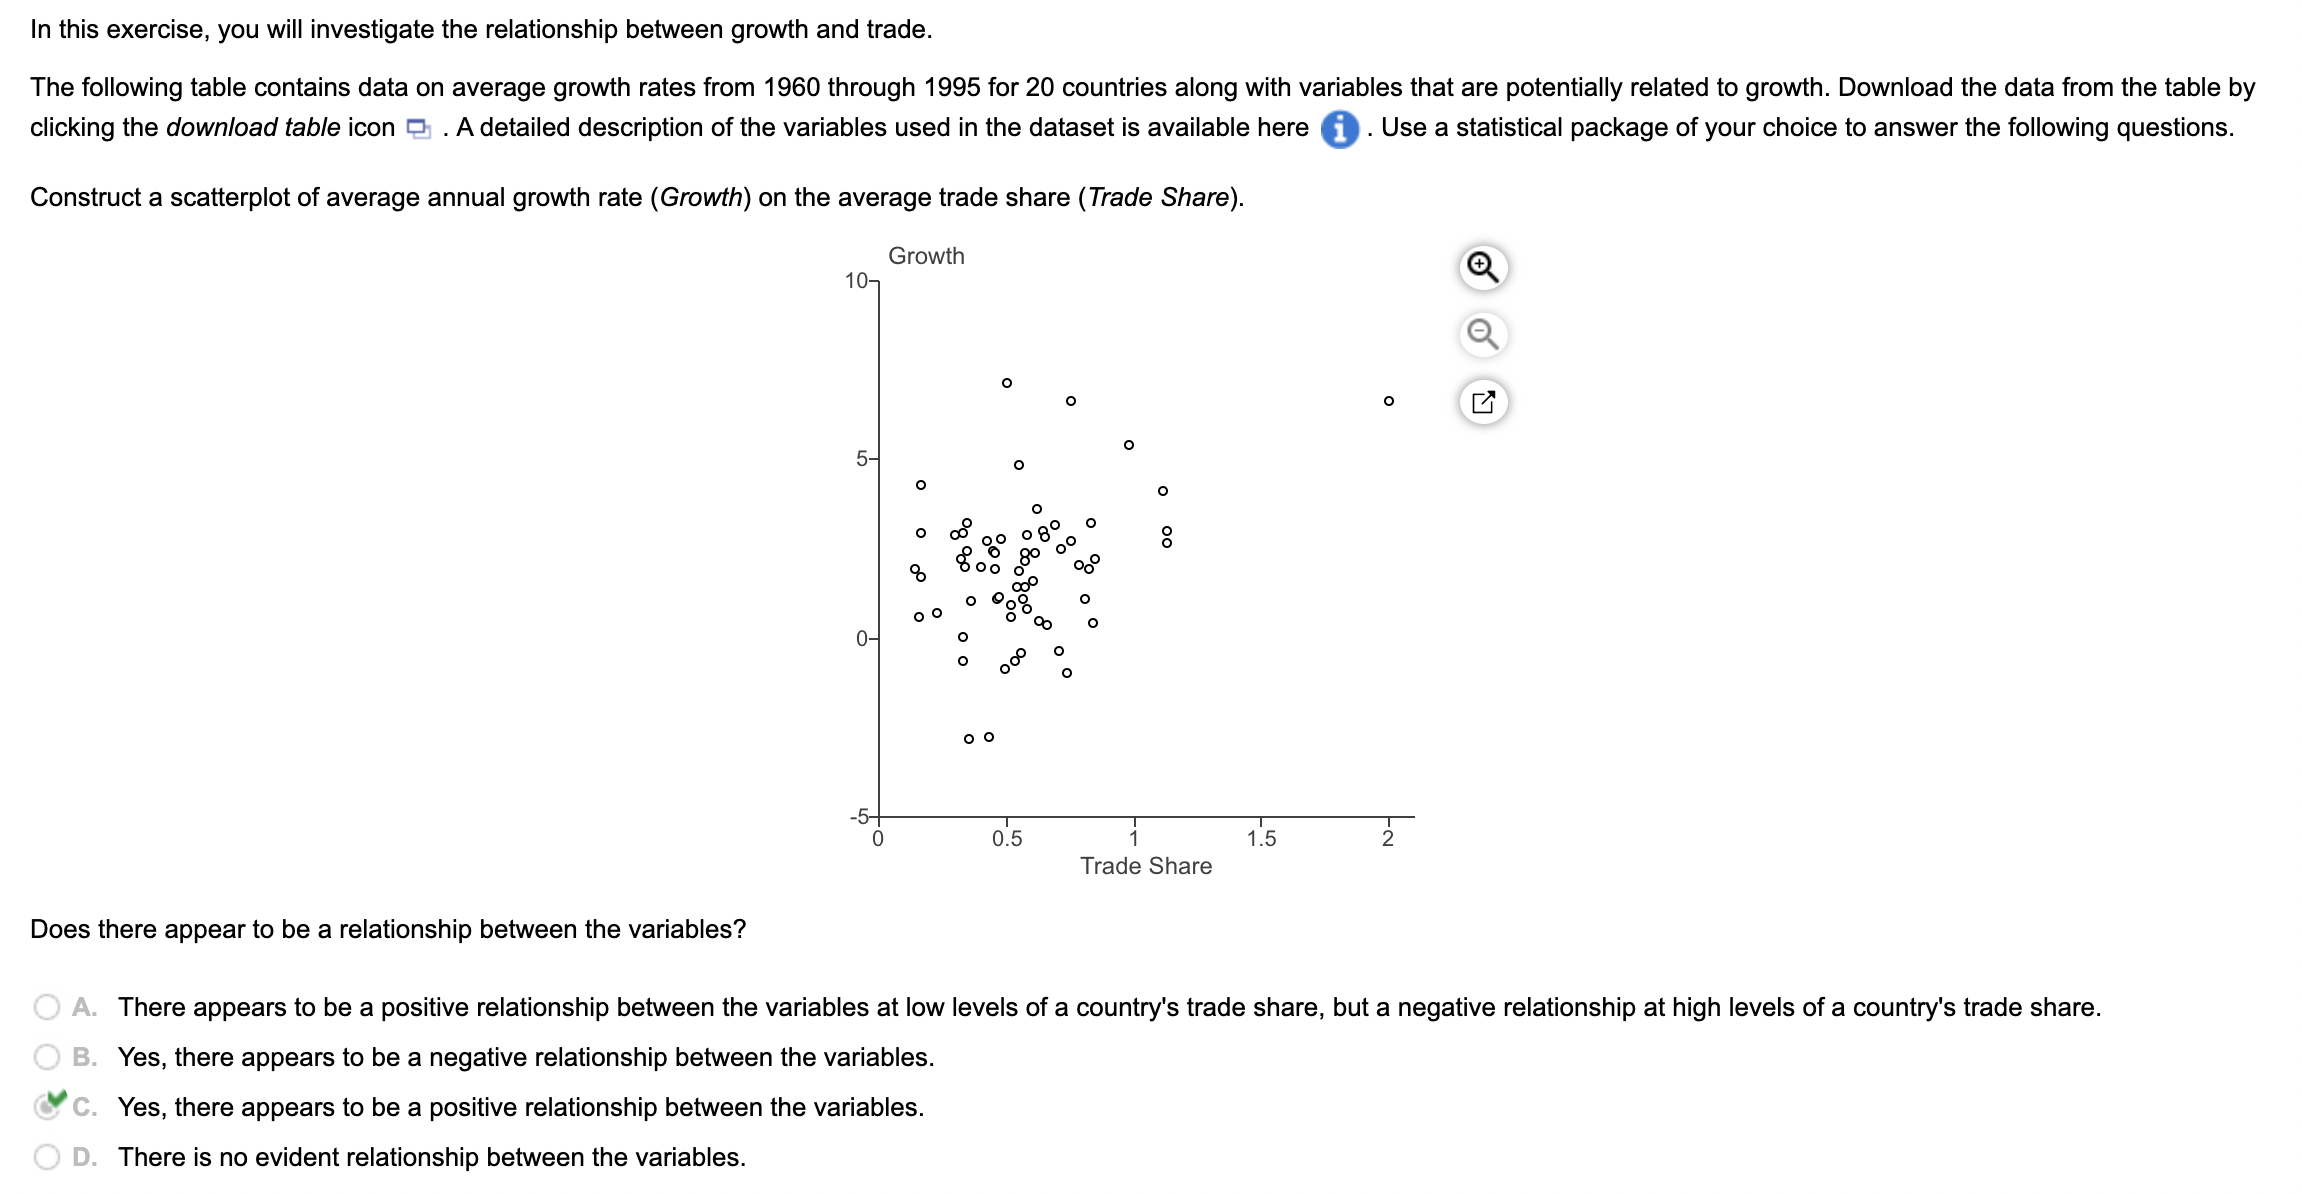
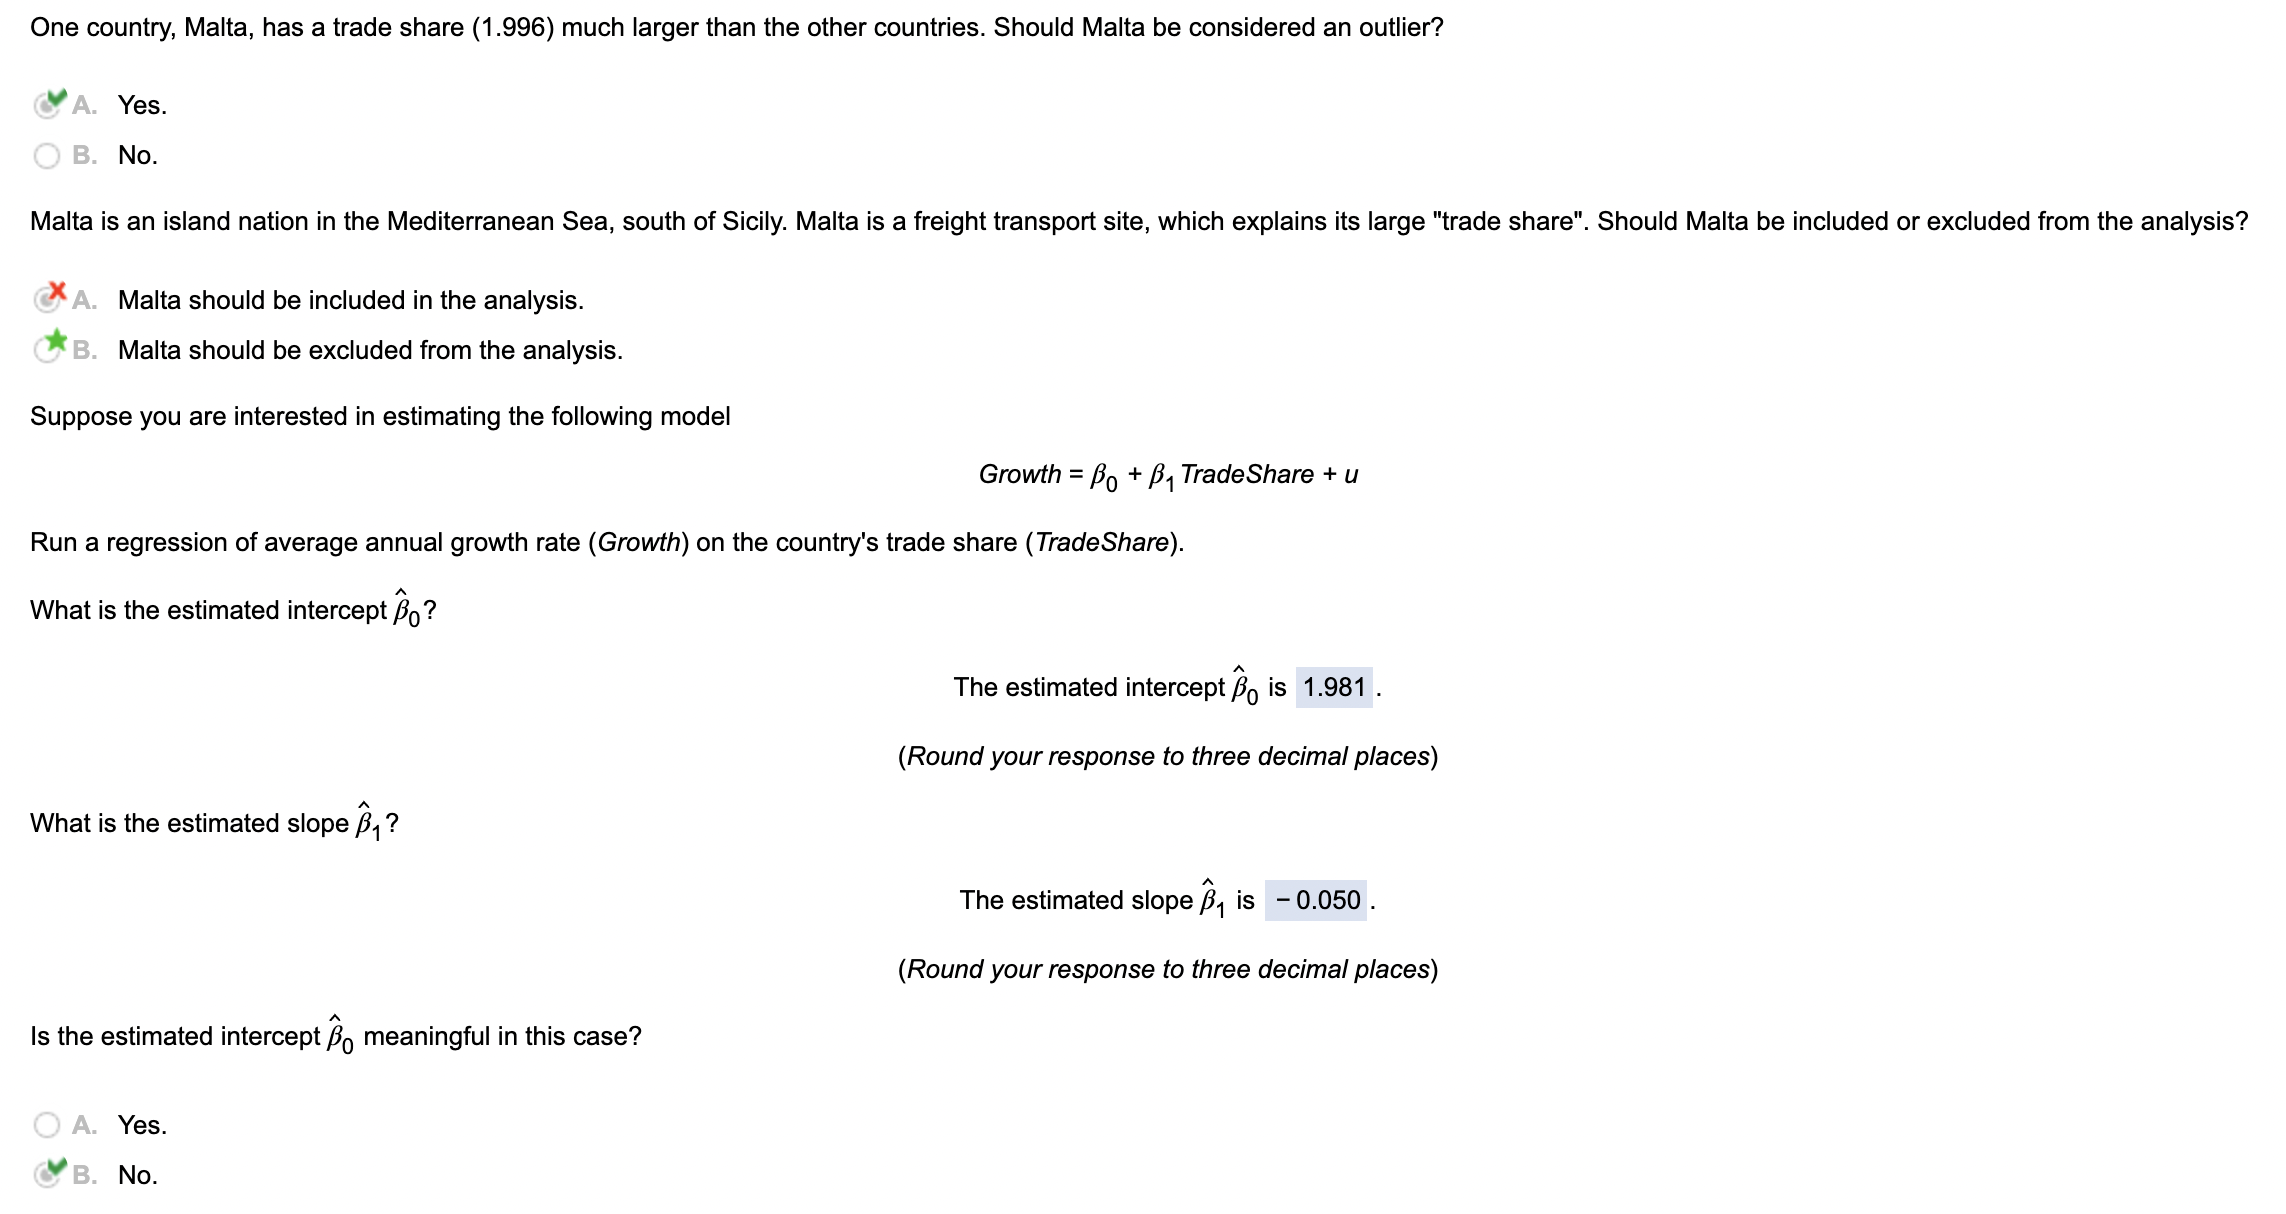
In this exercise, you will investigate the relationship between growth and trade. The following table contains data on average growth rates from 1960 through 1995 for 20 countries along with variables that are potentially related to growth. Download the data from the table by clicking the download table icon CI . A detailed description of the variables used in the dataset is available here 0 . Use a statistical package of your choice to answer the following questions. Construct a scatterplot of average annual growth rate (Growth) on the average trade share (Trade Share). Growth 10 Q Q o o o D} o 5' 0 0 o 02 :8): 00 0 00% 0 Q: o 0 o o 0 00 0 O O *5 I I I I 0 0 5 1 1 5 2 Trade Share Does there appear to be a relationship between the variables? There appears to be a positive relationship between the variables at low levels of a country's trade share, but a negative relationship at high levels of a country's trade share. Yes, there appears to be a negative relationship between the variables. Yes, there appears to be a positive relationship between the variables. There is no evident relationship between the variables. One country, Malta, has a trade share (1.996) much larger than the other countries. Should Malta be considered an outlier? V Yes. No. Malta is an island nation in the Mediterranean Sea, south of Sicily. Malta is a freight transport site, which explains its large "trade share". Should Malta be included or excluded from the analysis? x Malta should be included in the analysis. Malta should be excluded from the analysis. Suppose you are interested in estimating the following model Growth = o + 1 TradeShare + u Run a regression of average annual growth rate (Growth) on the country's trade share (TradeShare). What is the estimated intercept 20? The estimated intercept $0 is 1.981 . (Round your response to three decimal places) What is the estimated slope 1 ? The estimated slope $1 is 0.050 . (Round your response to three decimal places) Is the estimated intercept 0 meaningful in this case? Yes. V No. CountryA has a trade share of 0.3. Predict Country A's average annual growth rate using the estimated regression. Country A's predicted annual growth rate is D%. (Round your response to two decimal places) Variable Definitions Variable Definition Growth Average annual percentage growth of real Gross Domestic Product (GDP) from 1960 to 1995. The average share of trade in the economy from 1960 to 1995, measured as the TradeShare sum of exports plus imports, divided by GDP; that is, the average value of (X + MY/GDP from 1960 to 1995, where X = exports and M = imports (both X and M are positive)
Step by Step Solution
There are 3 Steps involved in it
Step: 1
Get Instant Access to Expert-Tailored Solutions
See step-by-step solutions with expert insights and AI powered tools for academic success
Step: 2
Step: 3
Ace Your Homework with AI
Get the answers you need in no time with our AI-driven, step-by-step assistance