Note: I'm sorry in advance if the picture appears small or blurry. If you right click to save the image to your computer, it will be much larger and clearer. Alternatively, you can use the "zoom" feature in Google Chrome and it will look clearer. Thanks in advance!
Also, the drop-down options for part B are graph 1 and graph 2
the drop-downs for part C are A/B and A/B
the drop-downs for part D are less/more and lower/higher and more/less and higher/lower and A/B
The drop-downs for part E are A/B


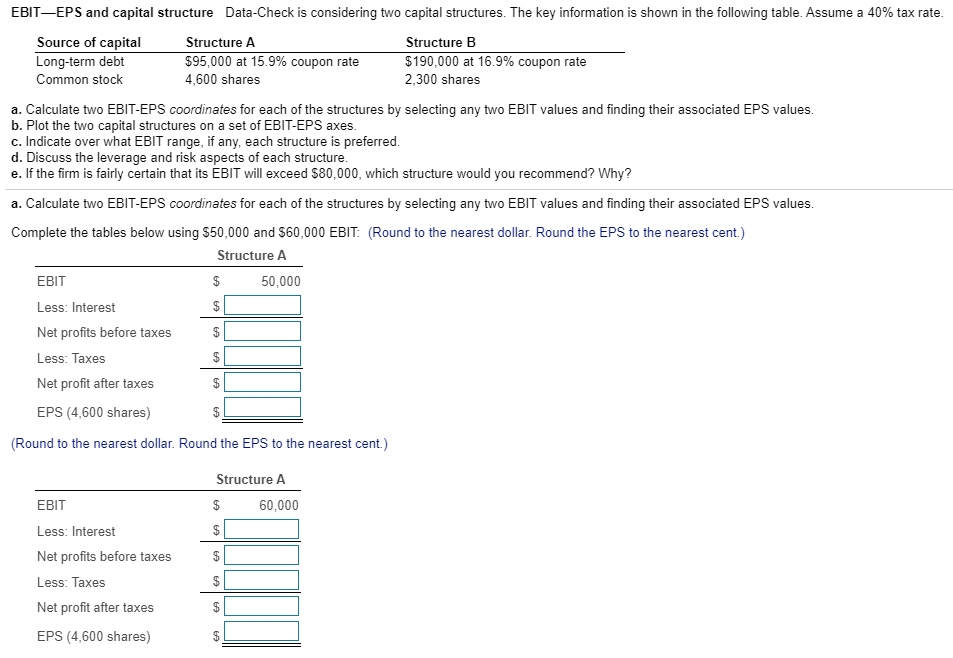
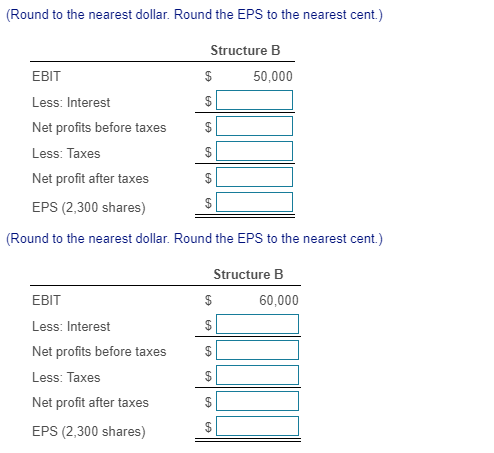
EBITEPS and capital structure Data-Check is considering two capital structures. The key information is shown in the following table. Assume a 40% tax rate. Source of capital Structure A Structure B Long-term debt $95,000 at 15.9% coupon rate $190,000 at 16.9% coupon rate Common stock 4,600 shares 2,300 shares a. Calculate two EBIT-EPS coordinates for each of the structures by selecting any two EBIT values and finding their associated EPS values. b. Plot the two capital structures on a set of EBIT-EPS axes. c. Indicate over what EBIT range, if any, each structure is preferred. d. Discuss the leverage and risk aspects of each structure. e. If the firm is fairly certain that its EBIT will exceed $80,000, which structure would you recommend? Why? a. Calculate two EBIT-EPS coordinates for each of the structures by selecting any two EBIT values and finding their associated EPS values. Complete the tables below using $50,000 and $60,000 EBIT: (Round to the nearest dollar. Round the EPS to the nearest cent) Structure A EBIT $ 50,000 Less: Interest Net profits before taxes Less: Taxes Net profit after taxes EPS (4,600 shares) $ (Round to the nearest dollar. Round the EPS to the nearest cent.) Structure A $ 60,000 EBIT Less: Interest Net profits before taxes Less: Taxes Net profit after taxes EPS (4,600 shares) (Round to the nearest dollar. Round the EPS to the nearest cent.) Structure B $ 50,000 EBIT |. Less: Interest Net profits before taxes Less: Taxes Net profit after taxes EPS (2,300 shares) @ @ | (Round to the nearest dollar. Round the EPS to the nearest cent.) Structure B $ 60,000 EBIT Less: Interest Net profits before taxes Less: Taxes Net profit after taxes EPS (2,300 shares) The financial breakeven point for structure A is $ . (Round to the nearest dollar.) The financial breakeven point for structure B is $ . (Round to the nearest dollar.) b. Which graph below correctly depicts the EBIT vs. EPS relation? The correct graph is (Select from the drop-down menu.) Graph 1 Graph 2 Comparison of Financial Structures o o Comparison of Financial Structures Structure A Structure B Structure A Structure B O OG EPS ($) EPS ($) 49,077 50.000 60.000 49,077 50,000 60,000 10,000 20,000 30.000 40.000 EBIT (S) 10,000 20,000 30.000 40.000 EBIT (S) c. Indicate over what EBIT range, if any, each structure is preferred. (Select from the drop-down menus.) If EBIT is expected to be below $49,077, Structure is preferred. If EBIT is expected to be above $49,077, Structure is preferred. d. Discuss the leverage and risk aspects of each structure. (Select from the drop-down menus.) also indicates greater financial leverage. Structure A has v risk and promises returns as EBIT increases. Bis risky since it has a financial breakeven point. The steeper slope of the line for Structure e. If the firm is fairly certain that its EBIT will exceed $80,000, which structure would you recommend? Why? (Select from the drop-down menu.) If EBIT is greater than $80,000, Structure is recommended since changes in EPS are much greater for given values of EBIT


