

Answered step by step
Verified Expert Solution
Question
1 Approved Answer
Note: Percents given in Figure 1 are compared for all chromatograms. These numbers represent the area of the peaks compared to the peaks in rxn
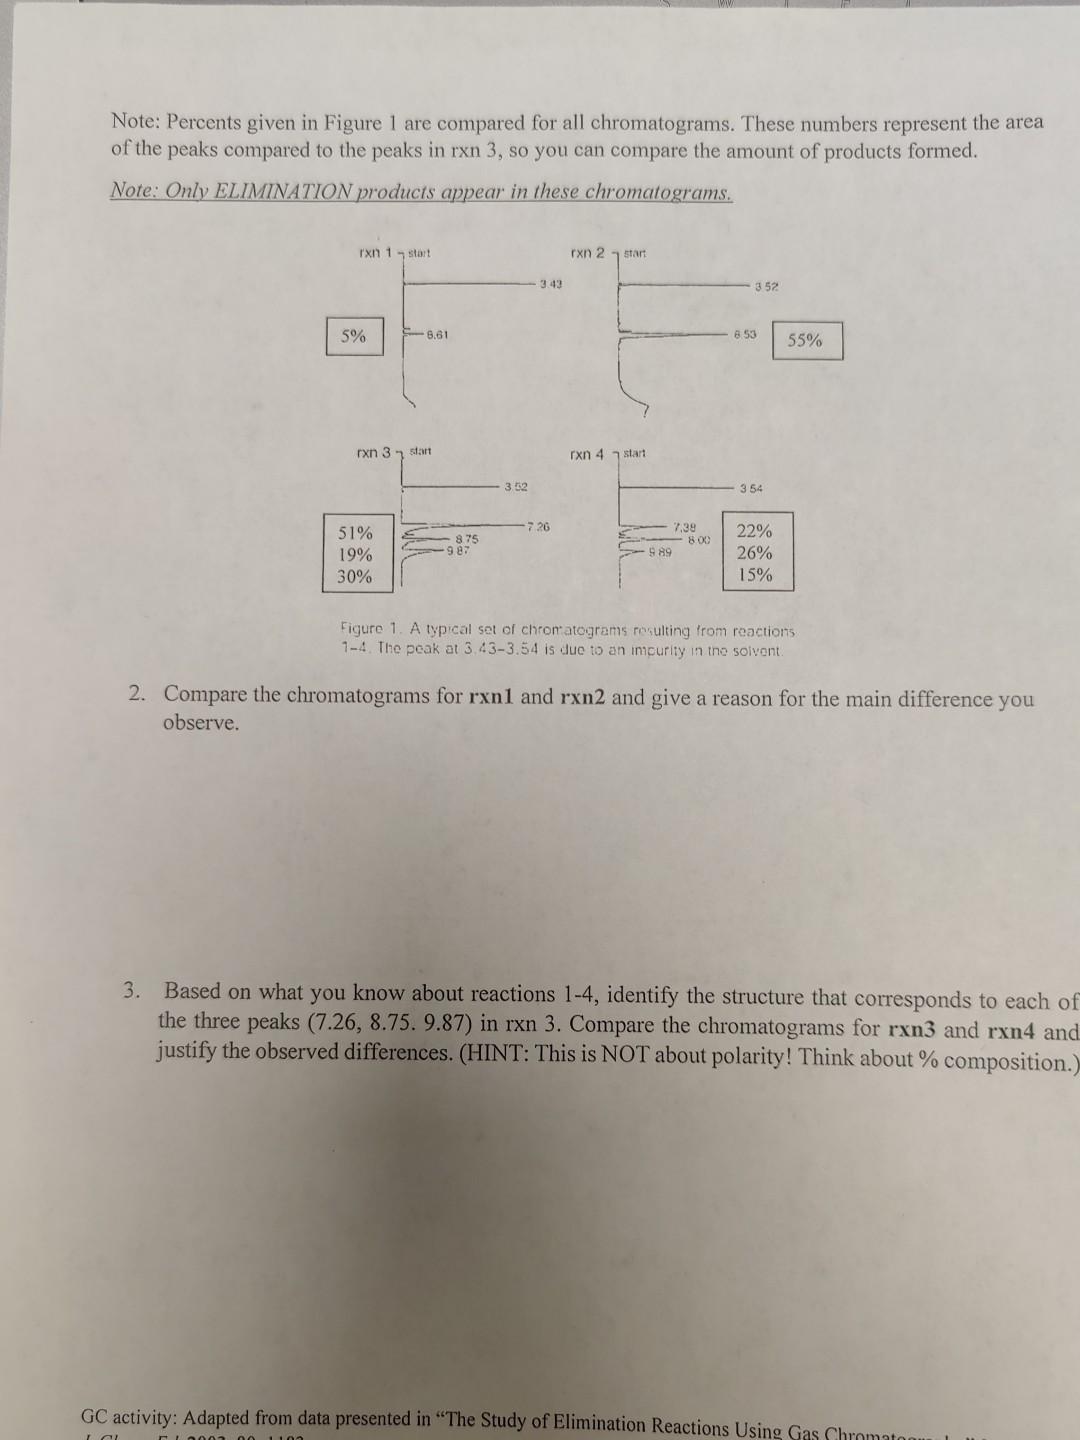
Note: Percents given in Figure 1 are compared for all chromatograms. These numbers represent the area of the peaks compared to the peaks in rxn 3, so you can compare the amount of products formed. Note: Only ELIMINATION products appear in these chromatograms. Ixn 1 start rxn 2 start 352 5% 8.61 8.53 55% rxn 3 stan rxn 4 7 start 3.52 354 7.26 7.39 51% 19% 30% 875 987 800 989 22% 26% 15% Figure 1. A typical set of chromatograms resulting from reactions 7-4. The peak at 3.43-3.54 is due to an impurity in the solvent 2. Compare the chromatograms for rxnl and rxn2 and give a reason for the main difference you observe. 3. Based on what you know about reactions 1-4, identify the structure that corresponds to each of the three peaks (7.26, 8.75. 9.87) in rxn 3. Compare the chromatograms for rxn3 and rxn4 and justify the observed differences. (HINT: This is NOT about polarity! Think about % composition.) GC activity: Adapted from data presented in "The Study of Elimination Reactions Using Gas Chromato Note: Percents given in Figure 1 are compared for all chromatograms. These numbers represent the area of the peaks compared to the peaks in rxn 3, so you can compare the amount of products formed. Note: Only ELIMINATION products appear in these chromatograms. Ixn 1 start rxn 2 start 352 5% 8.61 8.53 55% rxn 3 stan rxn 4 7 start 3.52 354 7.26 7.39 51% 19% 30% 875 987 800 989 22% 26% 15% Figure 1. A typical set of chromatograms resulting from reactions 7-4. The peak at 3.43-3.54 is due to an impurity in the solvent 2. Compare the chromatograms for rxnl and rxn2 and give a reason for the main difference you observe. 3. Based on what you know about reactions 1-4, identify the structure that corresponds to each of the three peaks (7.26, 8.75. 9.87) in rxn 3. Compare the chromatograms for rxn3 and rxn4 and justify the observed differences. (HINT: This is NOT about polarity! Think about % composition.) GC activity: Adapted from data presented in "The Study of Elimination Reactions Using Gas Chromato
Step by Step Solution
There are 3 Steps involved in it
Step: 1

Get Instant Access to Expert-Tailored Solutions
See step-by-step solutions with expert insights and AI powered tools for academic success
Step: 2

Step: 3
Ace Your Homework with AI
Get the answers you need in no time with our AI-driven, step-by-step assistance
Get Started
Understanding Process Dynamics And Control
Authors: Costas Kravaris, Ioannis K. Kookos
1st Edition
1107035589, 9781107035584