NOTE:
READ THIS EXPLANATION, DON'T WRITE THE COMMENT WITHOUT READING THIS EXPLANATION SUCH AS NOT LEGIBLE,THIS IS BLUR ETC., I MADE AN ALL EXPLANATION BELOW, OK?
==>>The main question is the question in the photo I first posted. If you save the image your PC you can see the photo, Don't wrte the comment "image not clear", If you do that as my sad yu can see and it can be read more clearly. However, I discarded the information in that photo separately in case you couldn't save it. If you can not read the texts and numbers in the first picture, I also photographed each part of that question separately, you can look at them. THANKS. (UPVOTE)
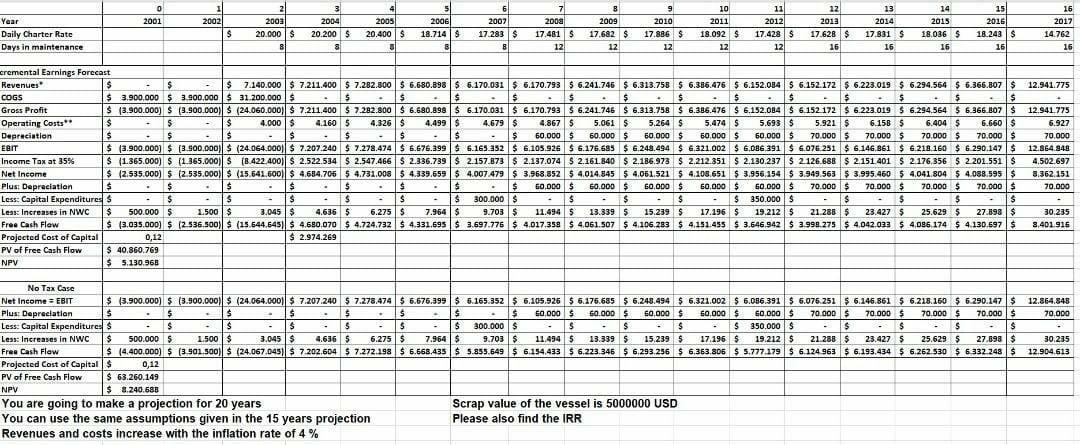
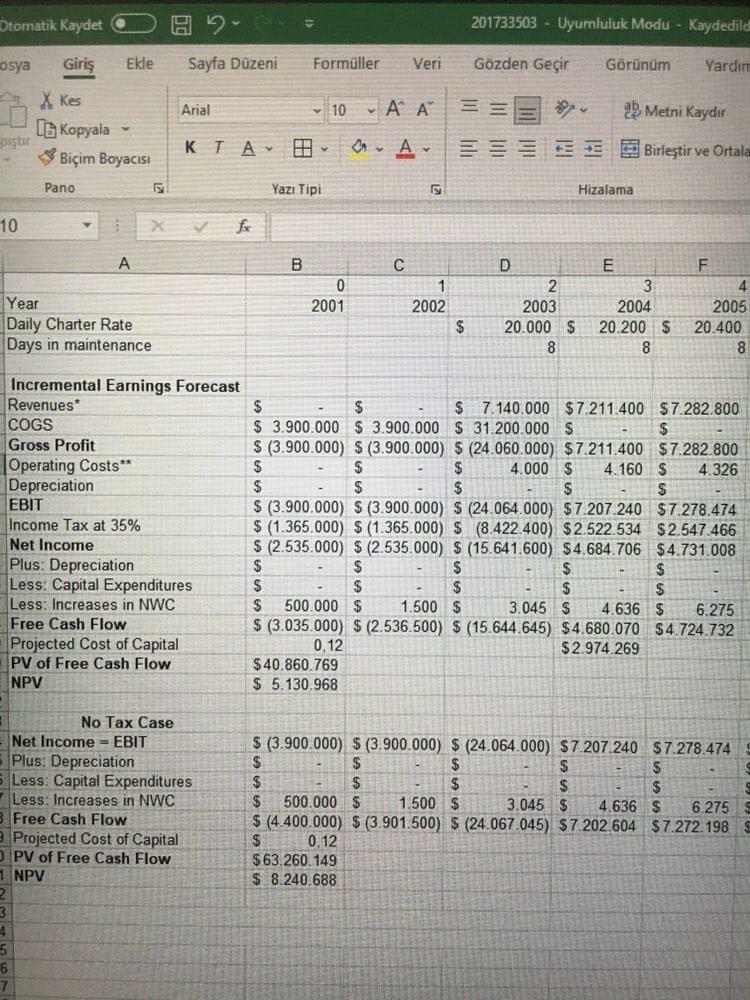
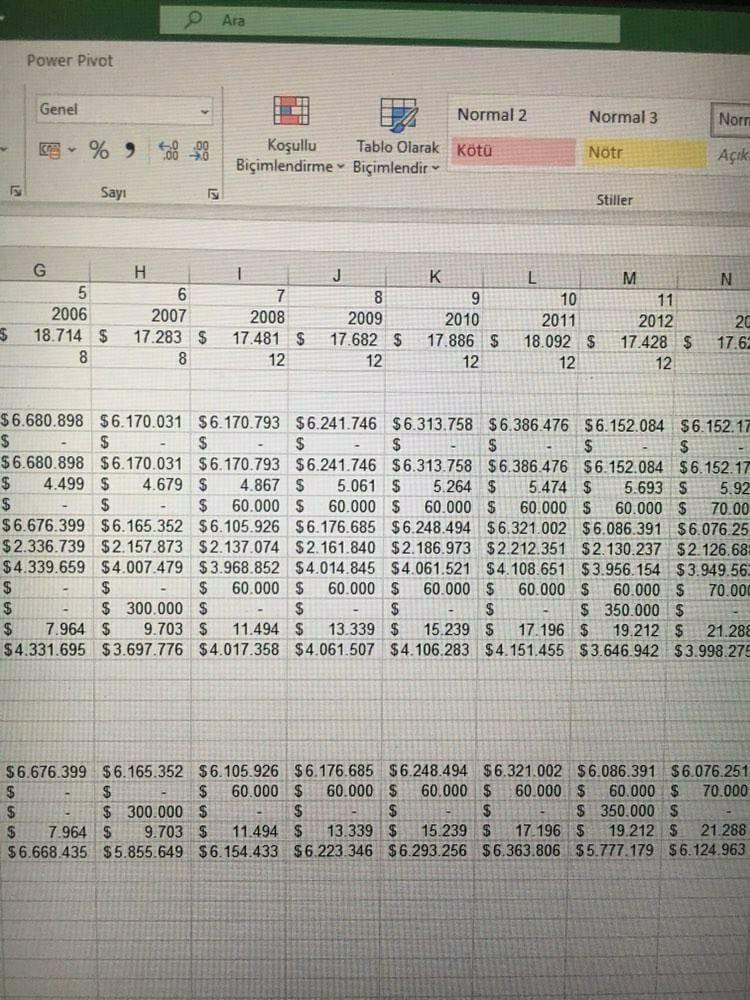
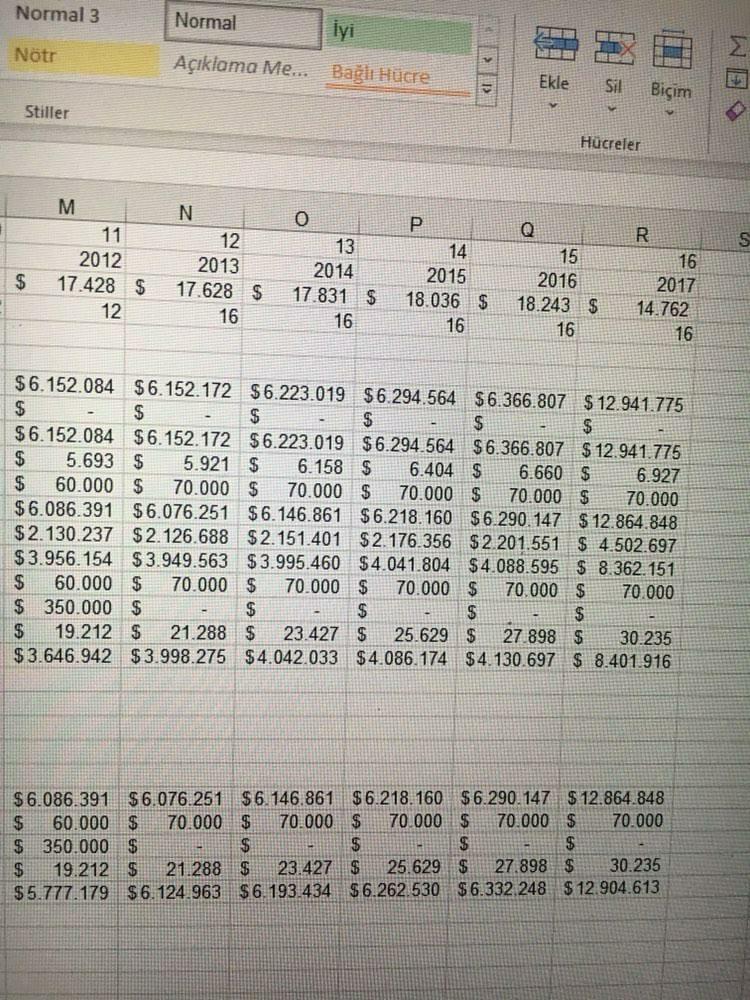
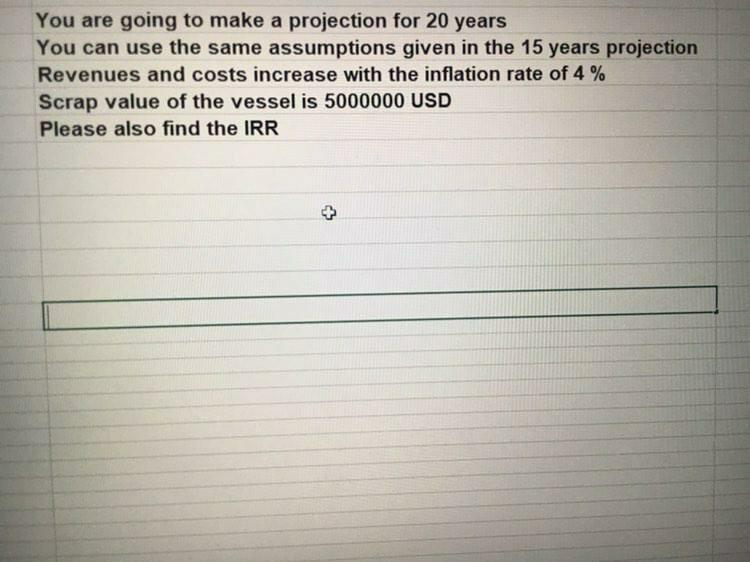
7 2009 9 2010 2001 2002 Year Daily Charter Rate Days in maintenance 2003 20.000 $ 2004 20.200 $ 2005 20.400$ 6 2007 17.283 $ 8 2006 18.7145 8 10 2011 18.092 $ 12 11 2012 17.428 $ 12 2009 17.682 $ 12 12 2013 17.628 $ 16 13 2014 17.831 $ 16 14 2015 18.036 $ 16 15 2016 18.243$ 16 $ 16 2017 14.762 16 17.481 $ 12 17.886 $ 12 8 12.941.775 - cremental Earnings Forecast Revenues $ $ $ 7.140.000 $ 7.211.400 $ 7.282.300 $ 6.680.898 $ 6.170.031 $ 6.170.793 $ 6.241.746 $ 6.313.758 5 6.386.476 $ 6.152.084 5 6.152.172 $ 6.223.019 5 6.294.564 56.366.807 $ COGS $ 3.900,000 $ 3.900.000 $ 31.200.000 $ $ $ $ $ - 5 $ $ $ $ $ . $ $ 5 S Gross Profit $ (3.900.000) $ (3.900.000) $ (24.060,000) $ 7.211.400 $ 7.282.800 $ 6.680.898 $ 6.170.031 $ 6.170.793 $ 6.241.746 $ 6.313.758 $ 6.386.476 $ 6.152.084 $ 6.152.172 $ 6.223.019 $ 6.294.564 $ 6.366 307 $ Operating costs S - S - $ $ 4.000 $ 4.1605 4.326 $ 4.499 $ 4.679 $ 4.8675 5.061 $ 5.264 $ 5.474 $ 5.693 $ 5.921 $ 6.1585 6.404 5 6.660 $ Depreciation $ $ $ $ . $ $ $ $ $ 60,000 $ $ 60.000 $ 60,000 $ 50.000 $ 60,000 $ 70.000 5 70.000 $ 70.000 $ 70.000 $ EBIT $ 3.900.000) $ (3.500.000) $ (24.064.000) $ 7.207.240 $ 7.278.474 $ 6.676.399 $ 6.165.352 $ 6.105.925 $ 6.176.685 $ 6.248.494 $ 6.321.002 $ 6,086 391 $ 4.07 251 $ 6.146.861 $ 6.218.160 $ 6.290.147 $ Income Tox at 35% $ (1.365.000) $ (1.365.000) $18.422.400||$2.522.534 $ 2.547.466 $ 2.336.739 $ 2.157.373 $ 2.137.074 $ 2.161.840 $ 2.186.973 $ 2.212,351 $ 2.130.2372.126.688 $ 2.151.401 $ 2.176,356 $ 2201.551 Net Income $ 12.535.000) 5 (2.535.000) $ (15.641.600) $ 4.684.705 5 4.731.008 5 4.339.659 $ 4.007.479 $ 3.968.852 5 4.014.845 5 4.061.521 5 4.105.651 $ 3.956,154 $ 3.949.563 5 3.995.460 5 4,041.804 5 4.088.595$ Plus: Depreciation $ $ . $ . $ - $ $ $ . $ $ GO.DDO $ 50.000 $ 60,000 $ 50,000 $ 50.000 $ 70.000 $ 70.000 $ 70.000 $ 70.000 $ Less: Capital Expenditures S - $ . 15 $ $ $ . $ 300.000 $ $ $ $ $ 950.000 $ $ $ $ $ Less: Increases in NWC $ 500.000 $ 1.500 $ 3.045$ 4.636 5 6.275$ 7.964 $ 9.7035 11.494 $13.339 5 15.239 17.196 $ 19.212S 21.2885 23.4275 25.6295 27.098 $ Free Cash Flow $ (3,035.000) $ (2.536.500) $ (15.544.5451 $ 4.680.070 $ 4.724.732 $ 4.331.695 $ 3.697.775 $ 4.017.358 $ 4.061.507 $ 4.106.283 $ 4.151.455 $ 3.546.942 $ 3.999.275$ 4,042,033 $ 4085 174 $ 4.130.597 $ Projected Cost of Capital 0,12 $ 2.974,269 PV of Free Cash Flow $ 40,860 769 NPV $ 5.130.963 12.941.775 6.927 70,000 12.864 840 4.502.697 8.362.151 70.000 30.235 8,401.916 12.864.84 70,000 30.235 12.904.613 No Tax Case Net Income = EBIT $ 3.900.000) $ (3.900.000) $ (24.064.000 $ 7.207.240 5 7.278.474 $ 6.675.399 $ 5.165.352 $ 6.105,925 $ 6.175.685 5 6.243.494 $ 6.321.002 $ 6.056.391 $ 6.075.251 $ 6.146.861 5 6.218.160 5 6.290.147 $ Plus: Depreciation $ $ $ $ $ - $ $ $ 50.000 $ 50.000 $ 50.000 $ 50.000 $ 50.000$ 70.000 $ 70.000 $ 70.000 $ 70.000 $ Less: Capital Expenditures $ $ $ $ S $ 300.000 S $ $ $ $ 350.000$ Is $ $ $ $ Less: Increases in NWC $ 500.000 $ 1.500 $ 3.045 $ 4.636 5 6.275$ 7.964 $ 9.703 $ 11.4945 13.339 $ 15,2395 17.196 $ 19.212 $ 21.2885 23.4275 25.629 $ 27.698$ Free Cash Flow $ (4.400.000) $ (3.901.500) $ (24.067.0451 $ 7.202.604 $ 7.272.198 $ 6.668,435 $ 5.855.549 $ 6.154.433 $ 6.223.346 $ 6.293.256 $ 6,363.805 $ 5.777.179 $ 6.124 963 $ 6.193.434 $ 6.262.530 $ 6.332.248 $ Projected Cost of Capitals 0,12 PV of Free Cash Flow $ 63.260.149 NPV $ 8.240.688 You are going to make a projection for 20 years Scrap value of the vessel is 5000000 USD You can use the same assumptions given in the 15 years projection Please also find the IRR Revenues and costs increase with the inflation rate of 4% Otomatik Kaydet 201733503 - Uyumluluk Modu - Kaydedila osya Giri Ekle Sayfa Dzeni Formller Veri Gozden Geir Grnm Yardn Arial 10 A A == 25 Metni kaydir X kes [ Kopyala - pastir Biim Boyacs Pano K TA a. Ar - - Birlesir ve Otale Yaz Tipi Hizalama 10 f fx 0 2001 1 2002 Year Daily Charter Rate Days in maintenance D 2 2003 20.000 $ 8 E 3 2004 20.200 $ 8 F 4 2005 20.400 8 $ Incremental Earnings Forecast Revenues* COGS Gross Profit Operating Costs** Depreciation EBIT Income Tax at 35% Net Income Plus: Depreciation Less: Capital Expenditures Less: Increases in NWC Free Cash Flow Projected Cost of Capital PV of Free Cash Flow NPV $ $ $ 7.140.000 $7.211.400 $7.282.800 $ 3.900.000 $ 3.900.000 $ 31.200.000 $ $ $ (3.900.000) $ (3.900.000) $ (24.060.000) $7.211.400 $7.282.800 $ $ $ 4.000 $ 4.160 $ 4.326 $ $ $ $ S $ (3.900.000) S (3.900.000) S (24.064.000) $7.207.240 $7.278.474 $ (1.365.000) $ (1.365.000) $ (8.422.400) $2.522.534 $2.547.466 $ (2.535.000) $ (2.535.000) $ (15.641.600) $4.684.706 $4.731.008 $ $ $ $ $ $ $ $ $ $ 500.000 $ 1.500 $ 3.045 $ 4.636 $ 6.275 $ (3.035.000) $ (2.536.500) $ (15.644.645) $4.680.070 $4.724.732 0,12 $2.974.269 $40.860.769 $ 5.130.968 No Tax Case Net Income = EBIT Plus: Depreciation 5 Less: Capital Expenditures Less: Increases in NWC 3 Free Cash Flow Projected Cost of Capital PV of Free Cash Flow 1 NPV $ (3.900.000) $ (3.900.000) $ (24.064.000) $7.207.240 $7.278.474 $ $ $ $ $ $ $ $ $ 500.000 $ 1.500 $ 3.045 $ 4.636 $ 6.275 $ (4.400.000) $ (3.901.500) $ (24.067.045) $7.202.604 $7.272.198 $0.12 $63.260.149 $ 8.240.688 4 5 6 7 p Ara Power Pivot Genel Normal 2 Normal 3 Norr %, do not Koullu Tablo Olarak Kt Biimlendirme Biimlendir Ntr Ak Sayi Stiller N G 5 2006 18.714 $ 8 H 6 2007 17.283 $ 8 1 7 2008 17.481 $ 12 8 2009 17.682 $ 12 K 9 2010 17.886 $ 12 L 10 2011 18.092 $ 12 M 11 2012 17.428 $ 12 20 17.6 $6.680.898 $6.170.031 $6.170.793 $6.241.746 $6.313.758 $6.386.476 $6.152.084 $6.152.17 $ $ $ $ $ $ $ $ $6.680.898 $6.170.031 $6.170.793 $6.241.746 $6.313.758 $6.386.476 $6.152.084 $6.152.17 $ 4.499 $ 4.679 $ 4.867 $ 5.061 $ 5.264 $ 5.474 $ 5.693 $ 5.92 $ $ $ 60.000 $ 60.000 $ 60.000 $ 60.000 $ 60.000 $ 70.00 $6.676.399 $6.165.352 $6.105.926 $6.176.685 $ 6.248.494 $6.321.002 $6.086.391 $6.076.25 $2.336.739 $2.157.873 $2.137.074 $ 2.161.840 $2.186.973 $2.212.351 $2.130.237 $2.126.68 $4.339.659 $4.007.479 $3.968.852 $4.014.845 $4.061.521 $4.108.651 $3.956.154 $3.949.56 $ $ $ 60.000 $ 60.000 $ 60.000 $ 60.000 $ 60.000 $ 70.000 $ $ 300.000 $ $ $ $ $ 350.000 $ $ 7.964 $ 9.703 $ 11.494 $ 13.339 $ 15.239 $ 17.196 $ 19.212 $ 21.288 $4.331.695 $3.697.776 $4.017.358 $4.061.507 $4.106.283 $4.151.455 $3.646.942 $3.998.27 $6.676.399 $6.165.352 $6.105.926 $6.176.685 $6.248.494 $6.321.002 $6.086.391 $6.076.251 $ $ 60.000 $ 60.000 $ 60.000 $ 60.000 $ 60.000 $ 70.000 $ $ 300.000 $ $ 350.000 $ $ 7.964 $ 9.703 $ 11.494 $ 13.339 $ 15.239 $ 17.196 $ 19.212 $ 21.288 $6.668.435 $5.855.649 $6.154.433 $6.223.346 $6.293.256 $6.363.806 $5.777.179 $6.124.963 Normal 3 Normal iyi Ntr Aklama Me... Bagli Hcre Ekle Sil P. Biim Stiller Hcreler S M 11 2012 17.428 $ 12 N 12 2013 17.628 $ 16 o 13 2014 17.831 $ 16 14 2015 18.036 $ 16 $ 15 2016 18.243 $ 16 R 16 2017 14.762 16 $6.152.084 $6.152.172 $6.223.019 $6.294.564 $6.366.807 $12.941.775 $ $ $ $ $ $ $6.152.084 $6.152.172 $6.223.019 $6.294.564 $6.366.807 $12.941.775 $ 5.693 $ 5.921 $ 6.158 $ 6.404 $ 6.660 $ 6.927 $ 60.000 $ 70.000 $ 70.000 $ 70.000 $ 70,000 $ 70.000 $6.086.391 $6.076.251 $6.146.861 $6.218.160 $6.290.147 $12.864.848 $2.130.237 $ 2.126.688 $ 2.151.401 $2.176.356 $2.201.551 $ 4.502.697 $3.956.154 $3.949.563 $3.995.460 $4.041.804 $4.088.595 $ 8.362.151 $ 60.000 $ 70.000 $ 70.000 $ 70.000 $ 70.000 $ 70.000 $ 350.000 $ $ $ $ $ $ 19.212 $ 21.288 $ 23.427 $ 25.629 $ 27 898 $ 30.235 $ 3.646.942 $3.998.275 $4.042.033 $4.086.174 $4.130.697 $ 8.401.916 $6.086.391 $6.076.251 $6.146.861 $6.218.160 $6.290.147 $ 12.864.848 $ 60.000 $ 70,000 $ 70.000 $ 70 000 $ 70.000 $ 70.000 $ 350.000 $ $ $ $ $ $ 19.212 5 21.288 $ 23.427 $ 25.629 $ 27.898 $ 30.235 $5.777.179 $6.124.963 $6.193.434 $6.262.530 $6.332 248 $12.904.613 You are going to make a projection for 20 years You can use the same assumptions given in the 15 years projection Revenues and costs increase with the inflation rate of 4% Scrap value of the vessel is 5000000 USD Please also find the IRR +


