Answered step by step
Verified Expert Solution
Question
1 Approved Answer
Note that you'll need to use the quadratic equation to get the roots of r(s). To simplify things, you can just look at the

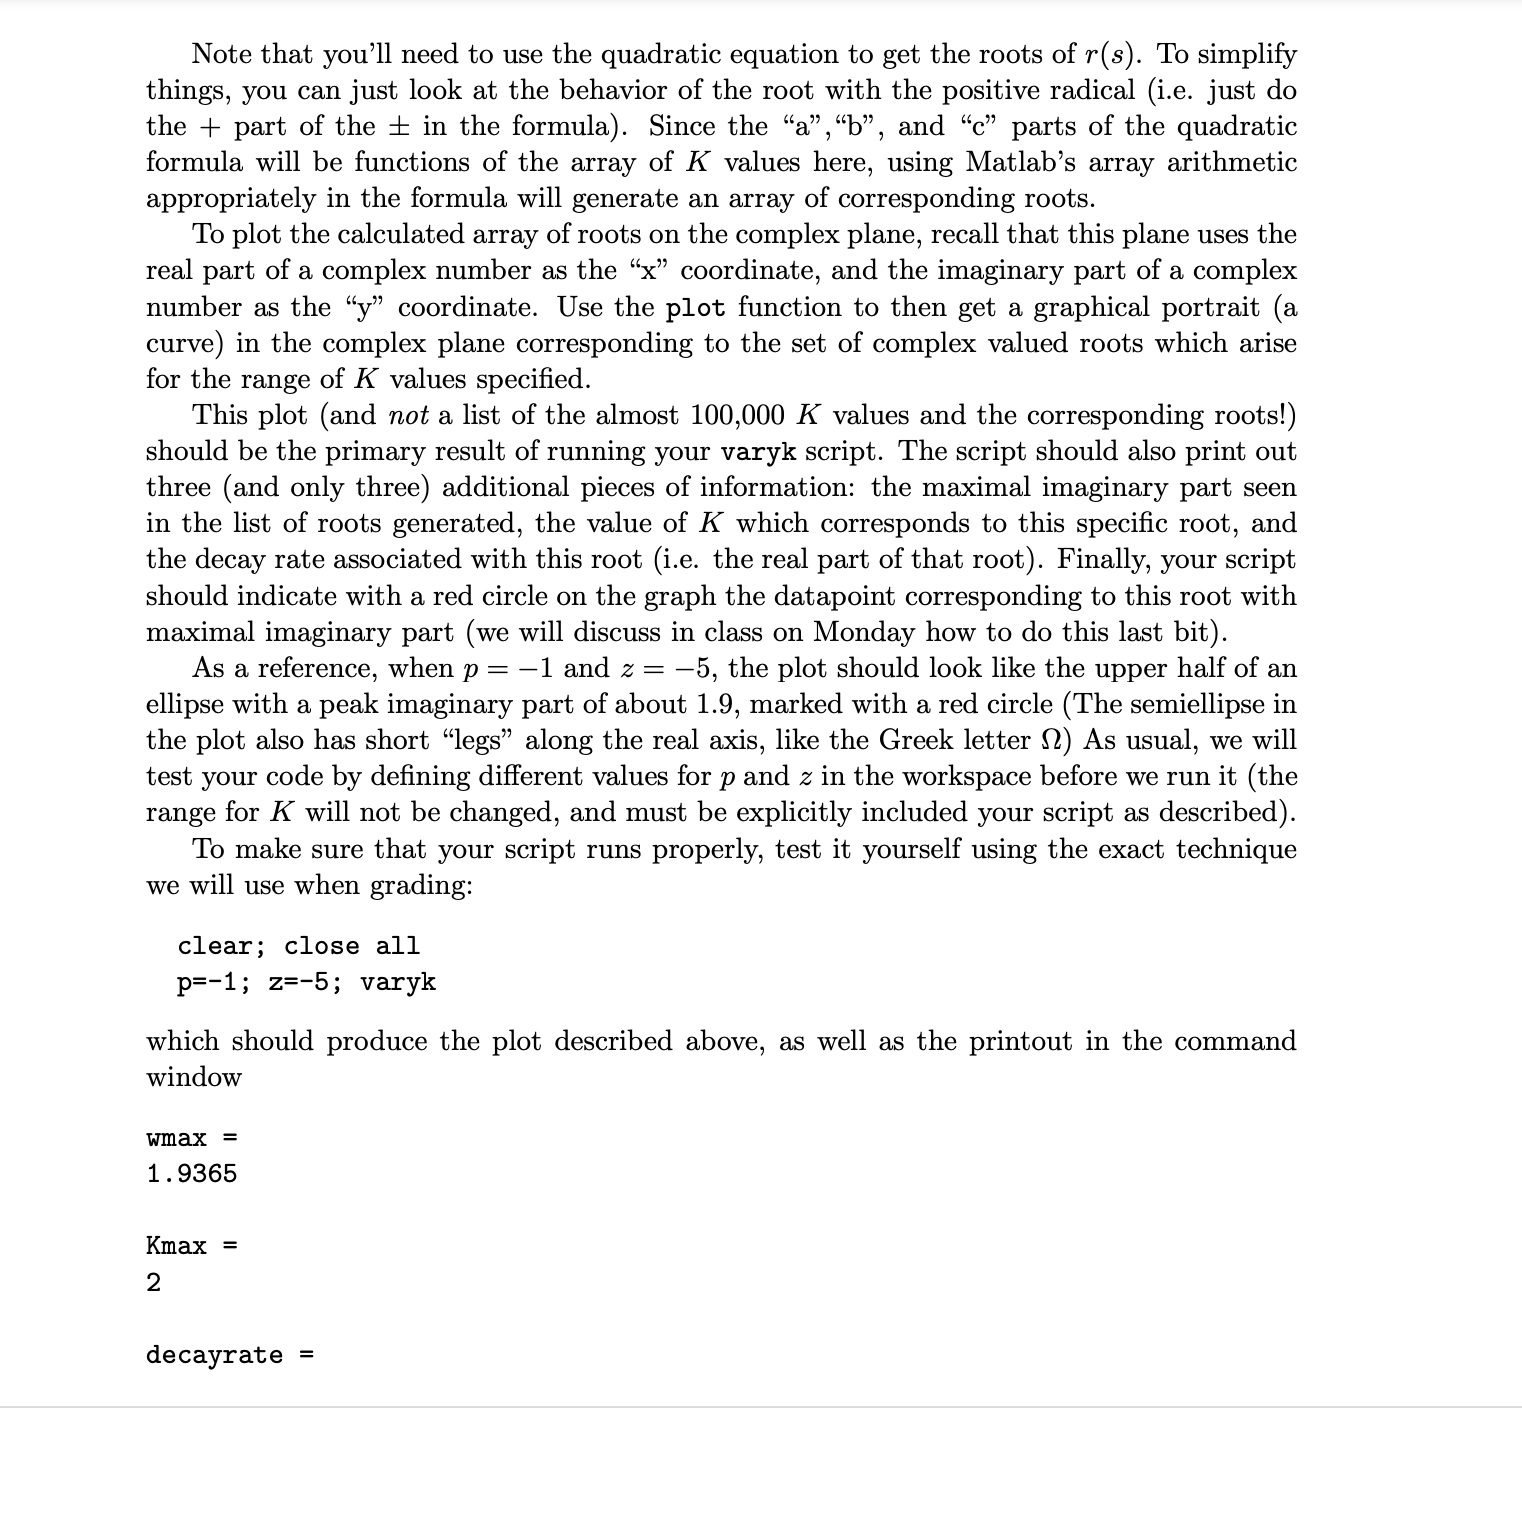
Note that you'll need to use the quadratic equation to get the roots of r(s). To simplify things, you can just look at the behavior of the root with the positive radical (i.e. just do the part of the in the formula). Since the a,b, and c parts of the quadratic formula will be functions of the array of K values here, using Matlab's array arithmetic appropriately in the formula will generate an array of corresponding roots. To plot the calculated array of roots on the complex plane, recall that this plane uses the real part of a complex number as the "x" coordinate, and the imaginary part of a complex number as the "y" coordinate. Use the plot function to then get a graphical portrait (a curve) in the complex plane corresponding to the set of complex valued roots which arise for the range of K values specified. This plot (and not a list of the almost 100,000 K values and the corresponding roots!) should be the primary result of running your varyk script. The script should also print out three (and only three) additional pieces of information: the maximal imaginary part seen in the list of roots generated, the value of K which corresponds to this specific root, and the decay rate associated with this root (i.e. the real part of that root). Finally, your script should indicate with a red circle on the graph the datapoint corresponding to this root with maximal imaginary part (we will discuss in class on Monday how to do this last bit). As a reference, when p = -1 and z = -5, the plot should look like the upper half of an ellipse with a peak imaginary part of about 1.9, marked with a red circle (The semiellipse in the plot also has short "legs" along the real axis, like the Greek letter ) As usual, we will test your code by defining different values for p and z in the workspace before we run it (the range for K will not be changed, and must be explicitly included your script as described). To make sure that your script runs properly, test it yourself using the exact technique we will use when grading: clear; close all p=-1; z=-5; varyk which should produce the plot described above, as well as the printout in the command window wmax = 1.9365 Kmax = 2 decayrate
Step by Step Solution
There are 3 Steps involved in it
Step: 1

Get Instant Access to Expert-Tailored Solutions
See step-by-step solutions with expert insights and AI powered tools for academic success
Step: 2

Step: 3

Ace Your Homework with AI
Get the answers you need in no time with our AI-driven, step-by-step assistance
Get Started


