note: this is managerial economics subject.
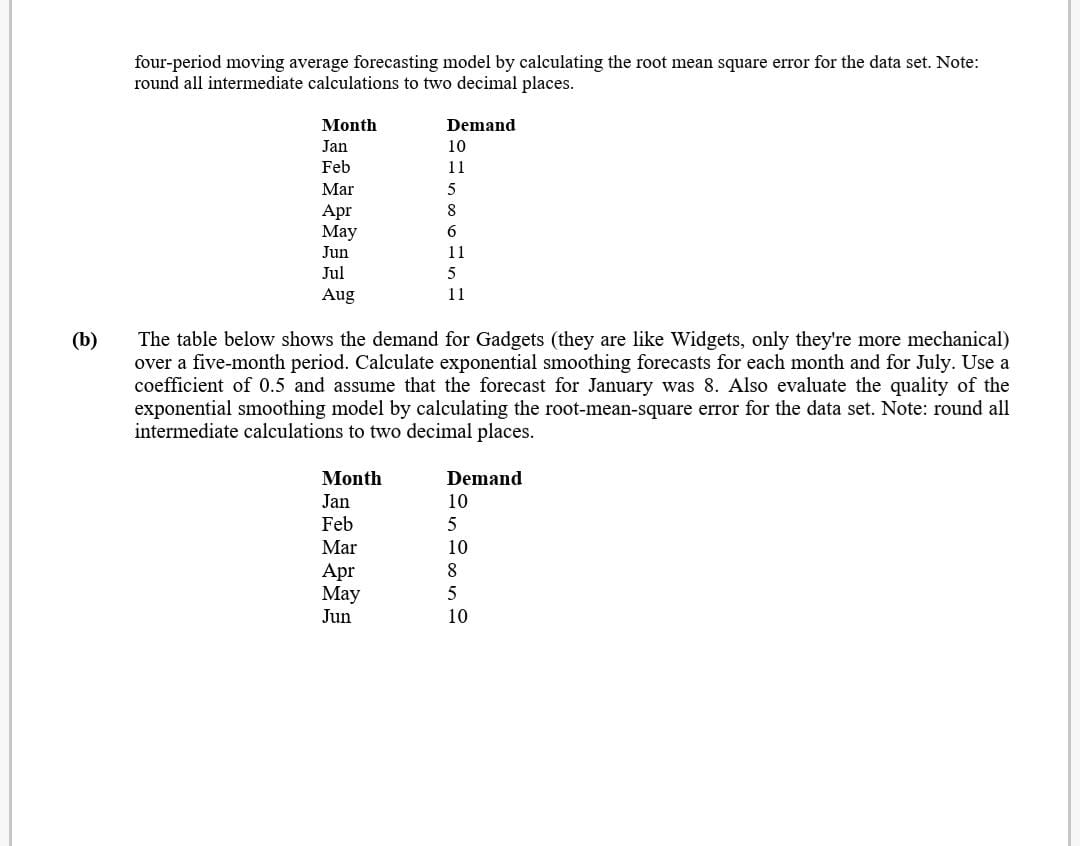
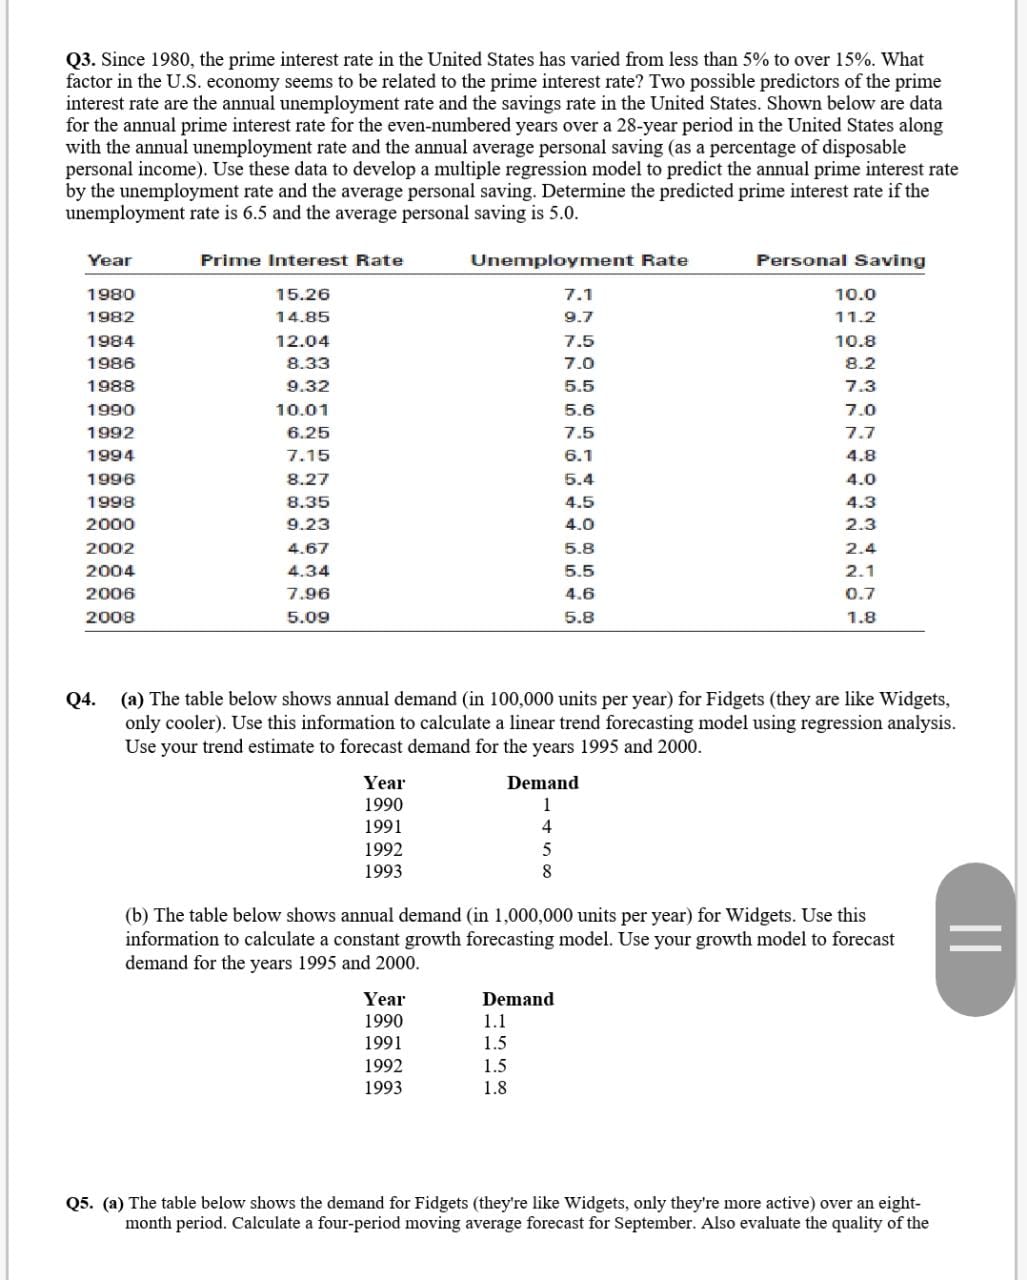
four-period moving average forecasting model by calculating the root mean square error for the data set. Note: round all intermediate calculations to two decimal places. Month Demand I an 10 Feb 1 1 Mar 5 Apr 8 May 6 Jun 1 1 Jul 5 Aug 1 l (b) The table below shows the demand for Gadgets (they are like Widgets, only they're more mechanical) over a ve-month period. Calculate exponential smoothing forecasts for each month and for July. Use a coeicient of 0.5 and assume that the forecast for January was 8. Also evaluate the quality of the exponential smoothing model by calculating the root-mean-square cam for the data set. Note: round all intermediate calculations to two decimal places. Month Demand 1 an l0 Feb 5 Mar 10 Apr 8 May 5 Jun 10 Q3. Since 1980, the prime interest rate in the United States has varied from less than 5% to over 15%. What factor in the U.S. economy seems to be related to the prime interest rate? Two possible predictors of the prime interest rate are the annual unemployment rate and the savings rate in the United States. Shown below are data for the annual prime interest rate for the even-numbered years over a 28-year period in the United States along with the annual unemployment rate and the annual average personal saving (as a percentage of disposable personal income). Use these data to develop a multiple regression model to predict the annual prime interest rate by the unemployment rate and the average personal saving. Determine the predicted prime interest rate if the unemployment rate is 6.5 and the average personal saving is 5.0. Year Prime Interest Rate Unemployment Rate Personal Saving 1980 15.26 7.1 10.0 1982 14.85 9.7 11.2 1984 12.04 7.5 10.8 1986 8.33 7.0 8.2 1988 9.32 5.5 7.3 1990 10.01 5.6 7.0 1992 6.25 7.5 7.7 1994 7.15 6.1 4.8 1996 8.27 6.4 4.0 1998 8.35 4.5 4.3 2000 9.23 4.0 2.3 2002 4.67 5.8 2.4 2004 4.34 5.5 2.1 2006 7.96 4.6 0.7 2008 5.09 5.8 1.8 Q4. (a) The table below shows annual demand (in 100,000 units per year) for Fidgets (they are like Widgets, only cooler). Use this information to calculate a linear trend forecasting model using regression analysis. Use your trend estimate to forecast demand for the years 1995 and 2000. Year Demand 1990 1991 1992 1993 (b) The table below shows annual demand (in 1,000,000 units per year) for Widgets. Use this information to calculate a constant growth forecasting model. Use your growth model to forecast demand for the years 1995 and 2000. Year Demand 1990 1.1 1991 1.5 1992 1.5 1993 1.8 Q5. (a) The table below shows the demand for Fidgets (they're like Widgets, only they're more active) over an eight- month period. Calculate a four-period moving average forecast for September. Also evaluate the quality of the