

Answered step by step
Verified Expert Solution
Question
1 Approved Answer
Notes Revenues is driven by the growth rate 39 Hints for Working on this Assignment 40 This exercises is a bit like solving a puzzle.
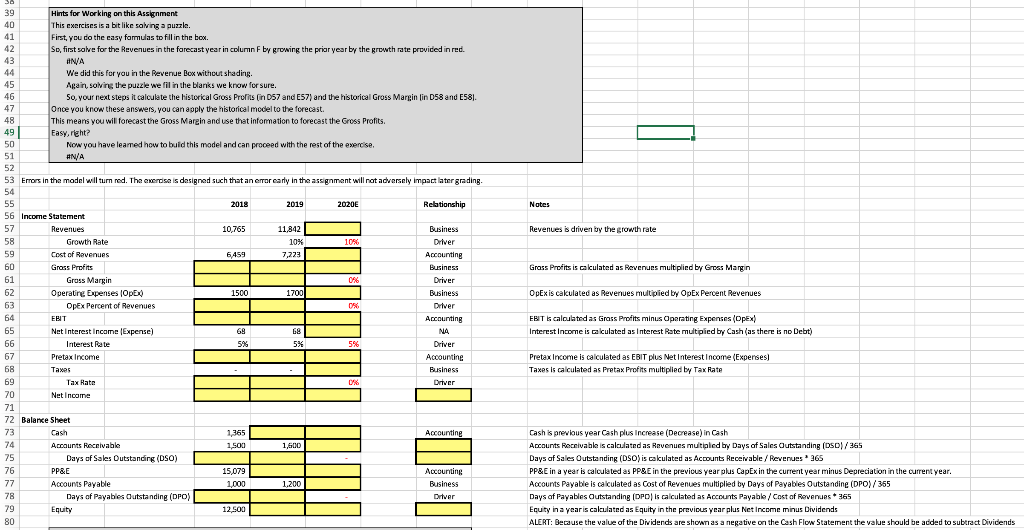 | ||||||||||||||
Notes Revenues is driven by the growth rate 39 Hints for Working on this Assignment 40 This exercises is a bit like solving a puzzle. 41 First, you do the easy formulas to fill in the box. 42 So, first solve for the Revenues in the forecast year in columnF by growing the prior year by the growth rate provided in red. 43 ANA We did this for you in the Revenue Box without shading. 45 Again, solving the puzzle we fill in the blanks we know for sure. 46 50, your next steps it calculate the historical Gross Profits (in D57 and E57) and the historical Gross Margin in D58 and E58). 47 Once you know these answers, you can apply the historical model to the forecast. 48 This means you will forecast the Gross Margin and use that information to forecast the Gross Profits. 49 Easy, right? 50 Now you have leamed how to buid this model and can proceed with the rest of the exercise 51 ANJA 52 53 Errors in the model will turn red. The exercise is designed such that an error early in the assignment will not adversely impact later grading 54 55 2018 2019 2020E Relationship 56 Income Statement 57 Revenues 10,765 11,842 Business 58 Growth Rate 10% 10% Driver 59 Cost of Revenues 6459 7,223 Accounting 60 Grass Profits Business 61 Grass Margin 0% Driver 62 Operating Expenses Opby 1500 1700 Business 63 OpEx Percent of Revenues Driver 64 EBIT Accounting 65 Net Interest Income (Expense) 69 G8 NA 66 Interest Rate 5% 5% 5% Driver 67 Pretax Income Accounting 68 Taxes Business 69 Tax Rate Driver 70 Net Income 71 72 Balance Sheet 73 Cash 1,365 Accounting 74 Accounts Receivable 1,500 1,600 75 Days of Sales Outstanding (DSO) 76 PP&E 15,079 Accounting 77 Accounts Payable 1.000 1.200 Business 78 Days of Payables Outstanding (DPO) Driver 79 Equity 12.500 80 Grass Profits is cakulated as Revenues multiplied by Gross Margin OpExis cakulated as Revenues multiplied by OpEx Percent Revenues EBIT calculated as Grass Profits minus Operating Expenses (Opex Interest Income is calculated as Interest Rate multiplied by Cash (as there is no Debt) Pretax Income is calculated as EBIT plus Net Interest Income (Expenses) Taxes is calculated as Pretax Profits multiplied by Tax Rate Cash is previous year Cash plus increase (Decrease) in Cash Accounts Receivable is calculated as Revenues multiplied by Days of Sales Outstanding (OSD)/365 Days of Sales Outstanding (DSO) is calculated as Accounts Receivable / Revenues 265 PP&E in a year is calculated as PP&E in the previous year plus CapEx in the current year minus Depreciation in the current year. Accounts Payable is calculated as Cost of Revenues multiplied by Days of Payables Outstandine (DPO)/365 Days of Payables Outstanding (DPO) is calculated as Accounts Payable / Cost of Revenues 365 Equity in a year is calculated as Equity in the previous year plus Net Income minus Dividends ALERT: Because the value of the Dividends are shown as a negative on the Cash Flow Statement the value should be added to subtract Dividends Notes Revenues is driven by the growth rate 39 Hints for Working on this Assignment 40 This exercises is a bit like solving a puzzle. 41 First, you do the easy formulas to fill in the box. 42 So, first solve for the Revenues in the forecast year in columnF by growing the prior year by the growth rate provided in red. 43 ANA We did this for you in the Revenue Box without shading. 45 Again, solving the puzzle we fill in the blanks we know for sure. 46 50, your next steps it calculate the historical Gross Profits (in D57 and E57) and the historical Gross Margin in D58 and E58). 47 Once you know these answers, you can apply the historical model to the forecast. 48 This means you will forecast the Gross Margin and use that information to forecast the Gross Profits. 49 Easy, right? 50 Now you have leamed how to buid this model and can proceed with the rest of the exercise 51 ANJA 52 53 Errors in the model will turn red. The exercise is designed such that an error early in the assignment will not adversely impact later grading 54 55 2018 2019 2020E Relationship 56 Income Statement 57 Revenues 10,765 11,842 Business 58 Growth Rate 10% 10% Driver 59 Cost of Revenues 6459 7,223 Accounting 60 Grass Profits Business 61 Grass Margin 0% Driver 62 Operating Expenses Opby 1500 1700 Business 63 OpEx Percent of Revenues Driver 64 EBIT Accounting 65 Net Interest Income (Expense) 69 G8 NA 66 Interest Rate 5% 5% 5% Driver 67 Pretax Income Accounting 68 Taxes Business 69 Tax Rate Driver 70 Net Income 71 72 Balance Sheet 73 Cash 1,365 Accounting 74 Accounts Receivable 1,500 1,600 75 Days of Sales Outstanding (DSO) 76 PP&E 15,079 Accounting 77 Accounts Payable 1.000 1.200 Business 78 Days of Payables Outstanding (DPO) Driver 79 Equity 12.500 80 Grass Profits is cakulated as Revenues multiplied by Gross Margin OpExis cakulated as Revenues multiplied by OpEx Percent Revenues EBIT calculated as Grass Profits minus Operating Expenses (Opex Interest Income is calculated as Interest Rate multiplied by Cash (as there is no Debt) Pretax Income is calculated as EBIT plus Net Interest Income (Expenses) Taxes is calculated as Pretax Profits multiplied by Tax Rate Cash is previous year Cash plus increase (Decrease) in Cash Accounts Receivable is calculated as Revenues multiplied by Days of Sales Outstanding (OSD)/365 Days of Sales Outstanding (DSO) is calculated as Accounts Receivable / Revenues 265 PP&E in a year is calculated as PP&E in the previous year plus CapEx in the current year minus Depreciation in the current year. Accounts Payable is calculated as Cost of Revenues multiplied by Days of Payables Outstandine (DPO)/365 Days of Payables Outstanding (DPO) is calculated as Accounts Payable / Cost of Revenues 365 Equity in a year is calculated as Equity in the previous year plus Net Income minus Dividends ALERT: Because the value of the Dividends are shown as a negative on the Cash Flow Statement the value should be added to subtract Dividends
Step by Step Solution
There are 3 Steps involved in it
Step: 1

Get Instant Access to Expert-Tailored Solutions
See step-by-step solutions with expert insights and AI powered tools for academic success
Step: 2

Step: 3
Ace Your Homework with AI
Get the answers you need in no time with our AI-driven, step-by-step assistance
Get Started
Financial Management For Public Health And Not-for-Profit Organizations
Authors: Steven A. Finkler, Daniel L. Smith, Thad D. Calabrese, Robert M. Purtell
7th Edition
1071835335, 978-1071835333