Answered step by step
Verified Expert Solution
Question
1 Approved Answer
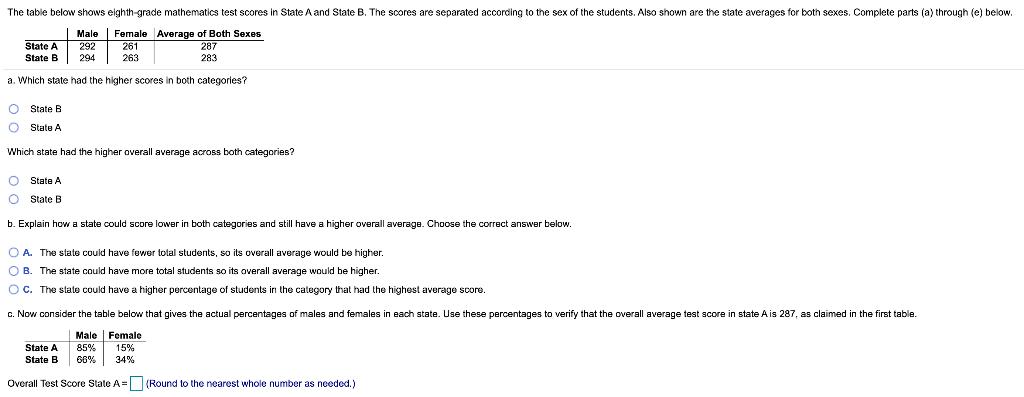
The table below shows eighth-grade mathematics test scores in State A and State B. The scores are separated according to the sex of the


The table below shows eighth-grade mathematics test scores in State A and State B. The scores are separated according to the sex of the students. Also shown are the state averages for both sexes. Complete parts (a) through Male Female Average of Both Sexes State A 292 261 263 State B 294 a. Which state had the higher scores in both categories? 287 283 O State B O State A Which state had the higher overall average across both categories? O State A O State B b. Explain how a state could score lower both categories and still have a higher overall average. Choose the correct answer below. OA. The state could have fewer total students, so its overall average would be higher. OB. The state could have more total students so its overall average would be higher. OC. The state could have a higher percentage of students in the category that had the highest average score. c. Now consider the table below that gives the actual percentages of males and females in each state. Use these percentages to verify that the overall average test score in state A is 287, as claimed in the first table. Male Female State A 85% 15% State B 66% 34% Overall Test Score State A= (Round to the nearest whole number as needed.) below. The table below shows eighth-grade mathematics test scores in State A and State B. The scores are separated according to the sex of the students. Also shown are the state averages for both sexes. Complete parts (a) through Male Female Average of Both Sexes State A 292 261 263 State B 294 a. Which state had the higher scores in both categories? 287 283 O State B O State A Which state had the higher overall average across both categories? O State A O State B b. Explain how a state could score lower both categories and still have a higher overall average. Choose the correct answer below. OA. The state could have fewer total students, so its overall average would be higher. OB. The state could have more total students so its overall average would be higher. OC. The state could have a higher percentage of students in the category that had the highest average score. c. Now consider the table below that gives the actual percentages of males and females in each state. Use these percentages to verify that the overall average test score in state A is 287, as claimed in the first table. Male Female State A 85% 15% State B 66% 34% Overall Test Score State A= (Round to the nearest whole number as needed.) below. (Round to the nearest whole number as needed.) d. Use the table from part (c) to verify that the overall average test score in State B is 283, as claimed in the first table. (Round to the nearest whole number as needed.) e. Explain the apparent inconsistency in these results. Choose the correct answer below. Overall Test Score State A = Overall Test Score State B = A. Although State A had lower scores in each category, it had fewer people, so the overall average is higher. B. Although State A had higher scores in each category, it had a higher percentage of people in the lower scoring category, so the overall average is lower. C. Although State A had higher scores in each category, it had more people, so the overall average is lower. D. Although State A had lower scores in each category, it had a higher percentage of people in the higher scoring category, so the overall average is higher. Find the monthly interest payment in the situation described below. Assume that the monthly interest rate is 1/ 12 of the annual interest rate. You maintain an average balance of $660 on your credit card, which carries a 15% annual interest rate. The monthly interest payment is $ (Type an integer or a decimal.)
Step by Step Solution
★★★★★
3.49 Rating (175 Votes )
There are 3 Steps involved in it
Step: 1
a Which state had the higher scores in both categories State B Which state had ...
Get Instant Access to Expert-Tailored Solutions
See step-by-step solutions with expert insights and AI powered tools for academic success
Step: 2

Step: 3

Ace Your Homework with AI
Get the answers you need in no time with our AI-driven, step-by-step assistance
Get Started


