Question: Now determine which of the five forecast models performed the best based on MAD, MSE, and MAPE. Think about why the particular model performed the
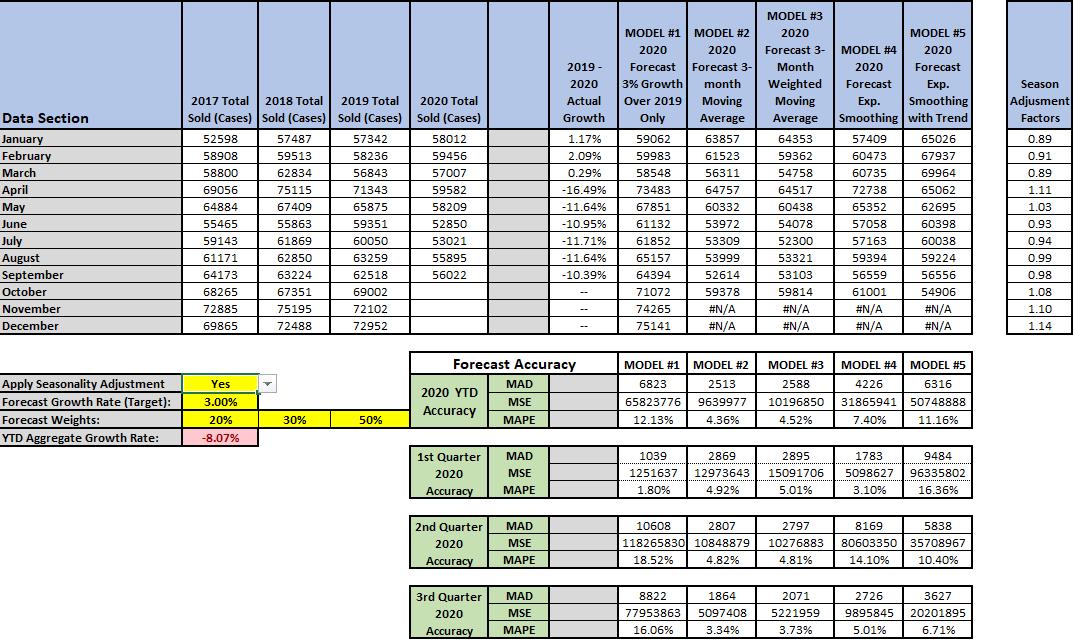
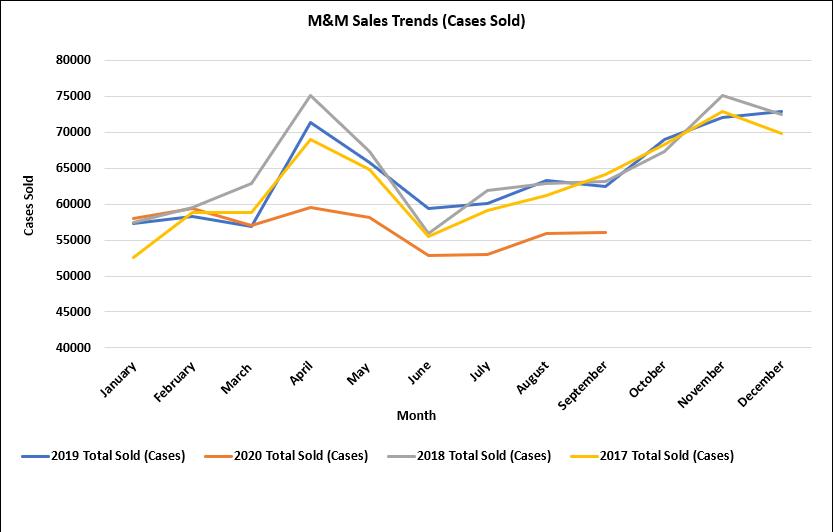
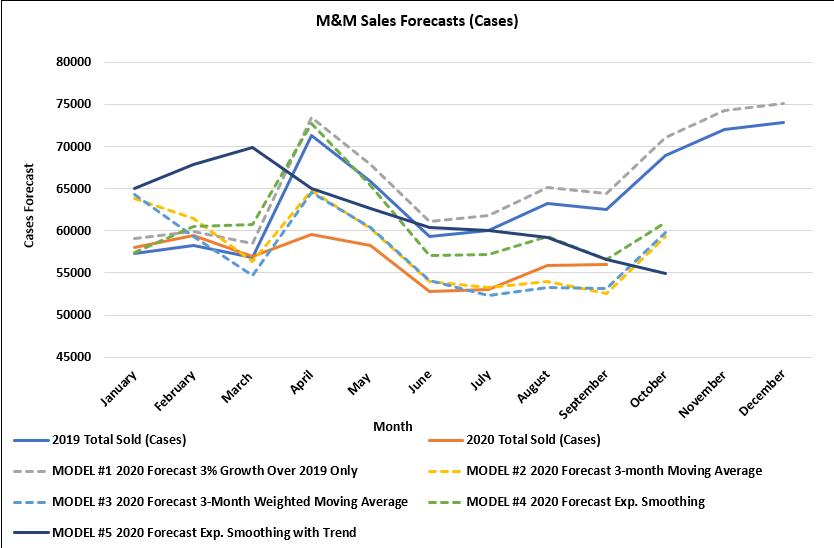
Now determine which of the five forecast models performed the best based on MAD, MSE, and MAPE. Think about why the particular model performed the best across the first nine months of the year and include this assessment in your report as part of your recommendation. 


Data Section January February March April May June July August September October November December Apply Seasonality Adjustment Forecast Growth Rate (Target): Forecast Weights: YTD Aggregate Growth Rate: 2017 Total Sold (Cases) 52598 58908 58800 69056 64884 55465 59143 61171 64173 68265 72885 69865 Yes 3.00% 20% -8.07% 2018 Total Sold (Cases) 57487 59513 62834 75115 67409 55863 61869 62850 63224 67351 75195 72488 30% 2019 Total Sold (Cases) 57342 58236 56843 71343 65875 59351 60050 63259 62518 69002 72102 72952 50% 2020 Total Sold (Cases) 58012 59456 57007 59582 58209 52850 53021 55895 56022 2020 YTD Accuracy Forecast Accuracy 1st Quarter 2020 Accuracy 2nd Quarter 2020 Accuracy 3rd Quarter 2020 Accuracy MAD MSE MAPE MAD MSE MAPE MAD MSE MAPE 2019- 2020 Actual Growth MAD MSE MAPE 1.17% 2.09% 0.29% -16.49% -11.64% -10.95% -11.71% -11.64% -10.39% - MODEL #1 2020 Forecast 3% Growth Over 2019 Only 59062 59983 58548 73483 67851 61132 61852 65157 64394 71072 74265 75141 MODEL #1 6823 65823776 12.13% MODEL #2 2020 Forecast 3- month Moving Average 63857 61523 56311 64757 60332 53972 53309 53999 52614 59378 #N/A #N/A MODEL #2 2513 9639977 4.36% MODEL #3 2020 Forecast 3- Month Weighted Moving Average 64353 59362 54758 64517 60438 54078 52300 53321 53103 59814 #N/A #N/A MODEL #3 2588 10196850 4.52% 1039 2869 2895 1251637 12973643 15091706 1.80% 4.92% 5.01% 10608 2807 2797 118265830 10848879 10276883 18.52% 4.82% 4.81% 8822 1864 2071 77953863 5097408 5221959 16.06% 3.34% 3.73% MODEL #4 2020 Forecast Exp. Smoothing with Trend MODEL #5 2020 Forecast Exp. Smoothing 57409 60473 60735 72738 65352 57058 57163 59394 56559 61001 #N/A #N/A MODEL #4 4226 31865941 7.40% 1783 5098627 3.10% 65026 67937 69964 65062 62695 60398 60038 59224 56556 54906 #N/A #N/A MODEL #5 6316 50748888 11.16% 9484 96335802 16.36% 8169 5838 80603350 35708967 14.10% 10.40% 2726 3627 9895845 20201895 5.01% 6.71% Season Adjusment Factors 0.89 0.91 0.89 1.11 1.03 0.93 0.94 0.99 0.98 1.08 1.10 1.14
Step by Step Solution
3.45 Rating (181 Votes )
There are 3 Steps involved in it
Question Generally MAD MSE MAPE for the type of model ... View full answer

Get step-by-step solutions from verified subject matter experts


