Answered step by step
Verified Expert Solution
Link Copied!

Question

1 Approved Answer

O Points: 0 of 1 A data set is given below. (a) Draw a scatter diagram. Comment on the type of relation that appears to
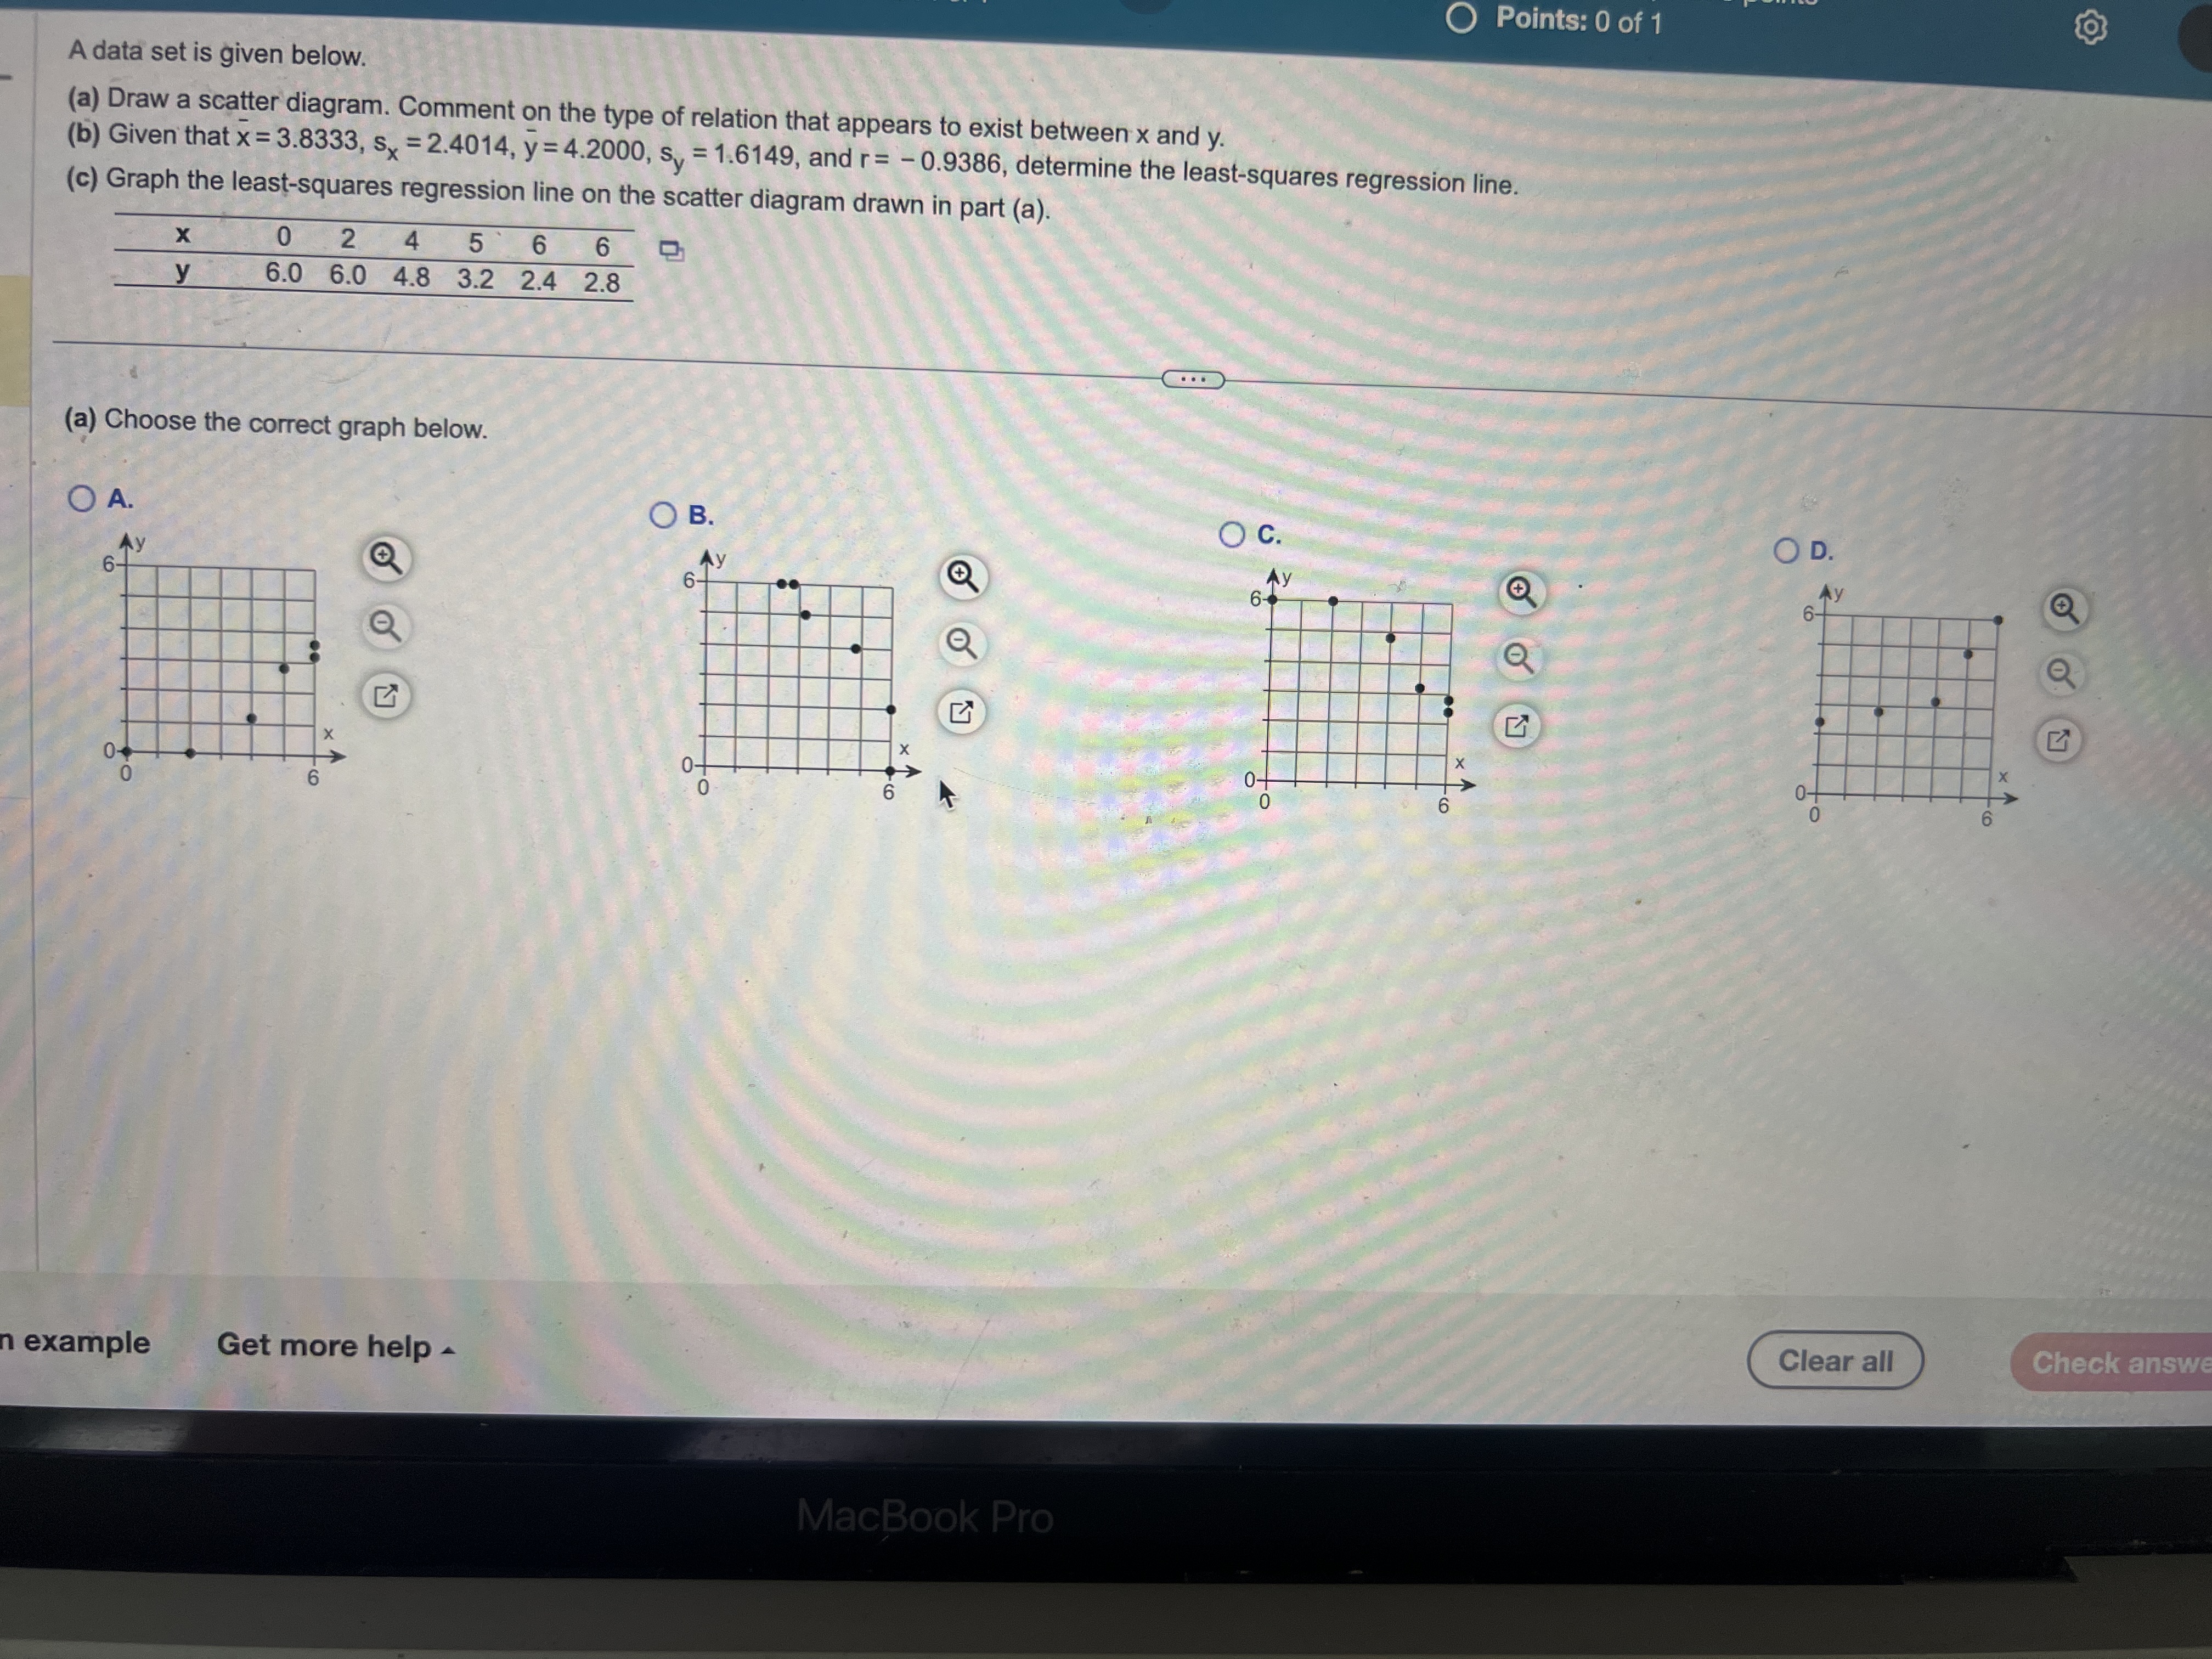
image text in transcribed
O Points: 0 of 1 A data set is given below. (a) Draw a scatter diagram. Comment on the type of relation that appears to exist between x and y. (b) Given that x = 3.8333, SX = 2.4014, y = 4.2000, sy = 1.6149, and r= - 0.9386, determine the least-squares regression line. (c) Graph the least-squares regression line on the scatter diagram drawn in part (a). X 0 2 4 6 6 y 6.0 6.0 4.8 3.2 2.4 2.8 (a) Choose the correct graph below. O A. O B. O C. O D. 67 6 Ay 1 x 6 Clear all Check answe n example Get more help MacBook Pro

Step by Step Solution

There are 3 Steps involved in it

Step: 1

blur-text-image

Get Instant Access to Expert-Tailored Solutions

See step-by-step solutions with expert insights and AI powered tools for academic success

Step: 2

blur-text-image_2

Step: 3

blur-text-image_3

Ace Your Homework with AI

Get the answers you need in no time with our AI-driven, step-by-step assistance

Get Started

Recommended Textbook for

Mathematical Applications for the Management Life and Social Sciences

Authors: Ronald J. Harshbarger, James J. Reynolds

11th edition

9781337032247, 9781305465183, 1305108043, 1337032247, 1305465180, 978-1305108042

More Books

Students also viewed these Mathematics questions

Question

Why is the cost indicated?

Answered: 1 week ago