Answered step by step
Verified Expert Solution
Link Copied!

Question

1 Approved Answer

O The graph to the right shows the number of cities with certain average annual rainfall amounts (in inches). Identify the level of measurement of
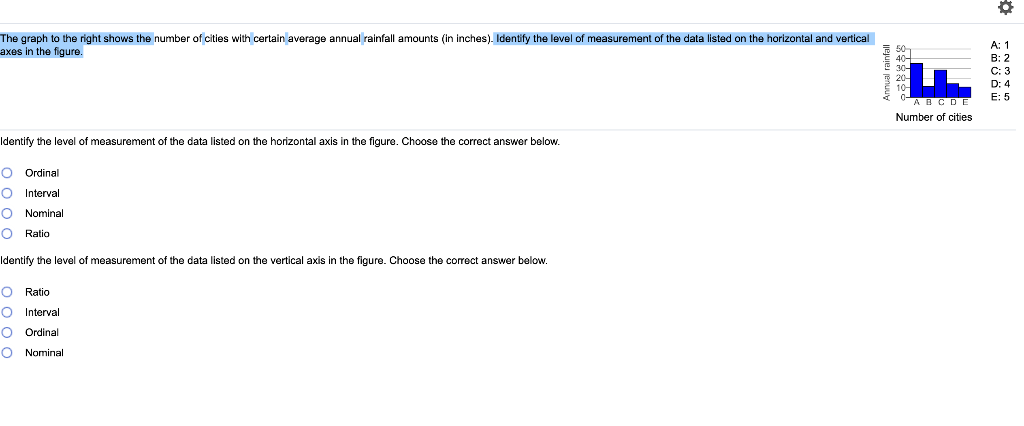
image text in transcribed

O The graph to the right shows the number of cities with certain average annual rainfall amounts (in inches). Identify the level of measurement of the data listed on the horizontal and vertical axes in the figure. Annual rainfall A: 1 B: 2 C: 3 D: 4 E: 5 ABCDT Number of cities Identify the level of measurement of the data listed on the horizontal axis in the figure. Choose the correct answer below. O Ordinal O Interval O Nominal O Ratio Identify the level of measurement of the data listed on the vertical axis in the figure. Choose the correct answer below. O Ratio O interval O Ordinal O Nominal

Step by Step Solution

There are 3 Steps involved in it

Step: 1

blur-text-image

Get Instant Access to Expert-Tailored Solutions

See step-by-step solutions with expert insights and AI powered tools for academic success

Step: 2

blur-text-image

Step: 3

blur-text-image

Ace Your Homework with AI

Get the answers you need in no time with our AI-driven, step-by-step assistance

Get Started

Recommended Textbook for

Electronic Waste An Actual Gold And Silver Mine

Authors: Antonio Alcivar

1st Edition

979-8367641059

More Books

Students also viewed these Finance questions

Question

4-22. Glen monopolizes every meeting by being (a loudmouth)?

Answered: 1 week ago

Question

4-21. Jim Riley is too (incompetent) for that kind of promotion.

Answered: 1 week ago