Answered step by step
Verified Expert Solution
Link Copied!

Question

1 Approved Answer

o. This step is to provide you with practice in graphing and in presenting data. Table o lists inductance data for 16 different coils wound
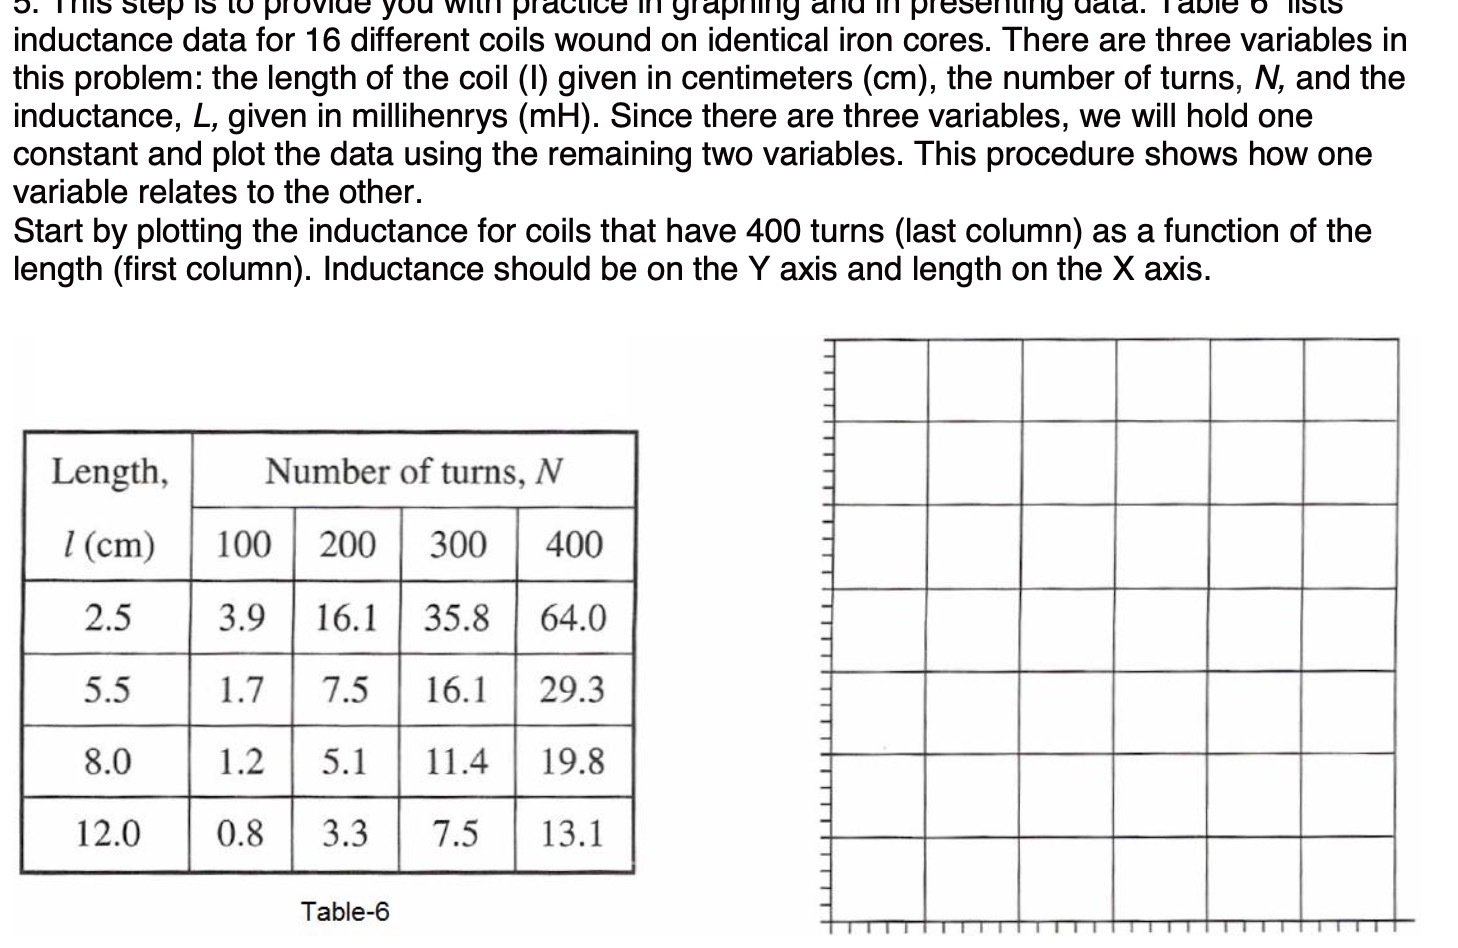
image text in transcribed
o. This step is to provide you with practice in graphing and in presenting data. Table o lists inductance data for 16 different coils wound on identical iron cores. There are three variables in this problem: the length of the coil (1) given in centimeters (cm), the number of turns, N, and the inductance, L, given in millihenrys (mH). Since there are three variables, we will hold one constant and plot the data using the remaining two variables. This procedure shows how one variable relates to the other. Start by plotting the inductance for coils that have 400 turns (last column) as a function of the length (first column). Inductance should be on the Y axis and length on the X axis. Length, Number of turns, N I (cm) 100 200 300 400 2.5 3.9 16.1 35.8 64.0 5.5 1.7 7.5 16.1 29.3 8.0 1.2 5.1 11.4 19.8 12.0 0.8 3.3 7.5 13.1 Table-6

Step by Step Solution

There are 3 Steps involved in it

Step: 1

blur-text-image

Get Instant Access to Expert-Tailored Solutions

See step-by-step solutions with expert insights and AI powered tools for academic success

Step: 2

blur-text-image_2

Step: 3

blur-text-image_3

Ace Your Homework with AI

Get the answers you need in no time with our AI-driven, step-by-step assistance

Get Started

Recommended Textbook for

Modeling the Dynamics of Life Calculus and Probability for Life Scientists

Authors: Frederick R. Adler

3rd edition

840064187, 978-1285225975, 128522597X, 978-0840064189

More Books

Students also viewed these Mathematics questions

Question

=+b. Why is it so difficult to design a fair tax structure?

Answered: 1 week ago