

Answered step by step
Verified Expert Solution
Question
1 Approved Answer
oc Ch 13 Ratios US Edit View Help Search AutoSave On R 9 File Home Insert px Cut Copy Paste Format Painter Clipboard Page Layout
oc
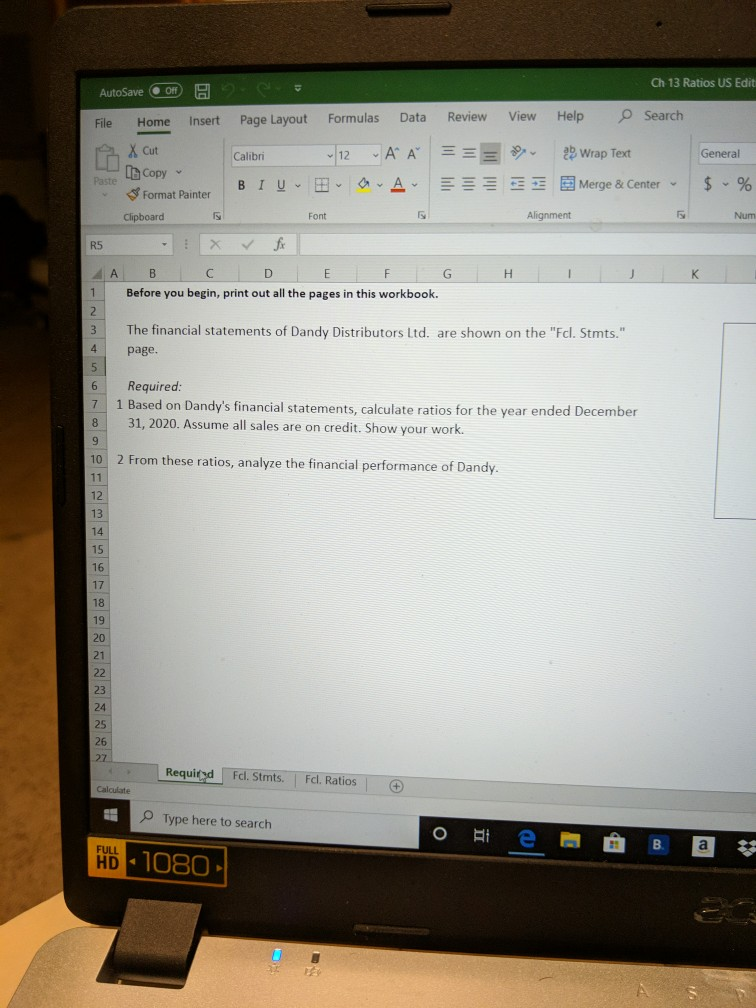
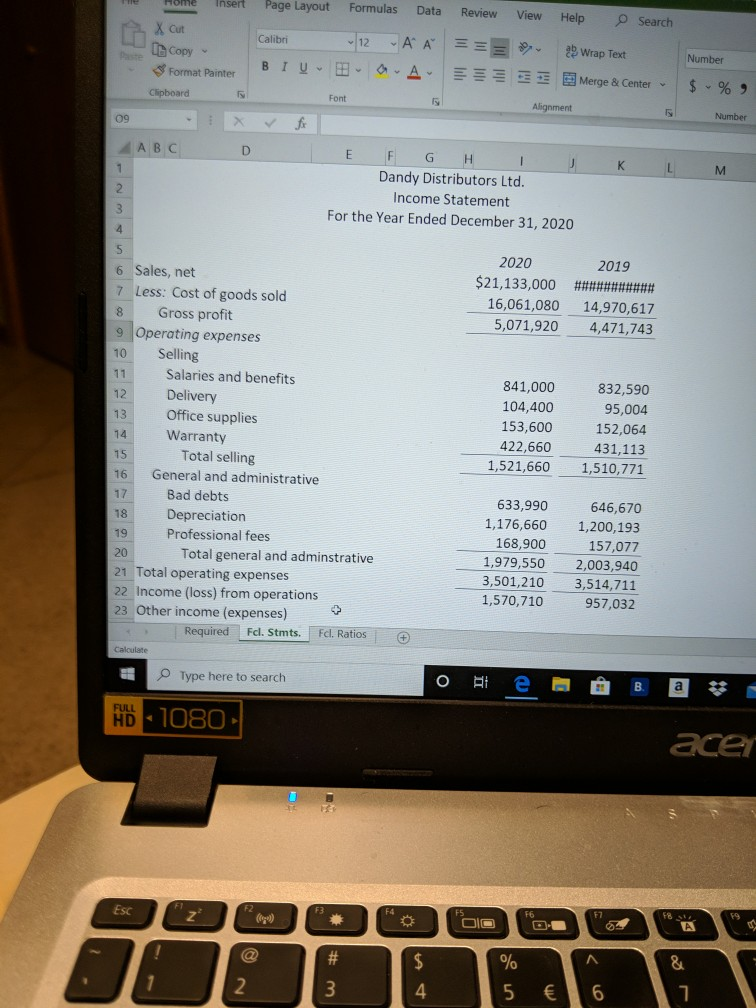
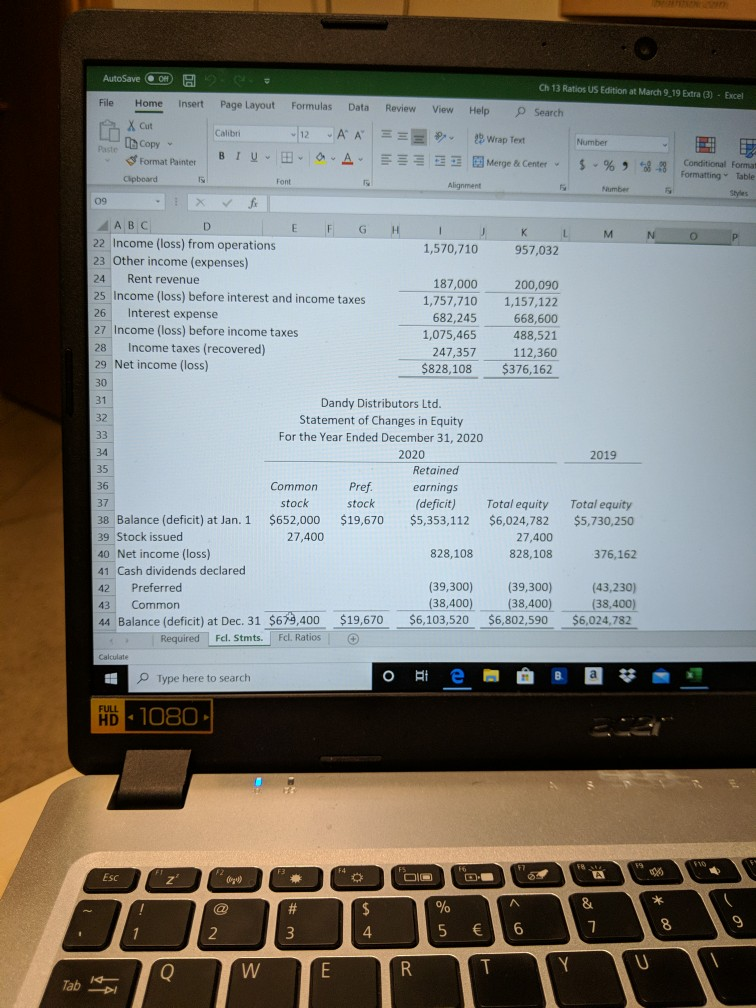
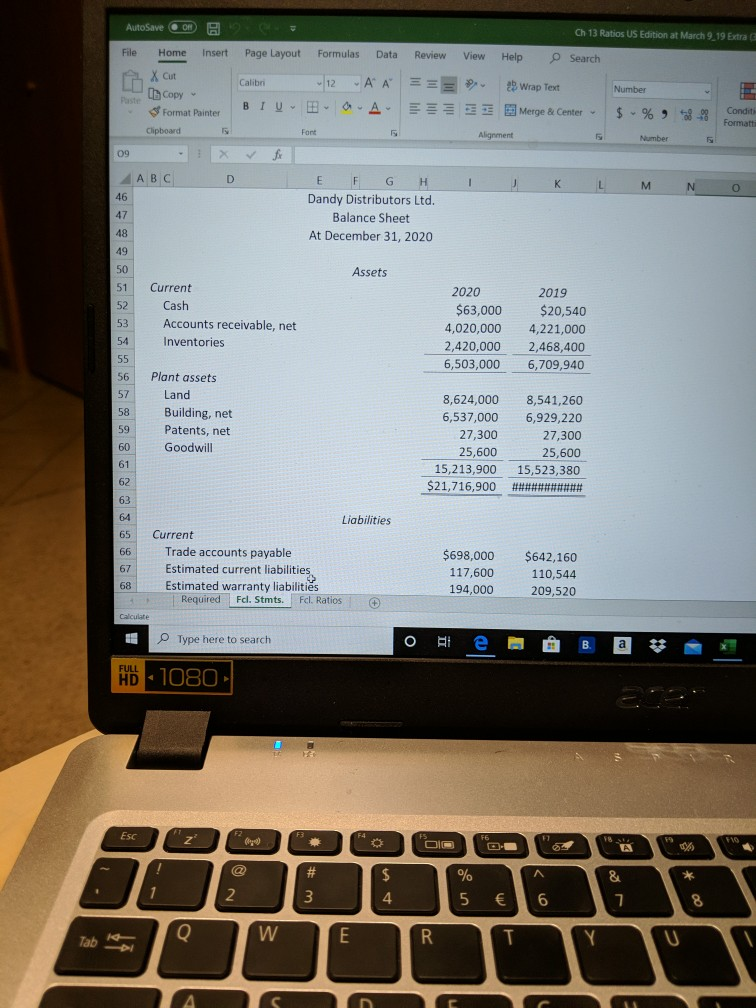
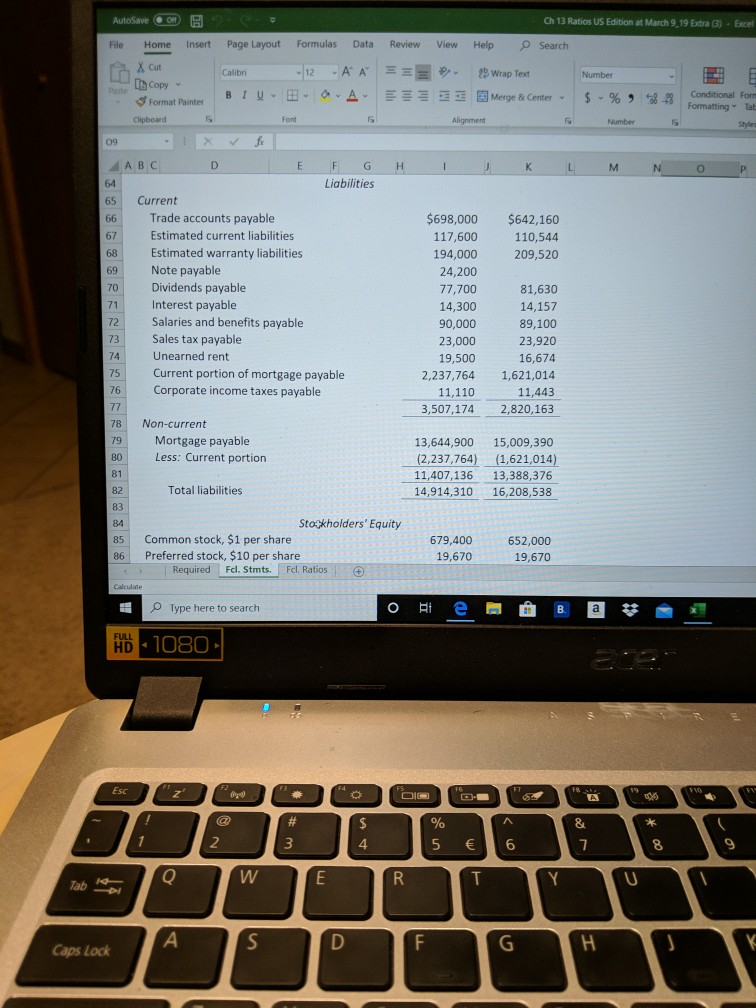
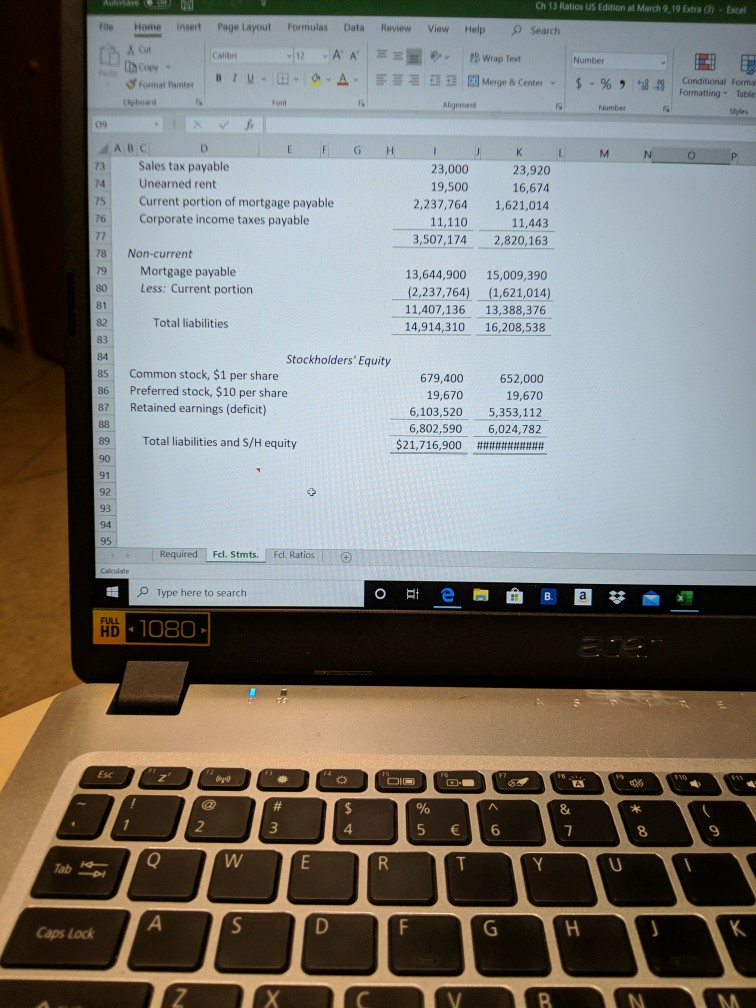
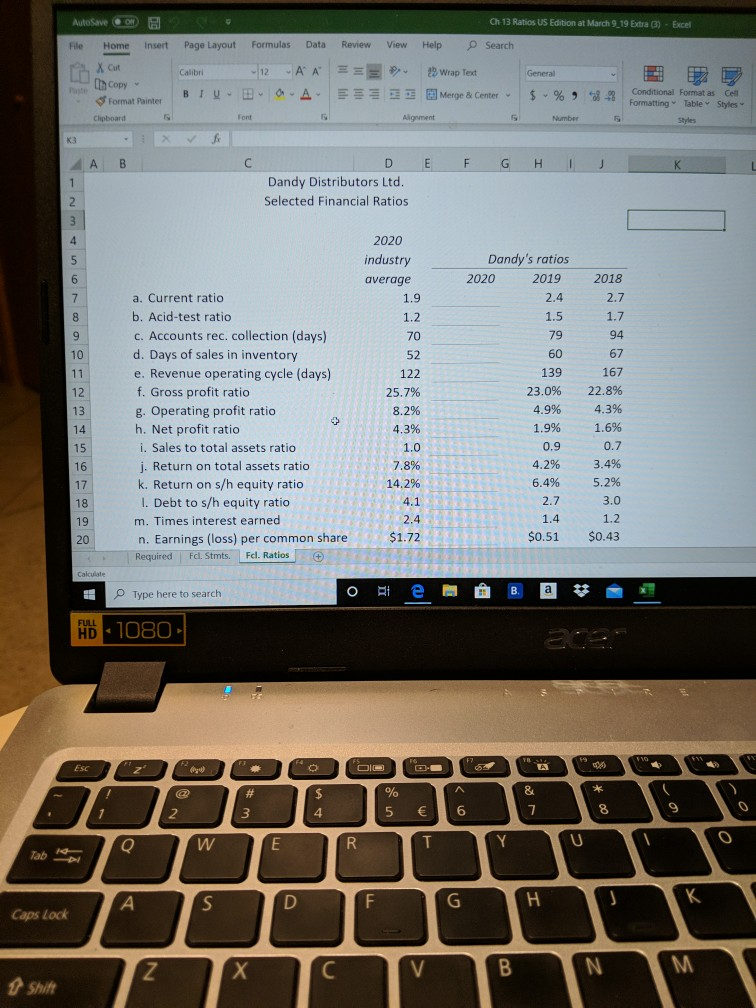
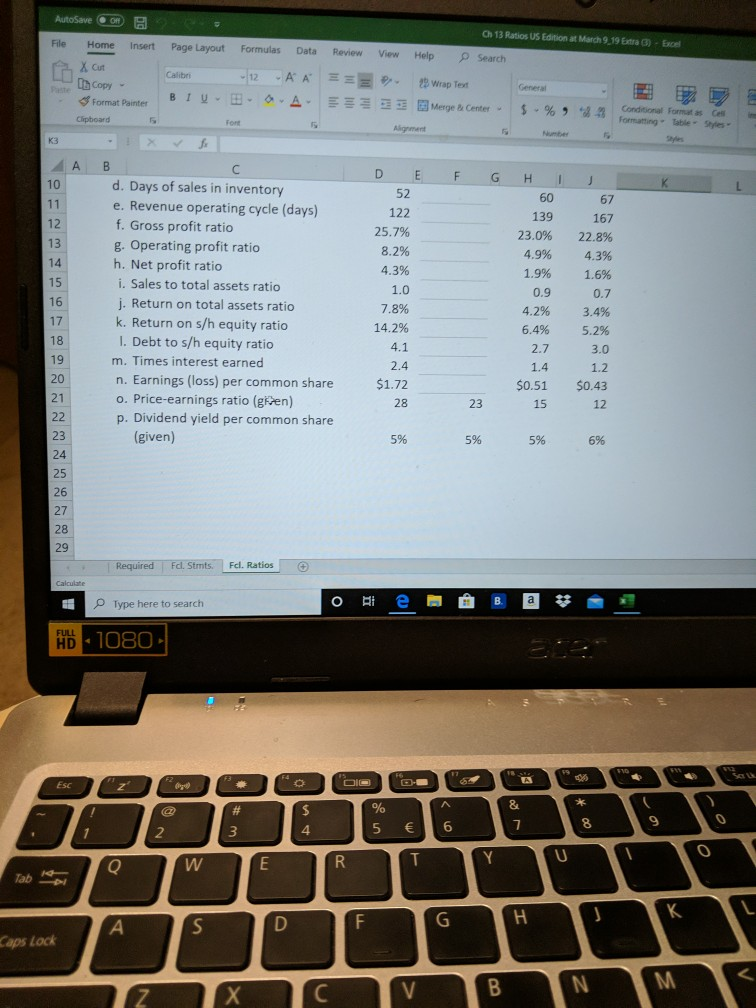
Ch 13 Ratios US Edit View Help Search AutoSave On R 9 File Home Insert px Cut Copy Paste Format Painter Clipboard Page Layout Calibri BIU - Formulas Data Review 12 - A === A Wrap Text Merge & Center General $ - % Font Alignment Num A H I J K B C D E F G Before you begin, print out all the pages in this workbook. w The financial statements of Dandy Distributors Ltd. are shown on the "Fcl. Stmts." page. A 7 Required: 1 Based on Dandy's financial statements, calculate ratios for the year ended December 31, 2020. Assume all sales are on credit. Show your work. 8 10 2 From these ratios, analyze the financial performance of Dandy. Requird Fel. Stmts. Fd. Ratios Calculate Type here to search HD 1080, Page Layout Formulas Data Review View Help Search HU Home Insert A Xcut Lycopy Format Painter Clipboard Calibri 12 O = BIU- AA A 25 Wrap Text Merge & Center - Alignment 5 Font Number $ % Number - A B C D K L M Uw - E F G H I Dandy Distributors Ltd. Income Statement For the Year Ended December 31, 2020 2020 $21,133,000 16,061,080 5,071,920 2019 ########### 14,970,617 4,471,743 6 Sales, net 7 Less: Cost of goods sold 8 Gross profit 9 Operating expenses 10 Selling Salaries and benefits Delivery Office supplies Warranty Total selling General and administrative Bad debts Depreciation Professional fees 20 Total general and adminstrative 21 Total operating expenses 22 Income (loss) from operations 23 Other income (expenses) - Required Fcl. Stmts. Fel. Ratios Calculate Type here to search 841,000 104,400 153,600 422,660 1,521,660 832,590 95,004 152,064 431,113 1,510,771 633,990 646,670 1,176,660 1,200,193 168,900 157,077 1,979,550 2,003,940 3,501,2103,514,711 1,570,710 957,032 o B e B a I HD 1080 acer Ch 13 Ratios US Edition at March 9,19 Extra (3) - Excel AutoSave Om File Home 3 X aut Insert View - Page Layout Formulas Data Calibri 12 A A BTU - OA E Font Review == Luan Help Search 2 Wrap Text Merge de Center - Number Paste Copy $ -% 98-98 Clipboard Conditional Format Formatting Table Styles Alignment H I J 1,570,710 K L 957,032 M N o . ABC D E F G 22 Income (loss) from operations 23 Other income (expenses) 24 Rent revenue 25 Income (loss) before interest and income taxes 26 Interest expense 27 Income (loss) before income taxes 28 Income taxes (recovered) 29 Net income (loss) 187,000 1,757,710 682,245 1,075,465 247,357 $828,108 200,090 1,157,122 668,600 488,521 112,360 $376,162 2019 Total equity $5,730,250 Dandy Distributors Ltd. Statement of Changes in Equity For the Year Ended December 31, 2020 2020 Retained Common Pref. earnings stock stock (deficit) Total equity 38 Balance (deficit) at Jan. 1 $652,000 $19,670 $5,353,112 $6,024,782 39 Stock issued 27,400 27,400 40 Net income (loss) 828,108 828,108 41 Cash dividends declared 42 Preferred (39,300) (39,300) 43 Common (38,400) (38,400) 44 Balance (deficit) at Dec 31 $679,400 $19,670 $6,103,520 $6,802,590 Required Fcl. Stmts. Fl. Ratios Calculate Type here to search 376,162 (43,230) (38,400) $6,024,782 HD-1080. O2000 Ch 13 Ratios US Edition at March 9,19 Extra AutoSave On File Home Insert Xan 0 Copy - Format Painter Clipboard Page Layout Calibri BIU-B Formulas 12 A O A Data A Review 2= E View Help Search 2 Wrap Text Merge & Center - Alignment 5 Number $ -% -98 Formatt Fort Number LABCD I J K L M N O E F G H Dandy Distributors Ltd. Balance Sheet At December 31, 2020 Assets Current Cash Accounts receivable, net Inventories 2020 $63,000 4,020,000 2,420,000 6,503,000 2019 $20,540 4,221,000 2,468,400 6,709,940 Plant assets Land Building, net Patents, net Goodwill 8,624,000 6,537,000 27,300 25,600 15,213,900 $21,716,900 8,541,260 6,929,220 27,300 25,600 15,523,380 ######### Liabilities Current Trade accounts payable Estimated current liabilities Estimated warranty liabilities Required Fcl. Stmts. Fol. Ratios $698,000 117,600 194,000 $642,160 110,544 209,520 Calculate Type here to search ote B a * HD-1080- AutoSave on = Page Layout Ch 13 Ratios US Edition at March 9,19 Extra 3) - Excel Search Formulas Data Review View Help File Home Insert Rx Cut Copy Format Painter Clipboard Calibri BIU-B 12 O AA A == E Wrap Text Merge & Center - $ - % -8 Formatting Ta Alignment Number 5 H I K L M N O P $642,160 110,544 209,520 A B C D E F G Liabilities Current Trade accounts payable Estimated current liabilities Estimated warranty liabilities Note payable Dividends payable Interest payable Salaries and benefits payable Sales tax payable Unearned rent Current portion of mortgage payable Corporate income taxes payable $698,000 117,600 194,000 24,200 77,700 14,300 90,000 23,000 19,500 2,237,764 11,110 3,507,174 81,630 14,157 89,100 23,920 16,674 1,621,014 11,443 2,820,163 Non-current Mortgage payable Less: Current portion 13,644,900 (2,237,764) 11,407,136 14,914,310 15,009,390 (1,621,014) 13,388,376 16,208,538 Total liabilities 85 86 Stockholders' Equity Common stock, $1 per share Preferred stock, $10 per share Required Fd. Stmts. F. Ratios 679,400 19,670 652,000 19,670 Type here to search ote Ba HD 1080 0 . 00 OOM " " 5 W Tab Caps Lock Ch 13 Katios US Edition at March 9,19 Extra (3) - Excel Home Insert Page Layout X Formulas Data 12 AA A Review = FE ViewHelp Search Wrap Test E Merge Center Number wy # ! - Formatter $ % *8 Conditional Forme Formatting Table Alignment Number L M N O P ABC D Sales tax payable Unearned rent Current portion of mortgage payable Corporate income taxes payable I 23,000 19,500 2,237,764 11,110 3,507,174 23,920 16,674 1,621,014 11,443 2,820,163 Non-current Mortgage payable Less: Current portion 13,644,900 (2,237,764) 11,407,136 14,914,310 15,009,390 (1,621,014) 13,388,376 16,208,538 Total liabilities Stockholders' Equity Common stock, $1 per share Preferred stock, $10 per share Retained earnings (deficit) 86 87 679,400 19,670 6,103,520 6,802,590 $21,716,900 652,000 19,670 5,353,112 6,024,782 #et Total liabilities and S/H equity Required Fel. Stmts. F. Ratios Calculate Type here to search HD-1080 52 0000000000 Taboo Caps Lock Ch 13 Ratios US Edition at March 9,19 Extra) - Excel Page Layout Formulas Data Review View Help Search AutoSave A File Home Insert M Xan th Copy - Format Painter Clipboard Calibri 12 A A == General 2 Wrap Test Mare Center Merge & Center - S E $ 0 % ) , *58-8 99 Conditional Format as Cell Formatting Table Styles Font Alignment Number 5 AB E F G H I K L D Dandy Distributors Ltd. Selected Financial Ratios 2020 industry average Dandy's ratios 2020 2019 2018 1.9 2.4 1.2 1.5 122 167 22.8% 00 a. Current ratio b. Acid-test ratio c. Accounts rec. collection (days) d. Days of sales in inventory e. Revenue operating cycle (days) f. Gross profit ratio g. Operating profit ratio h. Net profit ratio i. Sales to total assets ratio j. Return on total assets ratio k. Return on s/h equity ratio I. Debt to s/h equity ratio m. Times interest earned n. Earnings (loss) per common share Required Fcl. Stmts. Fel. Ratios + o 139 23.0% 4.9% 1.9% 0.9 4.2% 6.4% 2.7 1.4 $0.51 de 4.3% 1.6% 0.7 3.4% 5.2% 3.0 1.2 $0.43 14.2% 2.4 $1.72 Calculate Type here to search O RA e B a HD 1080 Tab the you Shift Os 13 Ratios US Edition at March 9,19 Extra G) - Excel AutoSave on File Home Insert rxar Copy - Format Painter Clipboard = Page Layout Calibre BIU-B Formulas Data 12 AA O A Review == View Help Search ? Wrap Test Merge Center - Alignment General $ % Font Formatting Table Syles E F G AB d. Days of sales in inventory e. Revenue operating cycle (days) f. Gross profit ratio g. Operating profit ratio h. Net profit ratio i. Sales to total assets ratio j. Return on total assets ratio k. Return on s/h equity ratio I. Debt to s/h equity ratio m. Times interest earned n. Earnings (loss) per common share o. Price-earnings ratio (giten) p. Dividend yield per common share (given) D 52 122 25.7% 8.2% 4.3% 1.0 7.8% 14.2% 4.1 2.4 $1.72 28 H I 6067 139 167 23.0% 22.8% 4.9% 4.3% 1.9% 1.6% 0.9 0.7 4.2% 3.4% 6.4% 5.2% 2.7 3.0 1.4 1.2 $0.43 15 12 $0.51 - 23 5% 5% 5% 6% Required Fcl. Stmts. Fl. Ratios Calculate Type here to search HD 1080 Caps Lock ONCVBNM
Step by Step Solution
There are 3 Steps involved in it
Step: 1

Get Instant Access to Expert-Tailored Solutions
See step-by-step solutions with expert insights and AI powered tools for academic success
Step: 2

Step: 3
Ace Your Homework with AI
Get the answers you need in no time with our AI-driven, step-by-step assistance
Get Started
Sound Investing, Chapter 10 - One-Time Charges And Other Format Fakes
Authors: Kate Mooney
2nd Edition
0071719326, 9780071719322