

Answered step by step
Verified Expert Solution
Question
1 Approved Answer
of 20 securities were held in the portfolio. After each security was added, David calculated the portfolio standard deviation, rp. The calculated values are shown
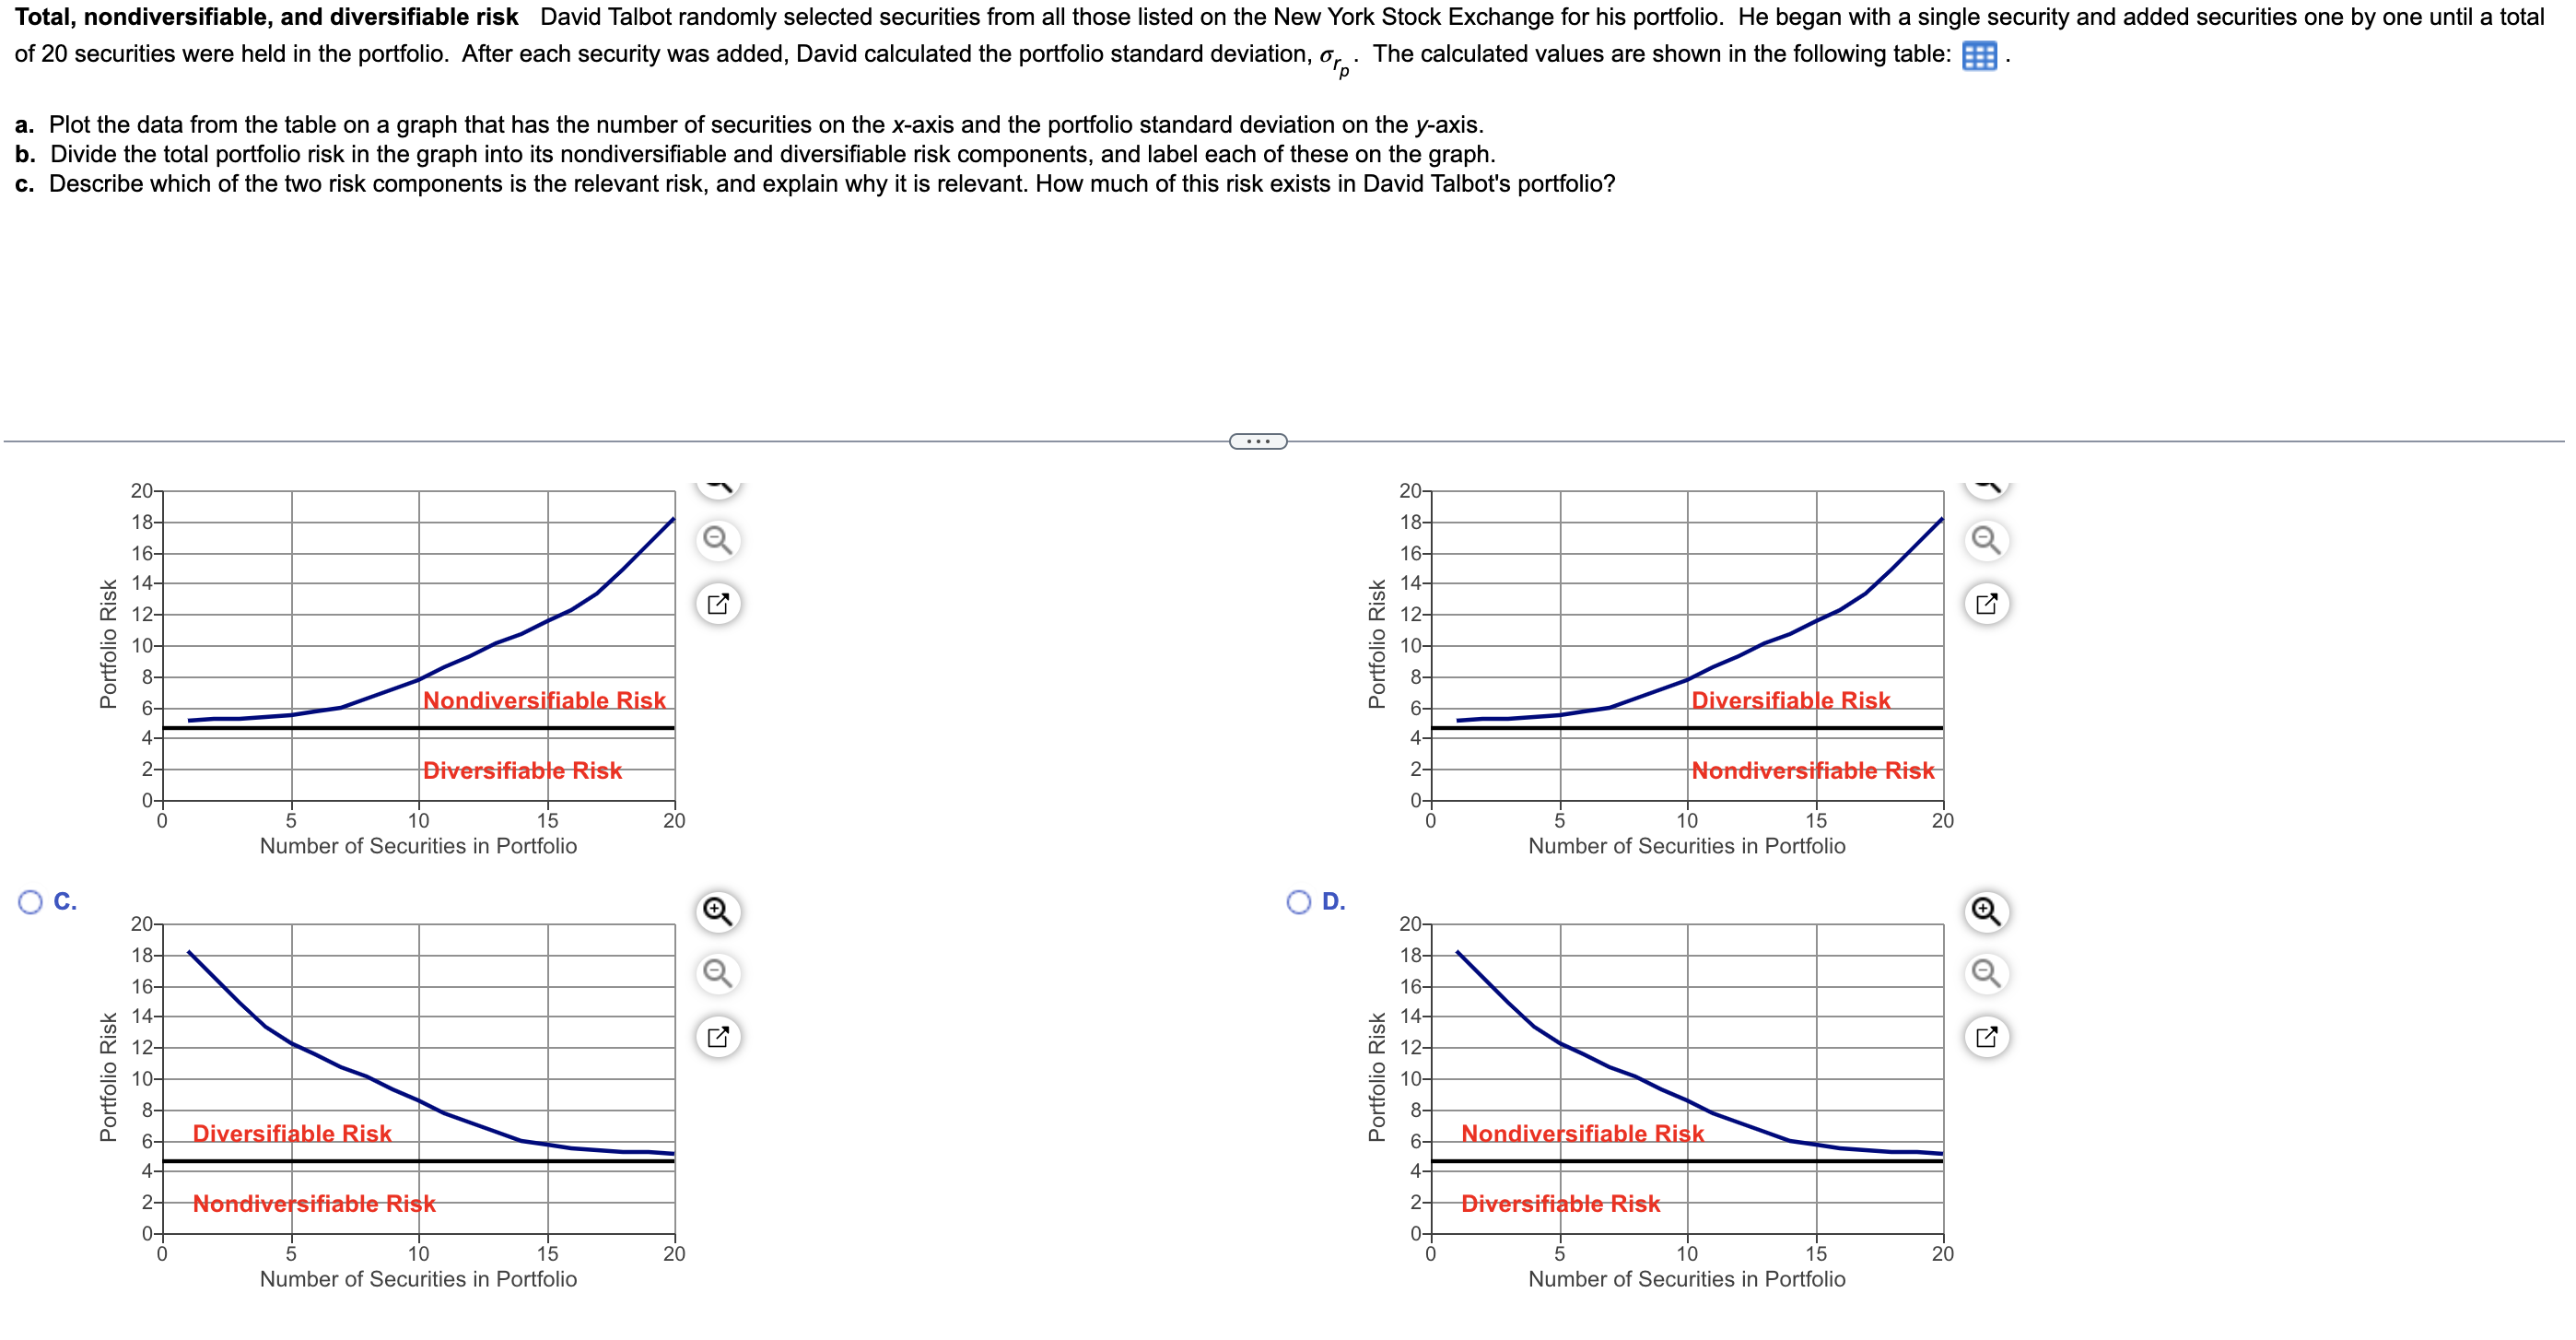
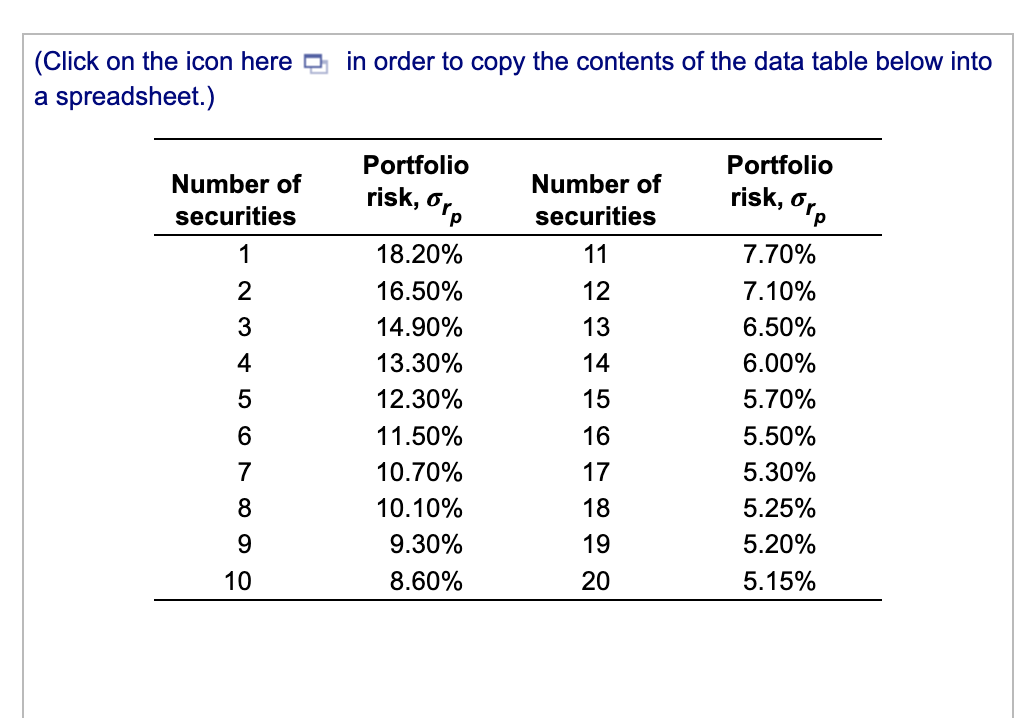 of 20 securities were held in the portfolio. After each security was added, David calculated the portfolio standard deviation, rp. The calculated values are shown in the following table: a. Plot the data from the table on a graph that has the number of securities on the x-axis and the portfolio standard deviation on the y-axis. b. Divide the total portfolio risk in the graph into its nondiversifiable and diversifiable risk components, and label each of these on the graph. c. Describe which of the two risk components is the relevant risk, and explain why it is relevant. How much of this risk exists in David Talbot's portfolio? (Click on the icon here in order to copy the contents of the data table below into a spreadsheet.)
 Step by Step Solution
There are 3 Steps involved in it
Step: 1

Get Instant Access to Expert-Tailored Solutions
See step-by-step solutions with expert insights and AI powered tools for academic success
Step: 2

Step: 3
Ace Your Homework with AI
Get the answers you need in no time with our AI-driven, step-by-step assistance
Get Started
A Handbook Of Mutual Fund Investing
Authors: Barry G Dolgin
1st Edition
1456489704, 978-1456489700