

Answered step by step
Verified Expert Solution
Question
1 Approved Answer
okay. yoh can answer the first 2 vity: Interest rate premiums - Video Excel Online Structured Activity: Interest rate premiums A 5-year Treasury bond has
okay. yoh can answer the first 2
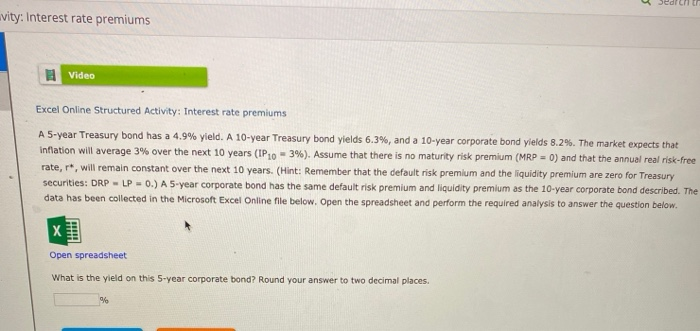
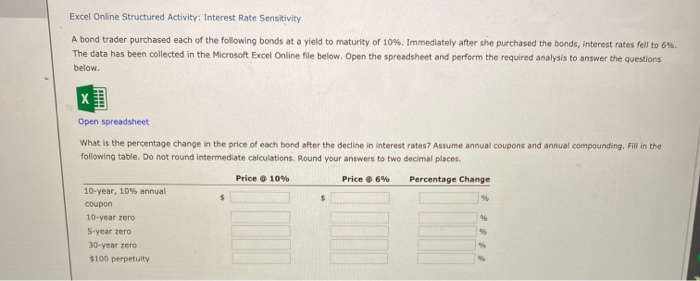
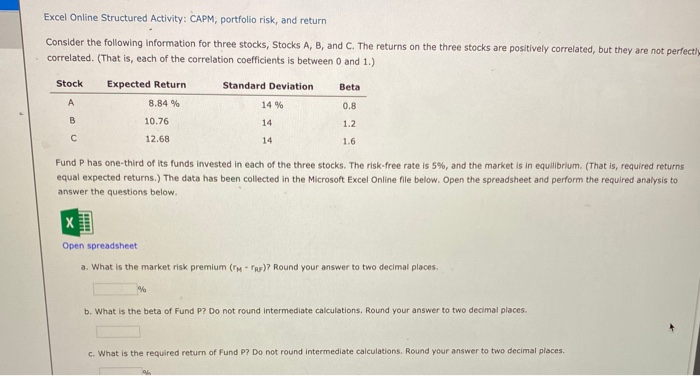
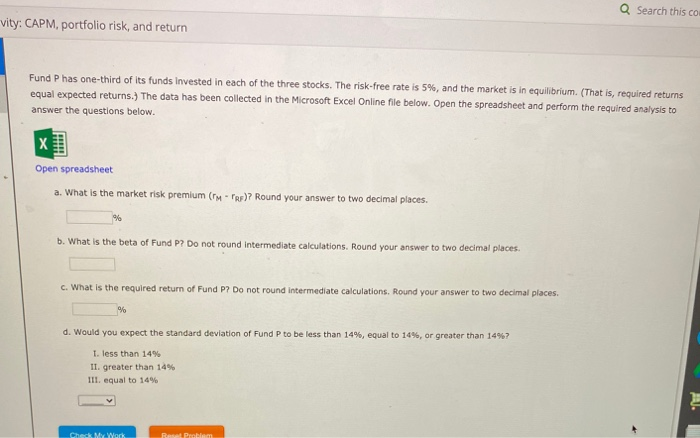
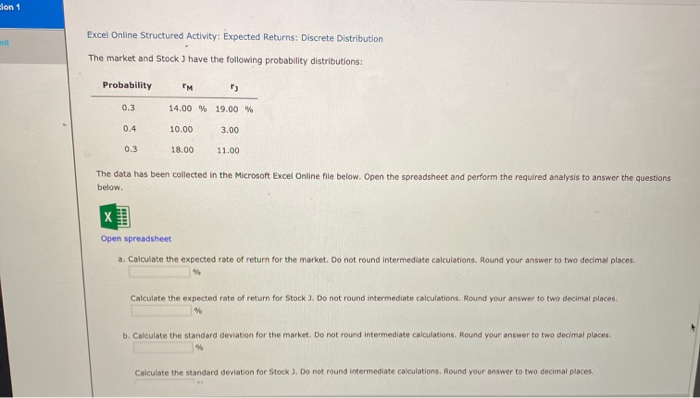
vity: Interest rate premiums - Video Excel Online Structured Activity: Interest rate premiums A 5-year Treasury bond has a 4.9% yield. A 10-year Treasury bond yields 6.3%, and a 10-year corporate bond yields 8.2%. The market expects that inflation will average 3% over the next 10 years (IP20 - 3%). Assume that there is no maturity risk premium (MRP = 0) and that the annual real risk-free rate, r*, will remain constant over the next 10 years. (Hint: Remember that the default risk premium and the liquidity premium are zero for Treasury securities: DRP - LP -0.) A 5-year corporate bond has the same default risk premium and liquidity premium as the 10-year corporate bond described. The data has been collected in the Microsoft Excel Online file below. Open the spreadsheet and perform the required analysis to answer the question below. X Open spreadsheet What is the yield on this 5-year corporate bond? Round your answer to two decimal places. % Excel Online Structured Activity: Interest Rate Sensitivity A bond trader purchased each of the following bonds at a yield to maturity of 10%. Immediately after she purchased the bonds, interest rates fell to 6%. The data has been collected in the Microsoft Excel Online file below. Open the spreadsheet and perform the required analysis to answer the questions below Open spreadsheet What is the percentage change in the price of each bond after the decline in interest rates? Assume annual coupons and annual compounding, Fill in the following table. Do not round intermediate calculations. Round your answers to two decimal places. Price 10% Price 6% Percentage Change $ $ 10-year, 10% annual coupon 10-year zero 5-year zero 30-year tero $100 perpetuity Excel Online Structured Activity: CAPM, portfolio risk, and return Consider the following information for three stocks, Stocks A, B, and C. The returns on the three stocks are positively correlated, but they are not perfectly correlated. (That is, each of the correlation coefficients is between 0 and 1.) Stock Expected Return Standard Deviation Beta 0.8 A 8.84 % 14 % 14 B 1.2 10.76 12.68 14 1.6 Fund P has one-third of its funds invested in each of the three stocks. The risk-free rate is 5%, and the market is in equilibrium. (That is required returns equal expected returns.) The data has been collected in the Microsoft Excel Online file below. Open the spreadsheet and perform the required analysis to answer the questions below. X Open spreadsheet a. What is the market risk premium (RF)? Round your answer to two decimal places. b. What is the beta of Fund P? Do not round intermediate calculations. Round your answer to two decimal places. c. What is the required return of Fund P? Do not round intermediate calculations. Round your answer to two decimal places. Q Search this co vity: CAPM, portfolio risk, and return Fund P has one-third of its funds Invested in each of the three stocks. The risk-free rate is 5%, and the market is in equilibrium. (That is, required returns equal expected returns.) The data has been collected in the Microsoft Excel Online file below. Open the spreadsheet and perform the required analysis to answer the questions below. X Open spreadsheet a. What is the market risk premium (PR)? Round your answer to two decimal places. % b. What is the beta of Fund P? Do not round Intermediate calculations. Round your answer to two decimal places c. What is the required return of Fund P? Do not round intermediate calculations. Round your answer to two decimal places. d. Would you expect the standard deviation of Fund P to be less than 14%, equal to 14%, or greater than 14%? 1. less than 14% II. greater than 14% III. equal to 14% ? CherMyWork RALPeoti sion 1 Excel Online Structured Activity: Expected Returns: Discrete Distribution The market and Stock ) have the following probability distributions: Probability 0.3 14.00 % 19.00 % 0.4 10.00 3.00 0.3 18.00 11.00 The data has been collected in the Microsoft Excel Online file below. Open the spreadsheet and perform the required analysis to answer the questions below. x Open spreadsheet a. Calculate the expected rate of return for the market. Do not round intermediate calculations. Round your answer to two decimal places. Calculate the expected rate of return for Stock). Do not round intermediate calculations. Round your answer to two decimal places b. Calculate the standard deviation for the market. Do not found intermediate calculations, Round your answer to two decimal places Calculate the standard deviation for Stock ). Do not round intermediate calculations. Round your answer to two decimal places Step by Step Solution
There are 3 Steps involved in it
Step: 1

Get Instant Access to Expert-Tailored Solutions
See step-by-step solutions with expert insights and AI powered tools for academic success
Step: 2

Step: 3
Ace Your Homework with AI
Get the answers you need in no time with our AI-driven, step-by-step assistance
Get Started
Managing The Audit Function A Corporate Audit Department Procedures Guide
Authors: Michael P. Cangemi
2nd Edition
0471012556, 978-0471012559