

Answered step by step
Verified Expert Solution
Question
1 Approved Answer
Old MathJax webview 3) Complete the forecasting for a 2 month moving average, a 3 month moving average, a weighted moving average and exponential smoothing.
Old MathJax webview
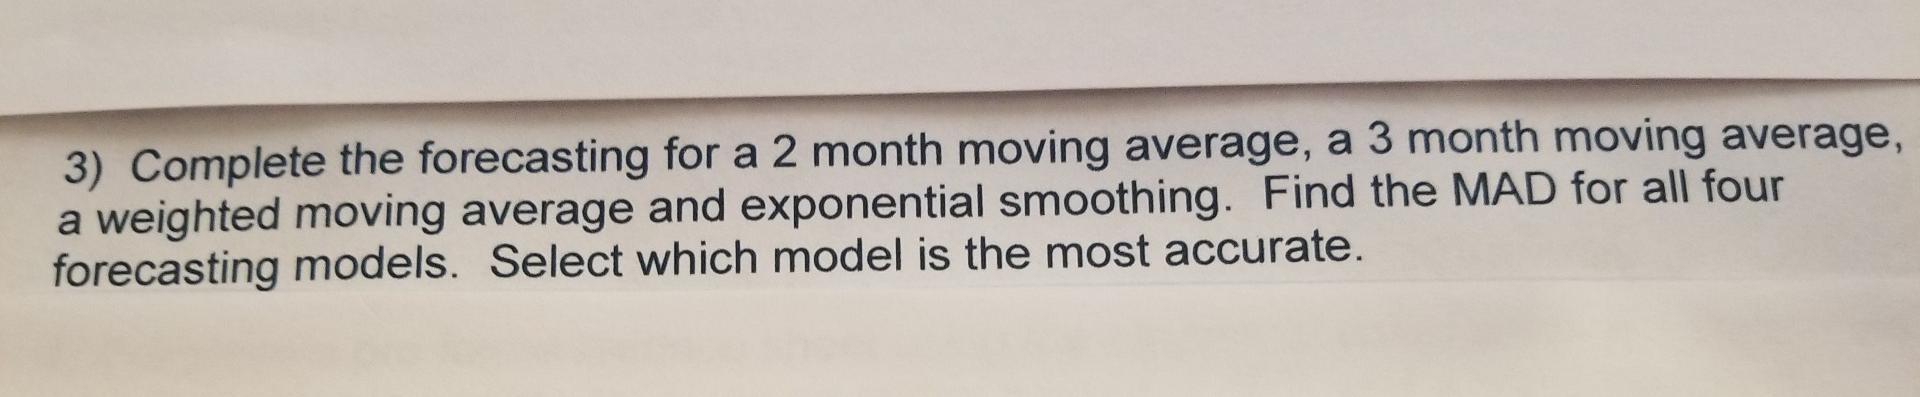
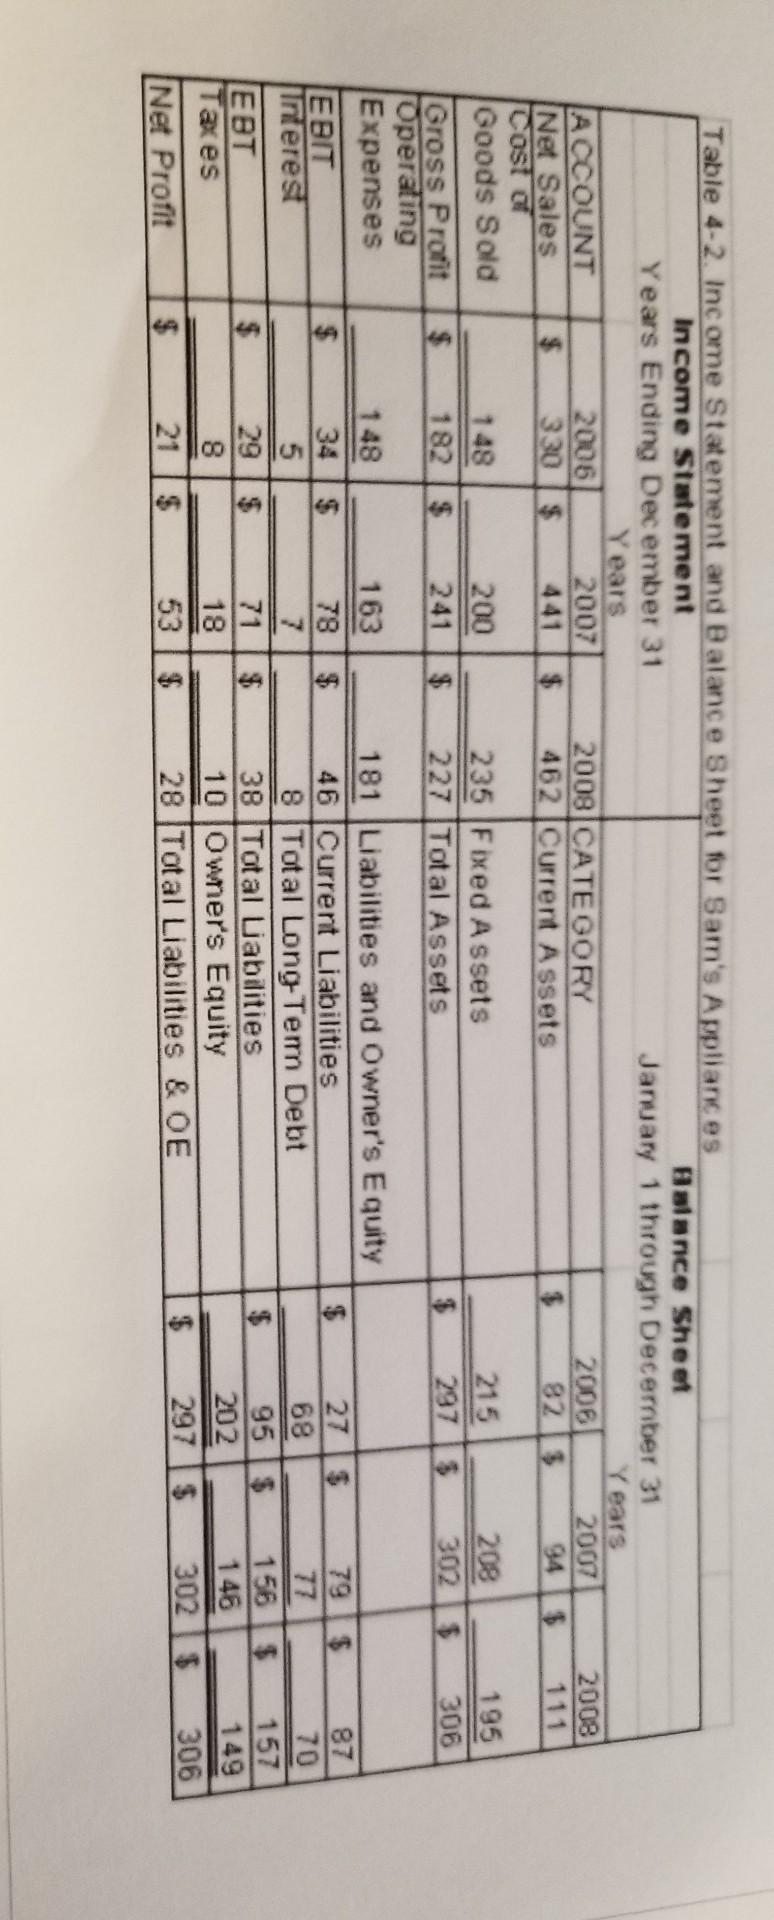
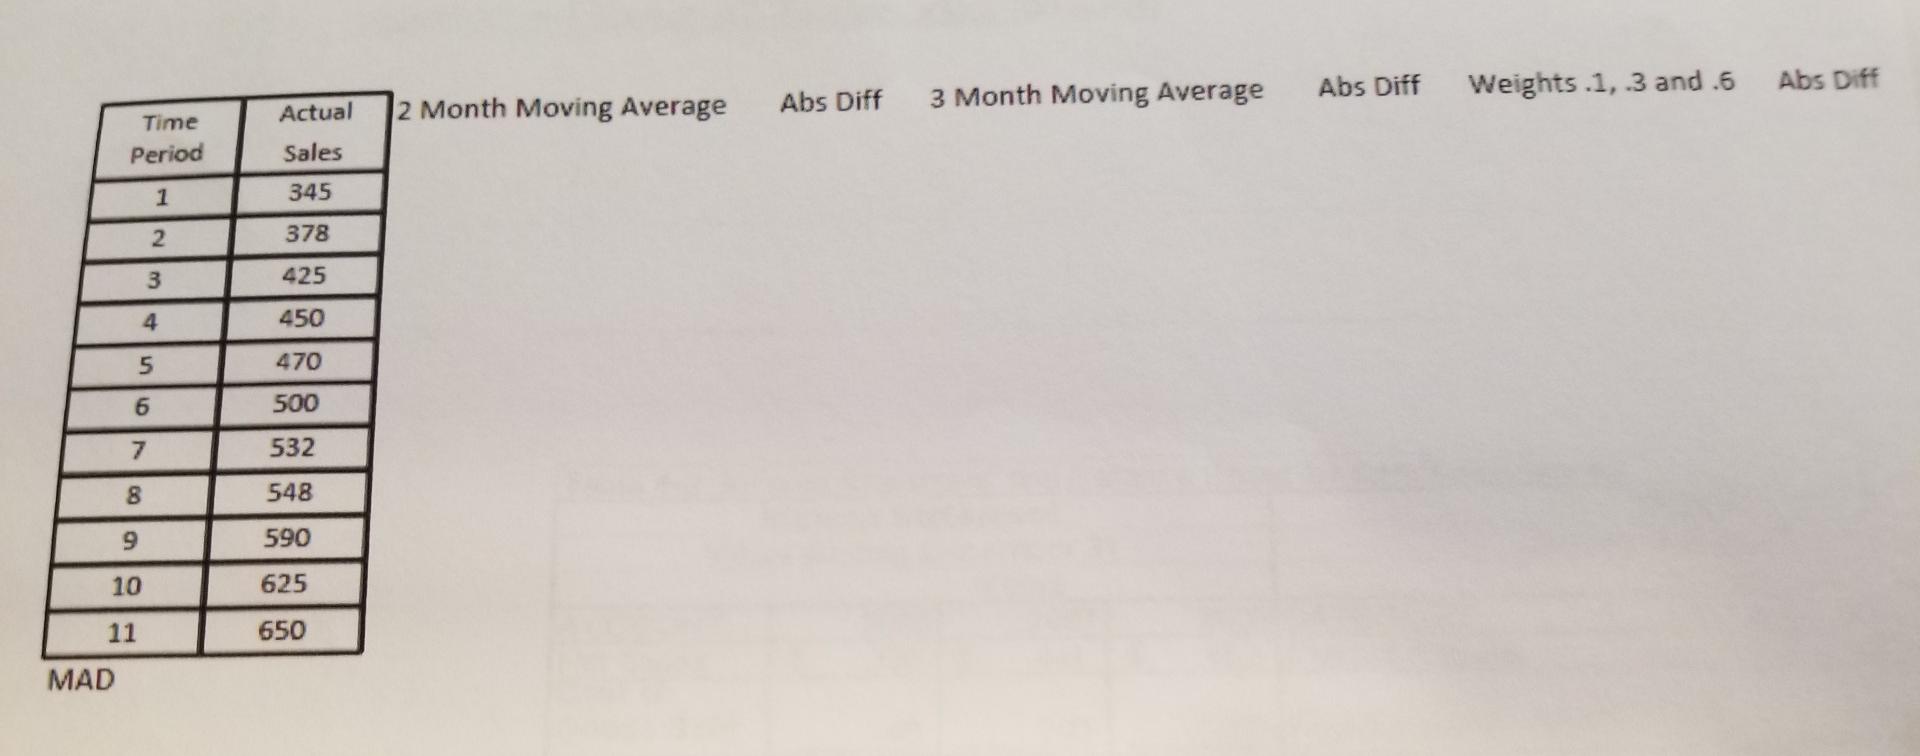
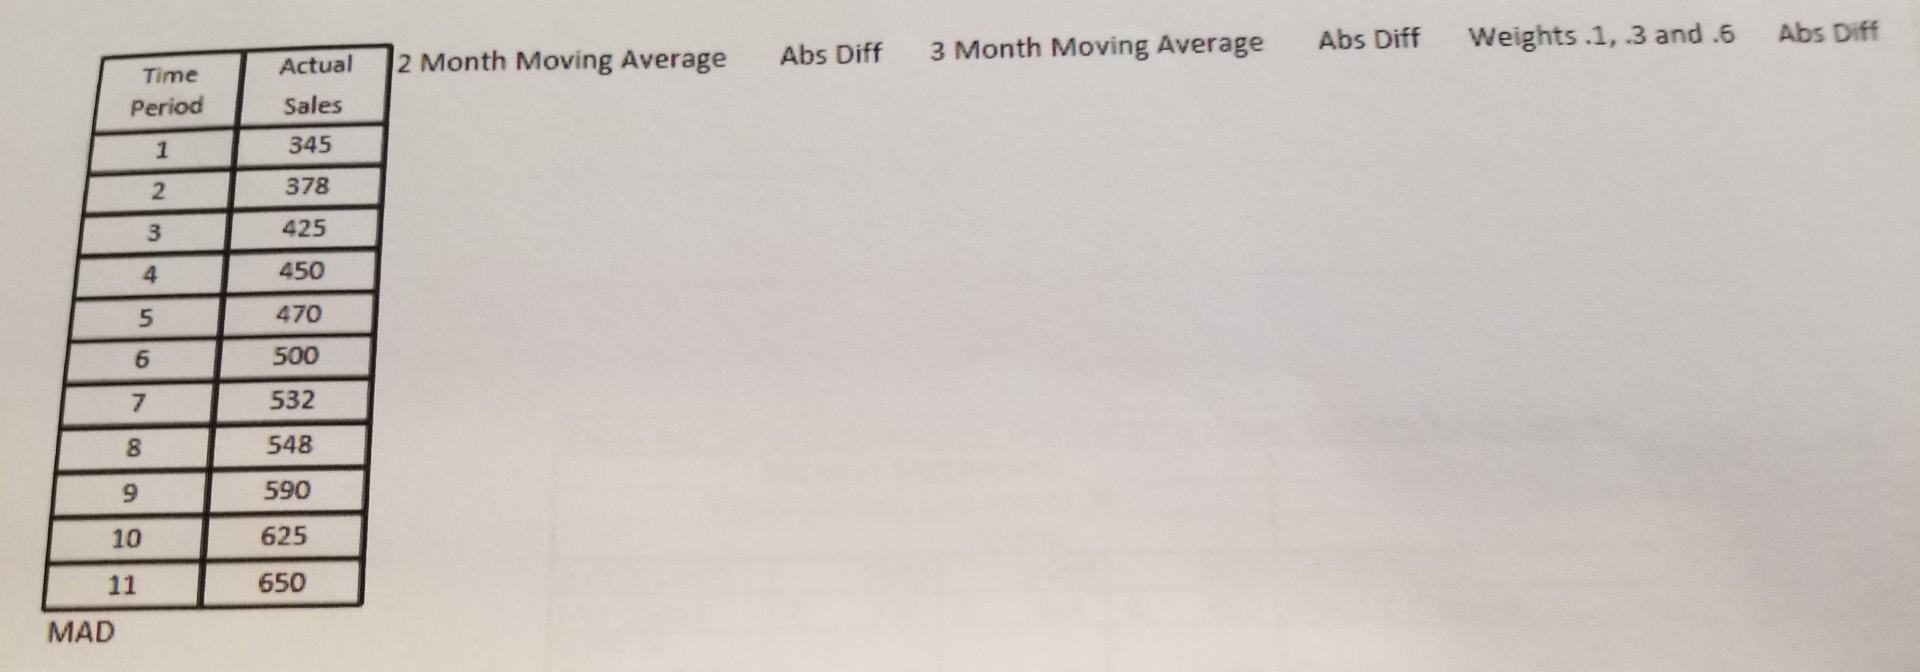
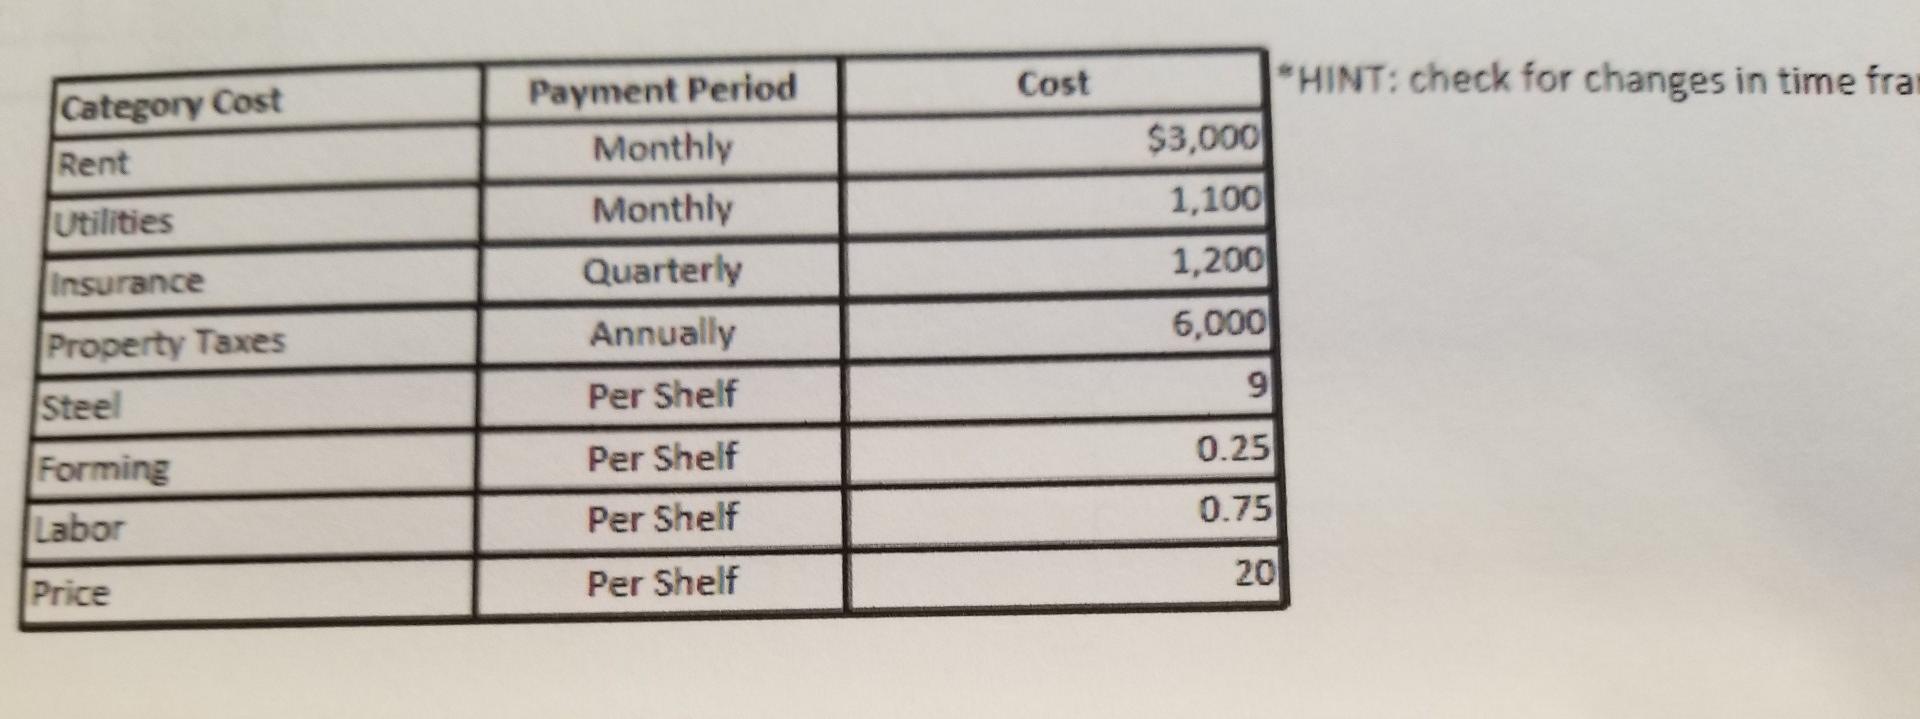
3) Complete the forecasting for a 2 month moving average, a 3 month moving average, a weighted moving average and exponential smoothing. Find the MAD for all four forecasting models. Select which model is the most accurate. Table 4-2. Income Statement and Balance Sheet for Sam's Appliances Income Statement Balance Sheet Years Ending December 31 January 1 through December 31 Years Years ACCOUNT 2006 2007 2008 CATEGORY 2006 2007 2008 Net Sales 330 $ $ 462 Current Assets $ 825 945 111 Costo Goods Sold 148 200 235 Fixed Assets 215 208 195 Gross Profit $ 182 $ 241 227 Total Assets $ 297 $ 302 $ 306 Operating Expenses 148 163 181 Liabilities and Owner's Equity EBIT $ 34 $ 78 46 Current Liabilities 27$ 79$ 87 Interest 5 7 70 68 8 Total Long Tem Debt 29 $ EBT 71 $ 38 Total Liabilities 156$ 95$ 157 146 Taxes 149 8 10 Owners Equity 202 18 $ 3026 306 Net Profit 21 $ 53 $ $ 28 Total Liabilities & OE 297 $ le |||||| Abs Diff Abs Diff 3 Month Moving Average Weights. 1, 3 and .5 2 Month Moving Average Abs Diff Time Period Actual Sales 1 345 2 378 3 425 4 450 470 500 532 548 IN 1915 590 10 625 650 MAD Abs Diff Weights.1, 3 and .6 Abs Diff 3 Month Moving Average 2 Month Moving Average Abs Diff Time Period Actual Sales 1 345 2 378 3 425 4 450 5 470 6 500 7 532 8 548 9 590 10 625 11 650 MAD Cost Category Cost Rent *HINT: check for changes in time fra $3,000 1,100 1,200 6,000 Utilities Insurance Payment Period Monthly Monthly Quarterly Annually Per Shelf Per Shelf Per Shelf Per Shelf Property Taxes Steel 9 0.25 Forming Labor 0.75 20 Price 3) Complete the forecasting for a 2 month moving average, a 3 month moving average, a weighted moving average and exponential smoothing. Find the MAD for all four forecasting models. Select which model is the most accurate. Table 4-2. Income Statement and Balance Sheet for Sam's Appliances Income Statement Balance Sheet Years Ending December 31 January 1 through December 31 Years Years ACCOUNT 2006 2007 2008 CATEGORY 2006 2007 2008 Net Sales 330 $ $ 462 Current Assets $ 825 945 111 Costo Goods Sold 148 200 235 Fixed Assets 215 208 195 Gross Profit $ 182 $ 241 227 Total Assets $ 297 $ 302 $ 306 Operating Expenses 148 163 181 Liabilities and Owner's Equity EBIT $ 34 $ 78 46 Current Liabilities 27$ 79$ 87 Interest 5 7 70 68 8 Total Long Tem Debt 29 $ EBT 71 $ 38 Total Liabilities 156$ 95$ 157 146 Taxes 149 8 10 Owners Equity 202 18 $ 3026 306 Net Profit 21 $ 53 $ $ 28 Total Liabilities & OE 297 $ le |||||| Abs Diff Abs Diff 3 Month Moving Average Weights. 1, 3 and .5 2 Month Moving Average Abs Diff Time Period Actual Sales 1 345 2 378 3 425 4 450 470 500 532 548 IN 1915 590 10 625 650 MAD Abs Diff Weights.1, 3 and .6 Abs Diff 3 Month Moving Average 2 Month Moving Average Abs Diff Time Period Actual Sales 1 345 2 378 3 425 4 450 5 470 6 500 7 532 8 548 9 590 10 625 11 650 MAD Cost Category Cost Rent *HINT: check for changes in time fra $3,000 1,100 1,200 6,000 Utilities Insurance Payment Period Monthly Monthly Quarterly Annually Per Shelf Per Shelf Per Shelf Per Shelf Property Taxes Steel 9 0.25 Forming Labor 0.75 20 Price
Step by Step Solution
There are 3 Steps involved in it
Step: 1

Get Instant Access to Expert-Tailored Solutions
See step-by-step solutions with expert insights and AI powered tools for academic success
Step: 2

Step: 3
Ace Your Homework with AI
Get the answers you need in no time with our AI-driven, step-by-step assistance
Get Started
Reinventing The CFO How Financial Managers Can Transform Their Roles And Add Greater Value
Authors: Jeremy Hope
1st Edition
1591399459, 978-1591399452