

Answered step by step
Verified Expert Solution
Question
1 Approved Answer
Old MathJax webview 6 The National Detergent Company SAOG Statement of financial position as at 31 December 2020 Notes 2020 RO 2019 RO Assets Non-current
Old MathJax webview
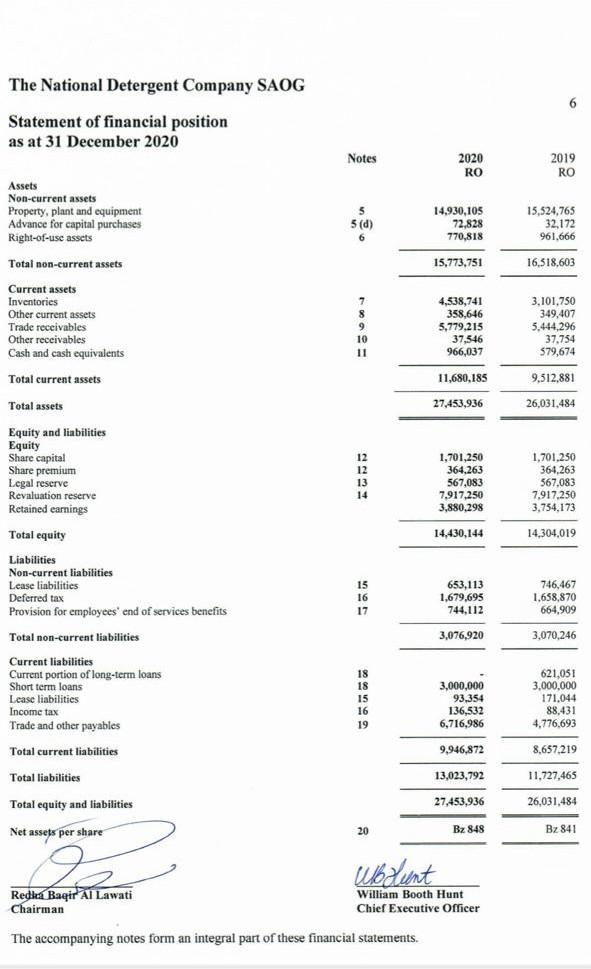
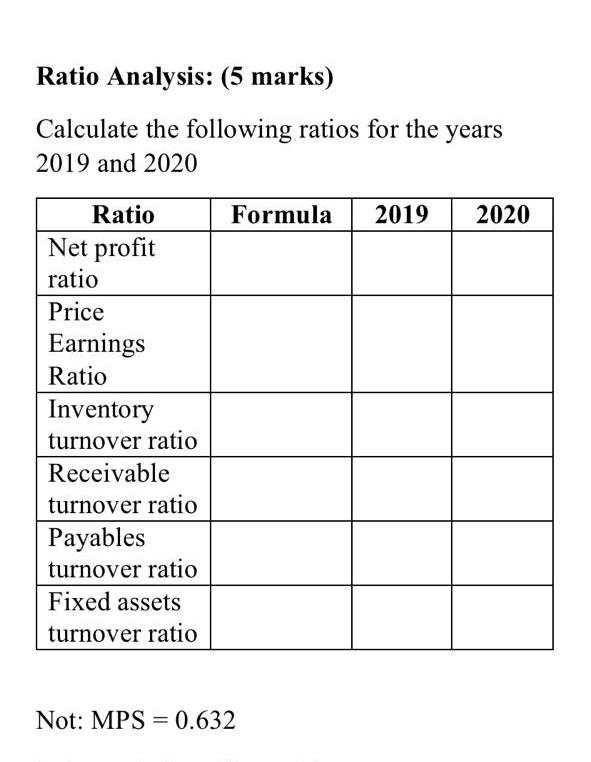
6 The National Detergent Company SAOG Statement of financial position as at 31 December 2020 Notes 2020 RO 2019 RO Assets Non-current assets Property, plant and equipment Advance for capital purchases Right-of-use assets 5(d) 6 14.930,105 72,828 770,818 15,524,765 32,172 961.666 Total non-current assets 15,773,751 16,318,603 7 Current assets Inventories Other current assets Trade receivables Other receivables Cash and cash equivalents 9 10 11 4,538,741 358,646 5,779.215 37,546 966,037 3,101.750 349,407 5,444,296 37.754 579,674 Total current assets 11,680,185 9,512.881 Total assets 27,453,936 26,031.484 Equity and liabilities Equity Share capital Share premium Legal reserve Revaluation reserve Retained earnings 12 12 13 14 1,701,250 364.263 567,083 7,917,250 3,880,298 1,701,250 364,263 567,083 7,917.250 3,754,173 14,430,144 14,304,019 Total equity Liabilities Non-current liabilities Lease liabilities Deferred tax Provision for employees' end of services benefits Total non-current liabilities 15 16 17 653,113 1,679,695 744,112 746,467 1.658,870 664.909 3,076,920 3,070,246 Current liabilities Current portion of long-term loans Short term loans Lease liabilities Income tax Trade and other payables 18 18 15 16 19 3,000,000 93,354 136,532 6,716,986 621,051 3,000,000 171.044 88,431 4,776,693 Total current liabilities 9,946,872 8,657,219 Total liabilities 13,023,792 11.727,465 Total equity and liabilities 27,453,936 26,031,484 Net assets per share 20 Bz 848 Bz 841 Wholent Redka Baqir Al Lawati Chairman William Booth Hunt Chief Executive Officer The accompanying notes form an integral part of these financial statements Ratio Analysis: (5 marks) Calculate the following ratios for the years 2019 and 2020 Formula 2019 2020 Ratio Net profit ratio Price Earnings Ratio Inventory turnover ratio Receivable turnover ratio Payables turnover ratio Fixed assets turnover ratio Not: MPS = 0.632 6 The National Detergent Company SAOG Statement of financial position as at 31 December 2020 Notes 2020 RO 2019 RO Assets Non-current assets Property, plant and equipment Advance for capital purchases Right-of-use assets 5(d) 6 14.930,105 72,828 770,818 15,524,765 32,172 961.666 Total non-current assets 15,773,751 16,318,603 7 Current assets Inventories Other current assets Trade receivables Other receivables Cash and cash equivalents 9 10 11 4,538,741 358,646 5,779.215 37,546 966,037 3,101.750 349,407 5,444,296 37.754 579,674 Total current assets 11,680,185 9,512.881 Total assets 27,453,936 26,031.484 Equity and liabilities Equity Share capital Share premium Legal reserve Revaluation reserve Retained earnings 12 12 13 14 1,701,250 364.263 567,083 7,917,250 3,880,298 1,701,250 364,263 567,083 7,917.250 3,754,173 14,430,144 14,304,019 Total equity Liabilities Non-current liabilities Lease liabilities Deferred tax Provision for employees' end of services benefits Total non-current liabilities 15 16 17 653,113 1,679,695 744,112 746,467 1.658,870 664.909 3,076,920 3,070,246 Current liabilities Current portion of long-term loans Short term loans Lease liabilities Income tax Trade and other payables 18 18 15 16 19 3,000,000 93,354 136,532 6,716,986 621,051 3,000,000 171.044 88,431 4,776,693 Total current liabilities 9,946,872 8,657,219 Total liabilities 13,023,792 11.727,465 Total equity and liabilities 27,453,936 26,031,484 Net assets per share 20 Bz 848 Bz 841 Wholent Redka Baqir Al Lawati Chairman William Booth Hunt Chief Executive Officer The accompanying notes form an integral part of these financial statements Ratio Analysis: (5 marks) Calculate the following ratios for the years 2019 and 2020 Formula 2019 2020 Ratio Net profit ratio Price Earnings Ratio Inventory turnover ratio Receivable turnover ratio Payables turnover ratio Fixed assets turnover ratio Not: MPS = 0.632
Step by Step Solution
There are 3 Steps involved in it
Step: 1

Get Instant Access to Expert-Tailored Solutions
See step-by-step solutions with expert insights and AI powered tools for academic success
Step: 2

Step: 3
Ace Your Homework with AI
Get the answers you need in no time with our AI-driven, step-by-step assistance
Get Started
The Strategies Of Chinas Firms Resolving Dilemmas
Authors: Hailan Yang, Stephen Morgan , Ying Wang
1st Edition
0081002742,0081002769