Answered step by step
Verified Expert Solution
Question
1 Approved Answer
Old MathJax webview development economics a. Perform financial analysis using 9.0% real discount rate, which is the required return on equity. (Use integrated template provided)
Old MathJax webview

development economics


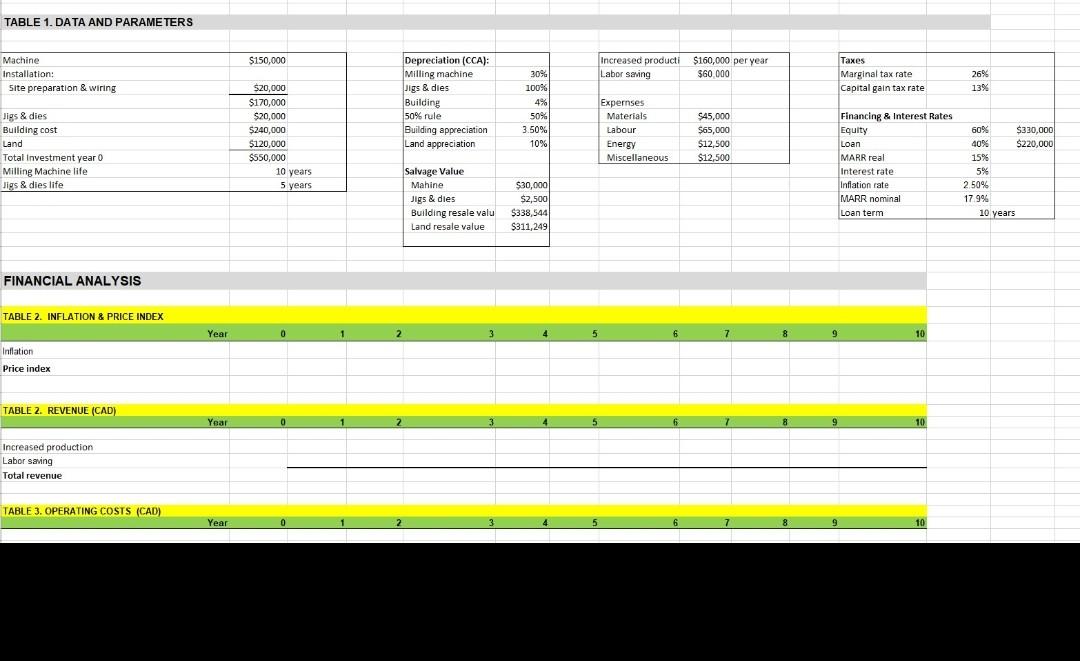
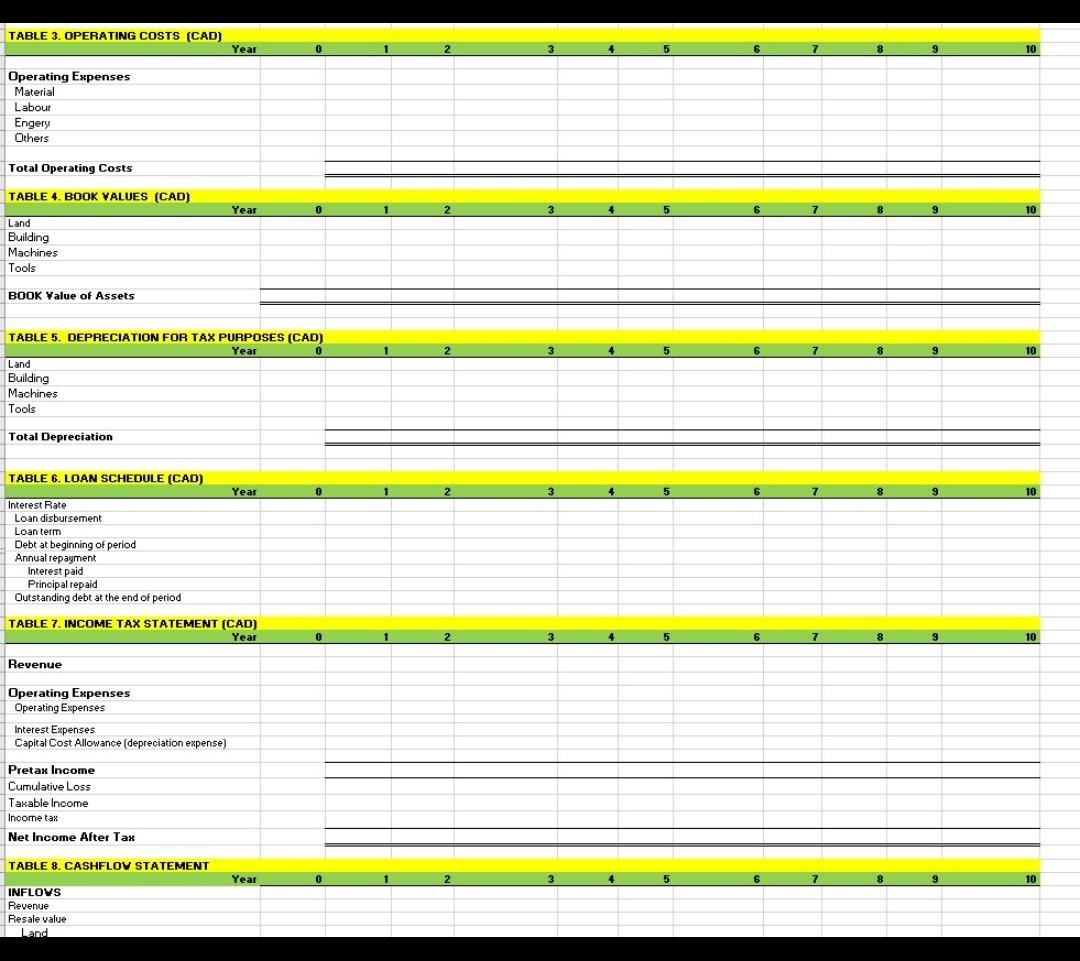
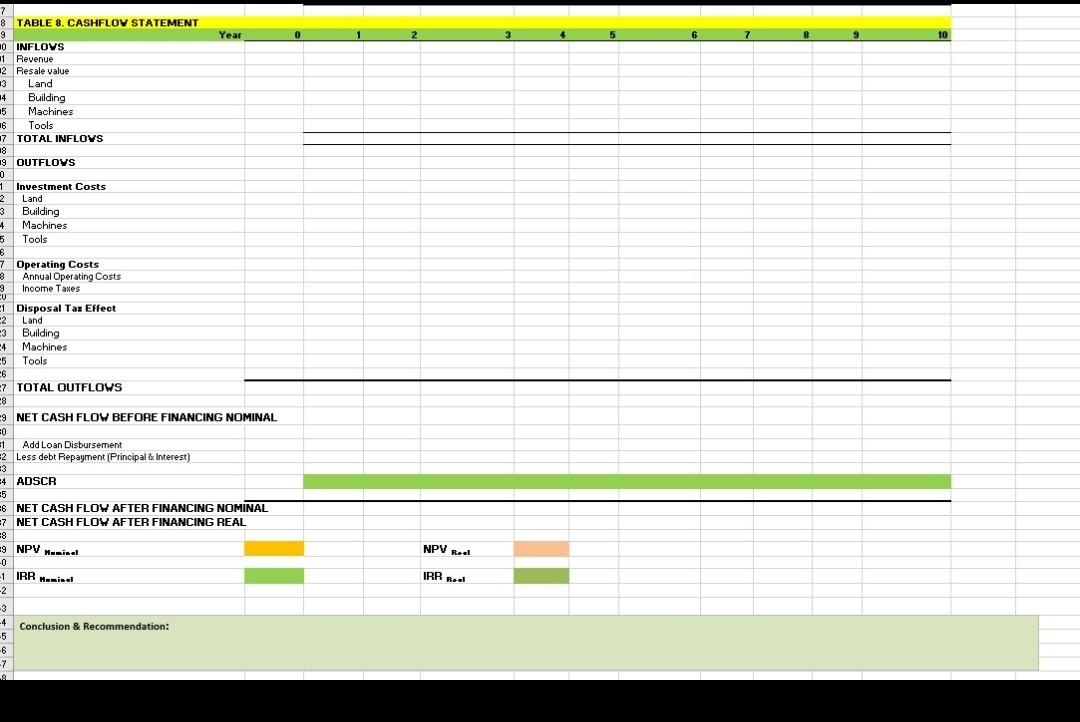
a. Perform financial analysis using 9.0% real discount rate, which is the required return on equity. (Use integrated template provided) TABLE 1. DATA AND PARAMETERS $150,000 Machine Installation: Site preparation & wiring Increased producti Labor saving $160,000 per year $60 000 Taxes Marginal tax rate Capital gain tax rate 26% 13% Depreciation (CCA): Milling machine Jigs & dies Building 50% rule % Building appreciation Land appreciation $20,000 $170,000 $20,000 $240,000 $120,000 $550,000 30% 100% 4% 50% 3.50% 10% Jigs & dies Building cost Land Total Investment year 0 Milling Machine life Jigs & dies life Expernses Materials Labour Energy Miscellaneous $45,000 $65,000 $ $12,500 $12,500 $330,000 $220,000 Financing & Interest Rates Equity Loan MARR real Interest rate Inflation rate MARR nominal Loan term 60% 40% 15% 5% 2 50% 17 9% Salvage Value 10 years 5 years Mahine Jigs & dies Building resale valu Land resale value $30,000 $2,sool $338, 544 $311,249 10 years FINANCIAL ANALYSIS TABLE 2. INFLATION & PRICE INDEX Year 0 1 2 3 4 5 6 7 8 9 10 Inflation Price index TABLE 2. REVENUE (CAD) Year 0 5 8 10 Increased production Labor saving Total revenue TABLE 3. OPERATING COSTS (CAD) Year 10 TABLE 3. OPERATING COSTS (CAD) Year 0 2 10 Operating Expenses Material Labour Engery Others Total Operating Costs TABLE 4. BOOK VALUES (CAD) Year 0 2. 10 Land Building Machines Tools BOOK Value of Assets 2 7 10 TABLE 5. DEPRECIATION FOR TAX PURPOSES (CAD) Year 0 Land Building Machines Tools Total Depreciation TABLE 6. LOAN SCHEDULE (CAD) Year 2 3 5 6 7 9 10 Interest Rate Loan disbursement Loan term Debt at beginning of period Annual repayment Interest paid Principal repaid Outstanding debt at the end of period TABLE 7. INCOME TAX STATEMENT (CAD) Year 0 5 10 Revenue Operating Expenses Operating Expenses Interest Expenses Capital Cost Allowance (depreciation expense) Pretax Income Cumulative Loss Taxable income Income tax Net Income After Tax TABLE 8. CASHFLOV STATEMENT Year 0 2 3 5 6 7 9 10 INFLOVS Revenue Resale value Land 0 10 Building 7 7 8 TABLE 8. CASHFLOV STATEMENT 9 Year 0 INFLOYS 11 Revenue 2 Resale value 13 Land 14 15 Machines 16 Tools 7 TOTAL INFLOYS 18 9 OUTFLOYS 0 1 Investment Costs 2 Land 3 Building 4 Machines 5 Tools 6 7 Operating Costs 8 Annual Operating Costs 9 Income Taxes CU E1 Disposal Tax Effect 2 Land 3 Building 4 Machines -5 Tools 6 7 TOTAL OUTFLOWS 8 9 NET CASH FLOW BEFORE FINANCING NOMINAL 0 1 Add Loan Disbursement 2 Less debt Repayment (Principal & Interest) 3 4 ADSCR 5 6 NET CASH FLOW AFTER FINANCING NOMINAL 7 NET CASH FLOW AFTER FINANCING REAL 8 =9 NPV Mainel NPV Reel -0 -1 IRR Mesin IRR Real Conclusion & Recommendation: -2 -3 -4 -5 -6 -7 9 a. Perform financial analysis using 9.0% real discount rate, which is the required return on equity. (Use integrated template provided) TABLE 1. DATA AND PARAMETERS $150,000 Machine Installation: Site preparation & wiring Increased producti Labor saving $160,000 per year $60 000 Taxes Marginal tax rate Capital gain tax rate 26% 13% Depreciation (CCA): Milling machine Jigs & dies Building 50% rule % Building appreciation Land appreciation $20,000 $170,000 $20,000 $240,000 $120,000 $550,000 30% 100% 4% 50% 3.50% 10% Jigs & dies Building cost Land Total Investment year 0 Milling Machine life Jigs & dies life Expernses Materials Labour Energy Miscellaneous $45,000 $65,000 $ $12,500 $12,500 $330,000 $220,000 Financing & Interest Rates Equity Loan MARR real Interest rate Inflation rate MARR nominal Loan term 60% 40% 15% 5% 2 50% 17 9% Salvage Value 10 years 5 years Mahine Jigs & dies Building resale valu Land resale value $30,000 $2,sool $338, 544 $311,249 10 years FINANCIAL ANALYSIS TABLE 2. INFLATION & PRICE INDEX Year 0 1 2 3 4 5 6 7 8 9 10 Inflation Price index TABLE 2. REVENUE (CAD) Year 0 5 8 10 Increased production Labor saving Total revenue TABLE 3. OPERATING COSTS (CAD) Year 10 TABLE 3. OPERATING COSTS (CAD) Year 0 2 10 Operating Expenses Material Labour Engery Others Total Operating Costs TABLE 4. BOOK VALUES (CAD) Year 0 2. 10 Land Building Machines Tools BOOK Value of Assets 2 7 10 TABLE 5. DEPRECIATION FOR TAX PURPOSES (CAD) Year 0 Land Building Machines Tools Total Depreciation TABLE 6. LOAN SCHEDULE (CAD) Year 2 3 5 6 7 9 10 Interest Rate Loan disbursement Loan term Debt at beginning of period Annual repayment Interest paid Principal repaid Outstanding debt at the end of period TABLE 7. INCOME TAX STATEMENT (CAD) Year 0 5 10 Revenue Operating Expenses Operating Expenses Interest Expenses Capital Cost Allowance (depreciation expense) Pretax Income Cumulative Loss Taxable income Income tax Net Income After Tax TABLE 8. CASHFLOV STATEMENT Year 0 2 3 5 6 7 9 10 INFLOVS Revenue Resale value Land 0 10 Building 7 7 8 TABLE 8. CASHFLOV STATEMENT 9 Year 0 INFLOYS 11 Revenue 2 Resale value 13 Land 14 15 Machines 16 Tools 7 TOTAL INFLOYS 18 9 OUTFLOYS 0 1 Investment Costs 2 Land 3 Building 4 Machines 5 Tools 6 7 Operating Costs 8 Annual Operating Costs 9 Income Taxes CU E1 Disposal Tax Effect 2 Land 3 Building 4 Machines -5 Tools 6 7 TOTAL OUTFLOWS 8 9 NET CASH FLOW BEFORE FINANCING NOMINAL 0 1 Add Loan Disbursement 2 Less debt Repayment (Principal & Interest) 3 4 ADSCR 5 6 NET CASH FLOW AFTER FINANCING NOMINAL 7 NET CASH FLOW AFTER FINANCING REAL 8 =9 NPV Mainel NPV Reel -0 -1 IRR Mesin IRR Real Conclusion & Recommendation: -2 -3 -4 -5 -6 -7 9
Step by Step Solution
There are 3 Steps involved in it
Step: 1

Get Instant Access to Expert-Tailored Solutions
See step-by-step solutions with expert insights and AI powered tools for academic success
Step: 2

Step: 3

Ace Your Homework with AI
Get the answers you need in no time with our AI-driven, step-by-step assistance
Get Started


