

Answered step by step
Verified Expert Solution
Question
1 Approved Answer
Old MathJax webview draw a flow chart in visio Criteria Unacceptable Below Expectations Met Expectations Exceeds Expectations Criterion Score O points 6.66 points 13.34 points
Old MathJax webview
draw a flow chart in visio
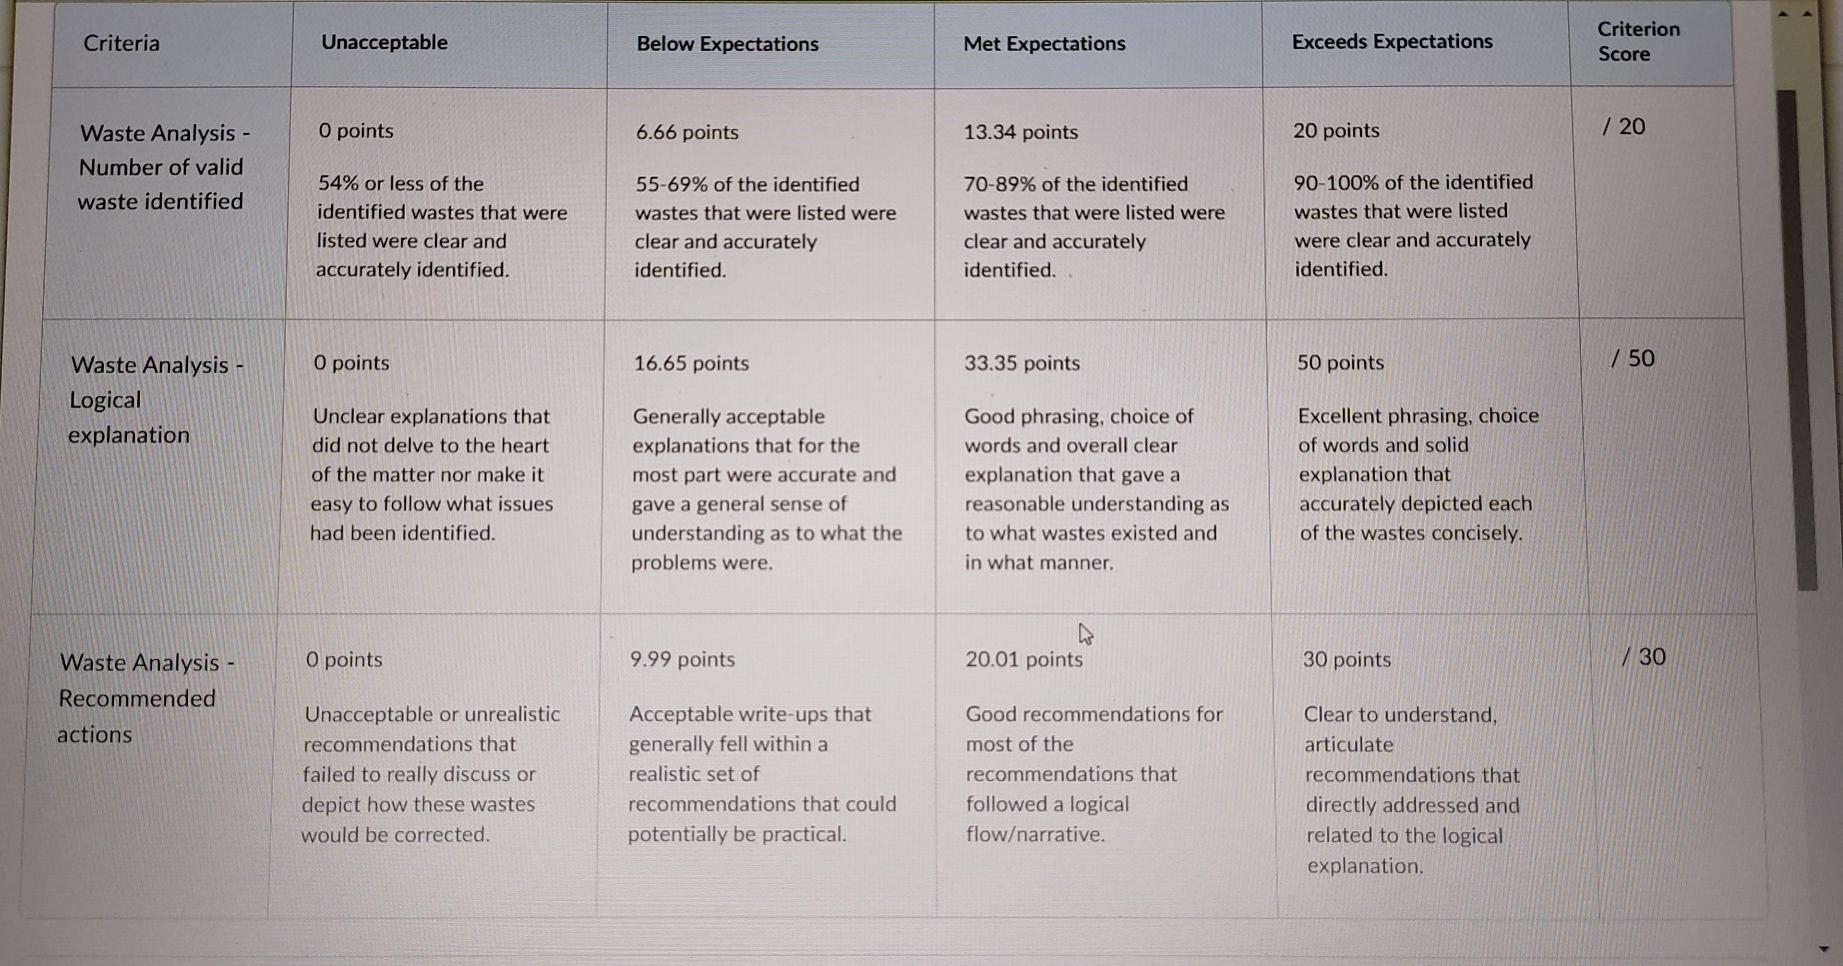
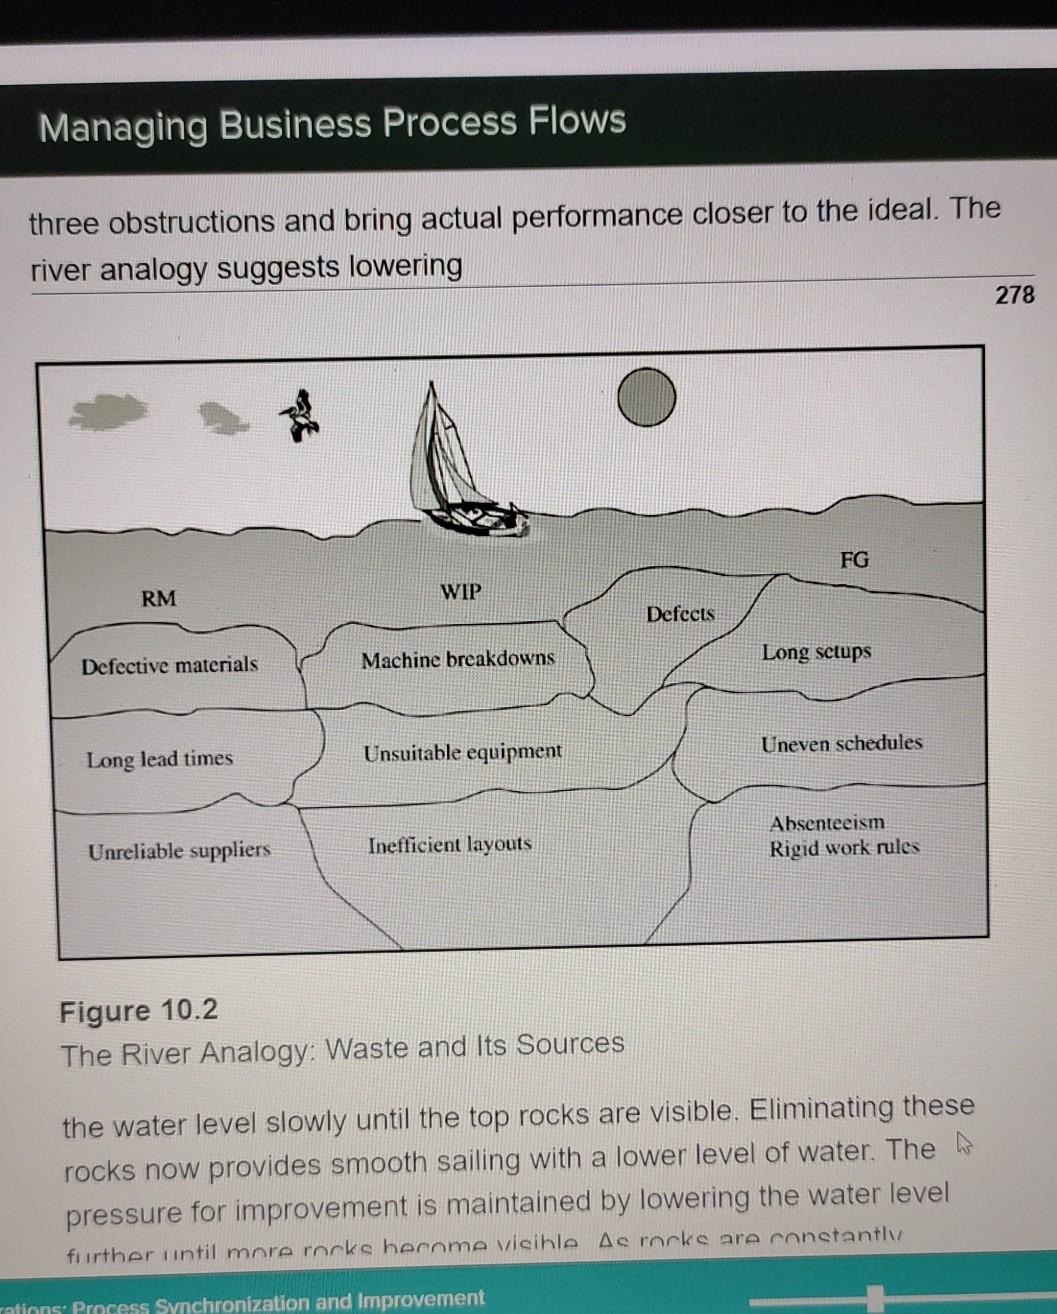
Criteria Unacceptable Below Expectations Met Expectations Exceeds Expectations Criterion Score O points 6.66 points 13.34 points 20 points / 20 Waste Analysis - Number of valid waste identified 54% or less of the identified wastes that were listed were clear and accurately identified. 55-69% of the identified wastes that were listed were clear and accurately identified. 70-89% of the identified wastes that were listed were clear and accurately identified. 90-100% of the identified wastes that were listed were clear and accurately identified. O points 16.65 points 33.35 points 50 points / 50 Waste Analysis - Logical explanation Unclear explanations that did not delve to the heart of the matter nor make it easy to follow what issues had been identified. Generally acceptable explanations that for the most part were accurate and gave a general sense of understanding as to what the problems were. Good phrasing, choice of words and overall clear explanation that gave a reasonable understanding as to what wastes existed and in what manner. Excellent phrasing, choice of words and solid explanation that accurately depicted each of the wastes concisely. O points 9.99 points 20.01 points 30 points / 30 Waste Analysis - Recommended actions Unacceptable or unrealistic recommendations that failed to really discuss or depict how these wastes would be corrected. Acceptable write-ups that generally fell within a realistic set of recommendations that could potentially be practical. Good recommendations for most of the recommendations that followed a logical flowarrative. Clear to understand, articulate recommendations that directly addressed and related to the logical explanation. Managing Business Process Flows three obstructions and bring actual performance closer to the ideal. The river analogy suggests lowering 278 FG RM WIP Defects Defective materials Machine breakdowns Long sclups Long lead times Unsuitable equipment Uneven schedules Absenteeism Rigid work rules Unreliable suppliers Inefficient layouts Figure 10.2 The River Analogy: Waste and Its Sources the water level slowly until the top rocks are visible. Eliminating these rocks now provides smooth sailing with a lower level of water. The w pressure for improvement is maintained by lowering the water level further until more rocks berome visible As rocks are constantly rations Process Synchronization and Improvement Assignment 4: Waste Analysis (Individual) B CBR Ltd - Coffee Beans Flo... 29 Ld 2 BPA X X PA BPA - Assignment #14 Was Was... 2
Step by Step Solution
There are 3 Steps involved in it
Step: 1

Get Instant Access to Expert-Tailored Solutions
See step-by-step solutions with expert insights and AI powered tools for academic success
Step: 2

Step: 3
Ace Your Homework with AI
Get the answers you need in no time with our AI-driven, step-by-step assistance
Get Started
Corporate Finance Made Simple
Authors: Mike Piper
1st Edition
1950967026, 978-1950967025