Answered step by step
Verified Expert Solution
Question
1 Approved Answer
Old MathJax webview Historical returns. Calculate the arithmetic average return of U.S. Treasury bills, long-term government bonds, and large-company stocks for 1989 to 1998. Which
Old MathJax webview
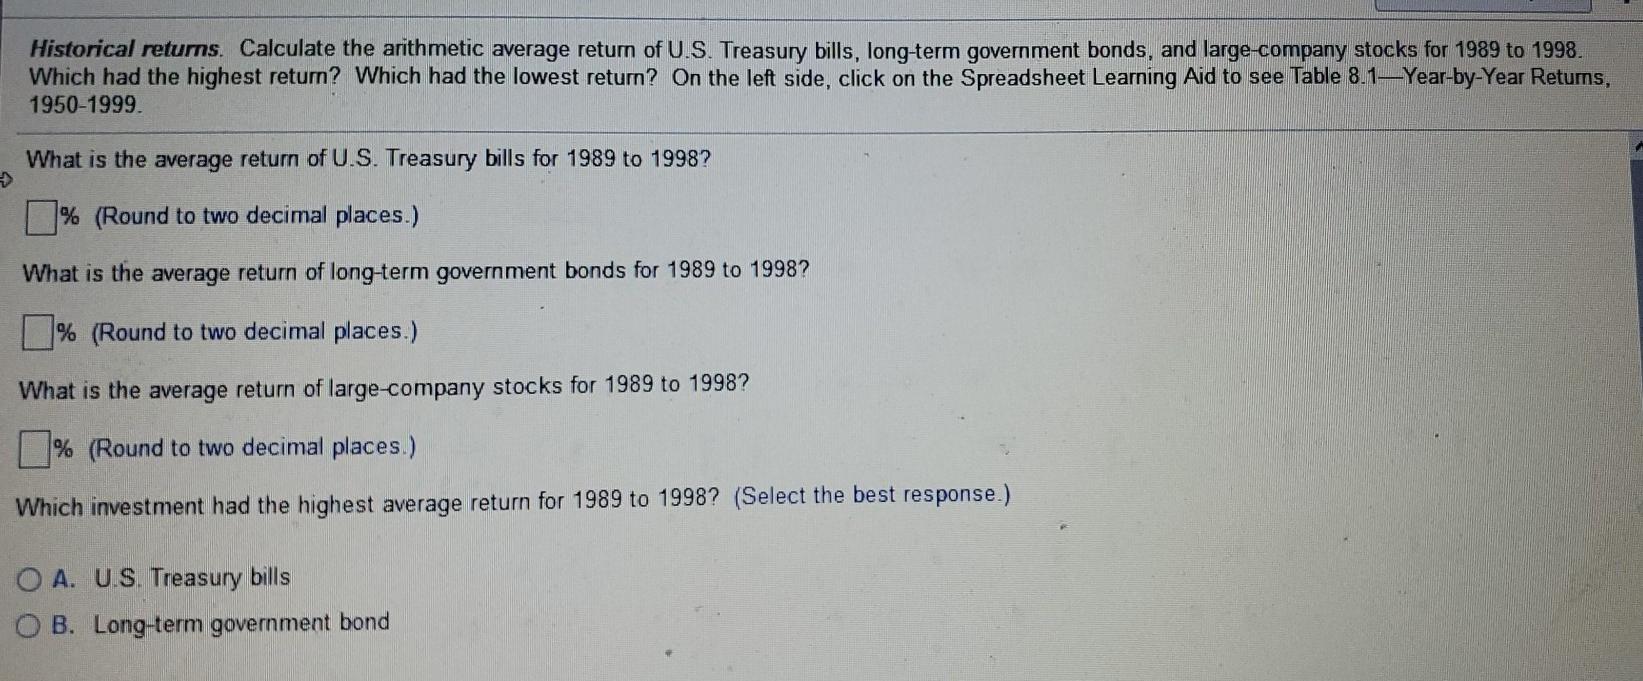
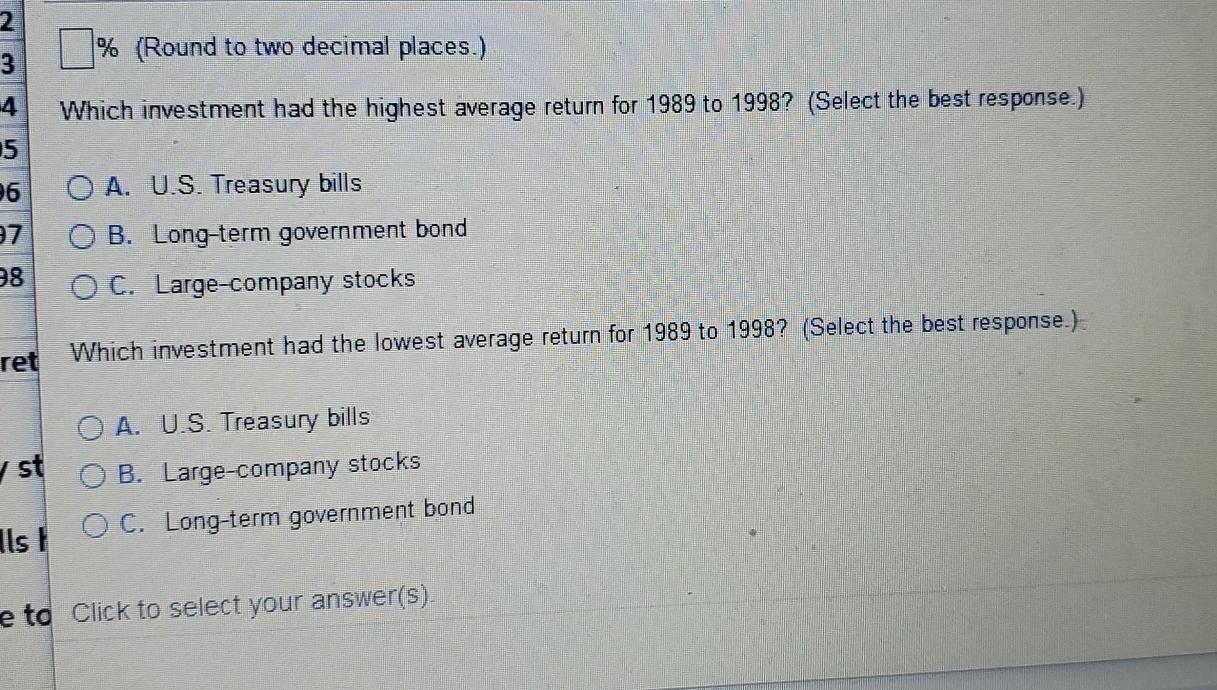
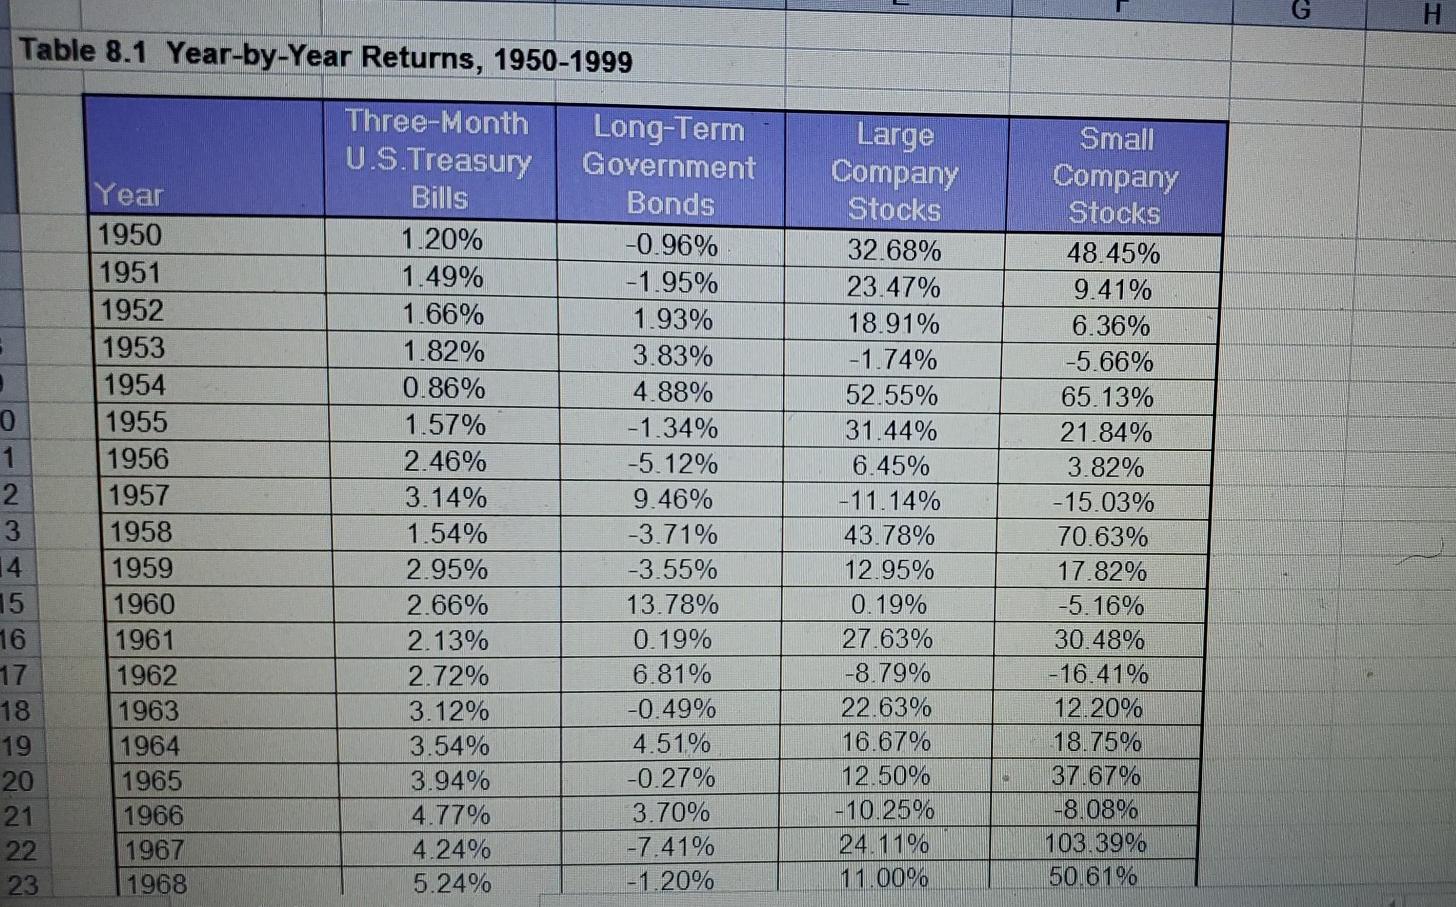
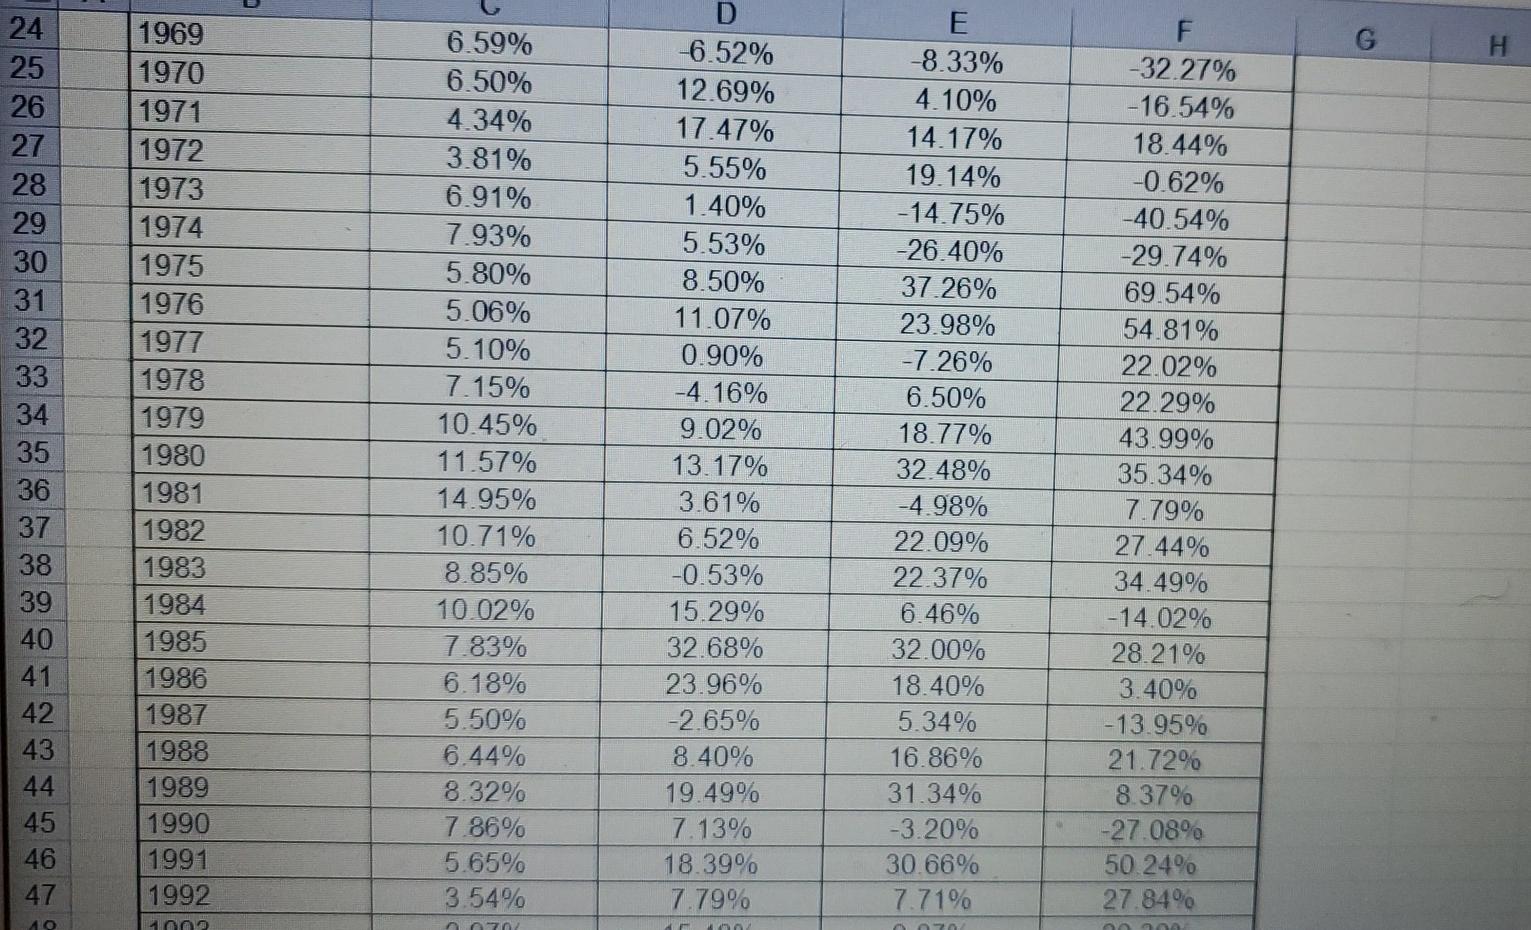
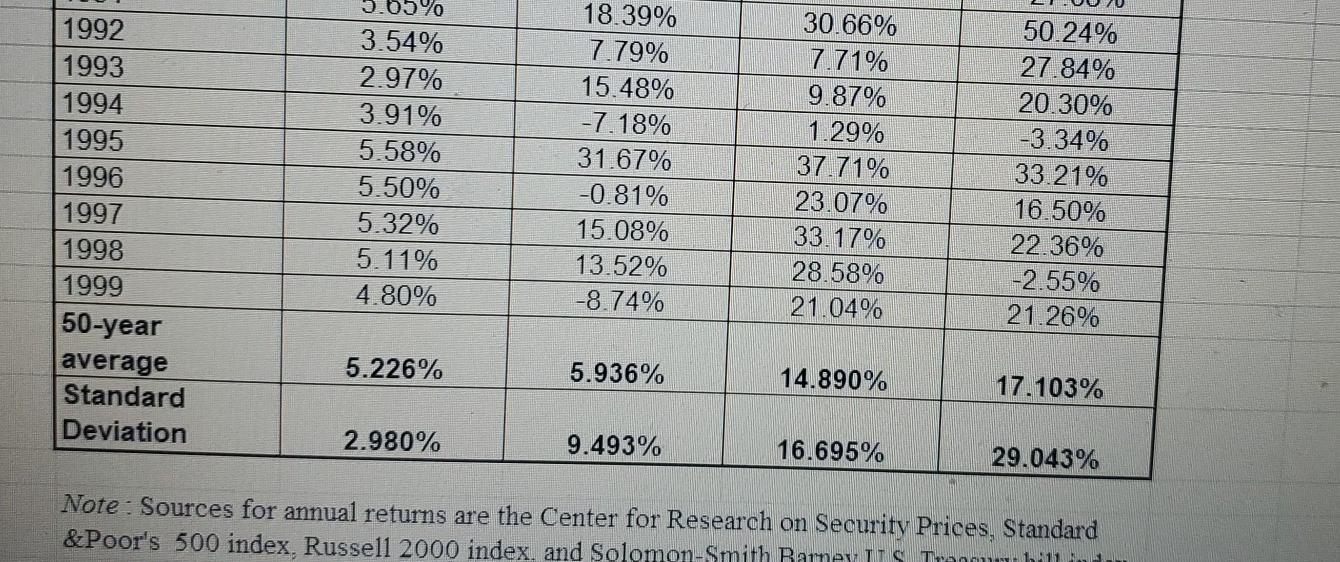
Historical returns. Calculate the arithmetic average return of U.S. Treasury bills, long-term government bonds, and large-company stocks for 1989 to 1998. Which had the highest return? Which had the lowest return? On the left side, click on the Spreadsheet Learning Aid to see Table 8.1-Year-by-Year Retums, 1950-1999. What is the average return of U.S. Treasury bills for 1989 to 1998? % (Round to two decimal places.) What is the average return of long-term government bonds for 1989 to 1998? 1% (Round to two decimal places.) What is the average return of large-company stocks for 1989 to 1998? 1% (Round to two decimal places.) Which investment had the highest average return for 1989 to 1998? (Select the best response.) O A. US Treasury bills O B. Long-term government bond 2 % (Round to two decimal places.) 4 Which investment had the highest average return for 1989 to 1998? (Select the best response.) 15 96 37 O A. U.S. Treasury bills O B. Long-term government bond O C. Large-company stocks 38 Which investment had the lowest average return for 1989 to 1998? (Select the best response.) ret st O A. U.S. Treasury bills O B. Large-company stocks O C. Long-term government bond Ils I e to Click to select your answer(s). H Table 8.1 Year-by-Year Returns, 1950-1999 0 1 2 3 4 15 16 17 18 19 20 21 22 23 Year 1950 1951 1952 1953 1954 1955 1956 1957 1958 1959 1960 1961 1962 1963 1964 1965 1966 1967 1968 Three-Month U.S.Treasury Bills 1.20% 1.49% 1.66% 1.82% 0.86% 1.57% 2.46% 3.14% 1.54% 2.95% 2.66% 2.13% 2.72% 3.12% 3.54% 3.94% 4.77% 4.24% 5.24% Long-Term Government Bonds -0.96% -1.95% 1.93% 3.83% 4.88% -1.34% -5.12% 9.46% -3.71% -3.55% 13.78% 0.19% 6.81% -0.49% 4.51% -0.27% 3.70% -7.41% -1.20% Large Company Stocks 32.68% 23.47% 18.91% -1.74% 52.55% 31.44% 6.45% -11.14% 43.78% 12.95% 0.19% 27.63% -8.79% 22.63% 16.67% 12.50% -10.25% 24.11% 11.00% Small Company Stocks 48.45% 9.41% 6.36% -5.66% 65.13% 21.84% 3.82% -15.03% 70.63% 17.82% -5.16% 30.48% -16.41% 12.20% 18.75% 37.67% -8.08% 103.39% 50.61% H 24 25 26 27 28 29 30 31 32 33 34 35 36 37 1969 1970 1971 1972 1973 1974 1975 1976 1977 1978 1979 1980 1981 1982 1983 1984 1985 1986 1987 1988 1989 1990 1991 1992 6.59% 6.50% 4.34% 3.81% 6.91% 7.93% 5.80% 5.06% 5.10% 7.15% 10.45% 11.57% 14.95% 10.71% 8.85% 10.02% 7.83% 6.18% 5.50% 6.44% 8.32% 7 86% 5.65% 3.54% D 6.52% 12.69% 17.47% 5.55% 1.40% 5.53% 8.50% 11.07% 0.90% -4.16% 9.02% 13.17% 3.61% 6.52% -0.53% 15.29% 32.68% 23.96% -2.65% 8.40% 19.49% 7.13% 18.39% 7.79% E 8.33% 4.10% 14.17% 19.14% -14.75% -26.40% 37.26% 23.98% -7.26% 6.50% 18.77% 32.48% -4.98% 22.09% 22.37% 6.46% 32.00% 18.40% 5.34% 16.86% 31.34% -3.20% 30.66% 7.71% F -32.27% -16.54% 18.44% -0.62% -40.54% -29.74% 69.54% 54.81% 22.02% 22.29% 43.99% 35.34% 7.79% 27.44% 34.49% -14.02% 28.21% 3.40% -13.95% 21.72% 8.37% -27.08% 50.24% 27.84% 38 39 40 41 42 43 44 45 46 47 AO 1992 1993 1994 1995 1996 1997 1998 1999 50-year average Standard Deviation 3.03% 3.54% 2.97% 3.91% 5.58% 5.50% 5.32% 5.11% 4.80% 18.39% 7.79% 15.48% -7.18% 31.67% -0.81% 15.08% 13.52% -8.74% 30.66% 7.71% 9.87% 1.29% 37.71% 23.07% 33.17% 28.58% 21.04% 50.24% 27.84% 20.30% -3.34% 33.21% 16.50% 22.36% -2.55% 21.26% 5.226% 5.936% 14.890% 17.103% 2.980% 9.493% 16.695% 29.043% Note : Sources for annual returns are the Center for Research on Security Prices, Standard &Poor's 500 index, Russell 2000 index, and Solomon-Smith Barney's Truh
Step by Step Solution
There are 3 Steps involved in it
Step: 1

Get Instant Access to Expert-Tailored Solutions
See step-by-step solutions with expert insights and AI powered tools for academic success
Step: 2

Step: 3

Ace Your Homework with AI
Get the answers you need in no time with our AI-driven, step-by-step assistance
Get Started


