

Question
Old MathJax webview I Have uploaded my documents in 5 parts you just have to answer the question related to analysis of budget and variance
Old MathJax webview
I Have uploaded my documents in 5 parts you just have to answer the question related to analysis of budget and variance however additional information will help you in getting the answer. 1.questions
2.Performance report
Additional information about how company works you may use this to understand the working in order to analyse performance (basically it's a case study but I dont have a pdf so I have to upload pictures)
3.
4. cont.
5
thanks! I will Upvote for your efforts
You may ignore The last 3 parts and only answer using 1st two pictures
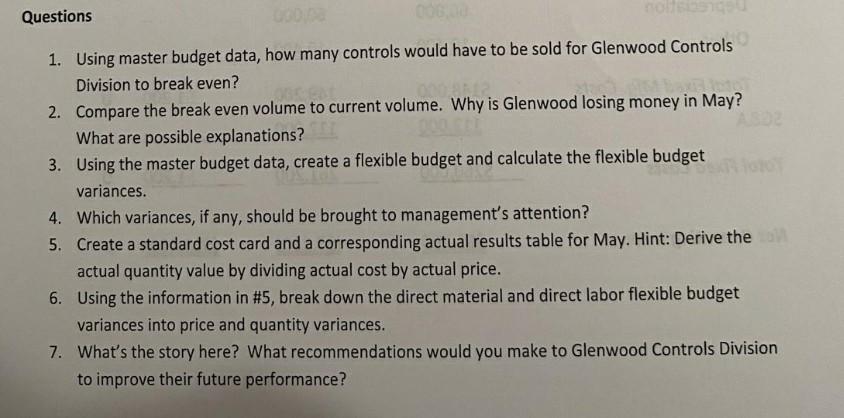
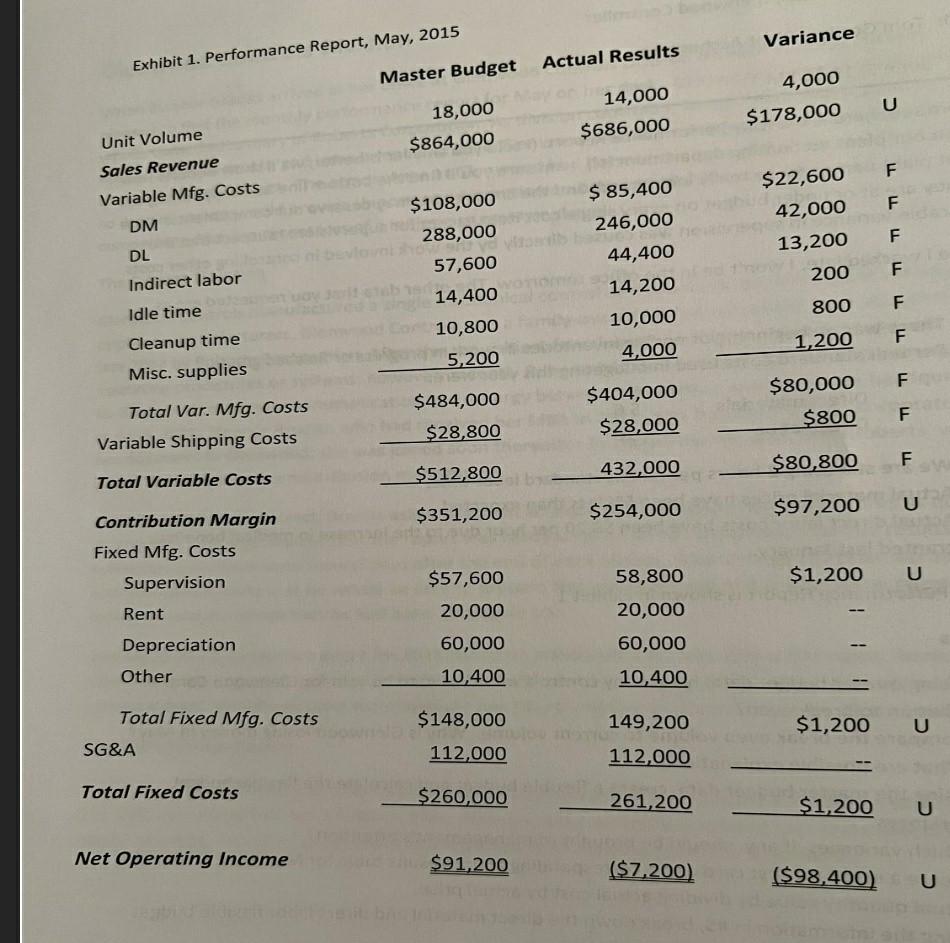
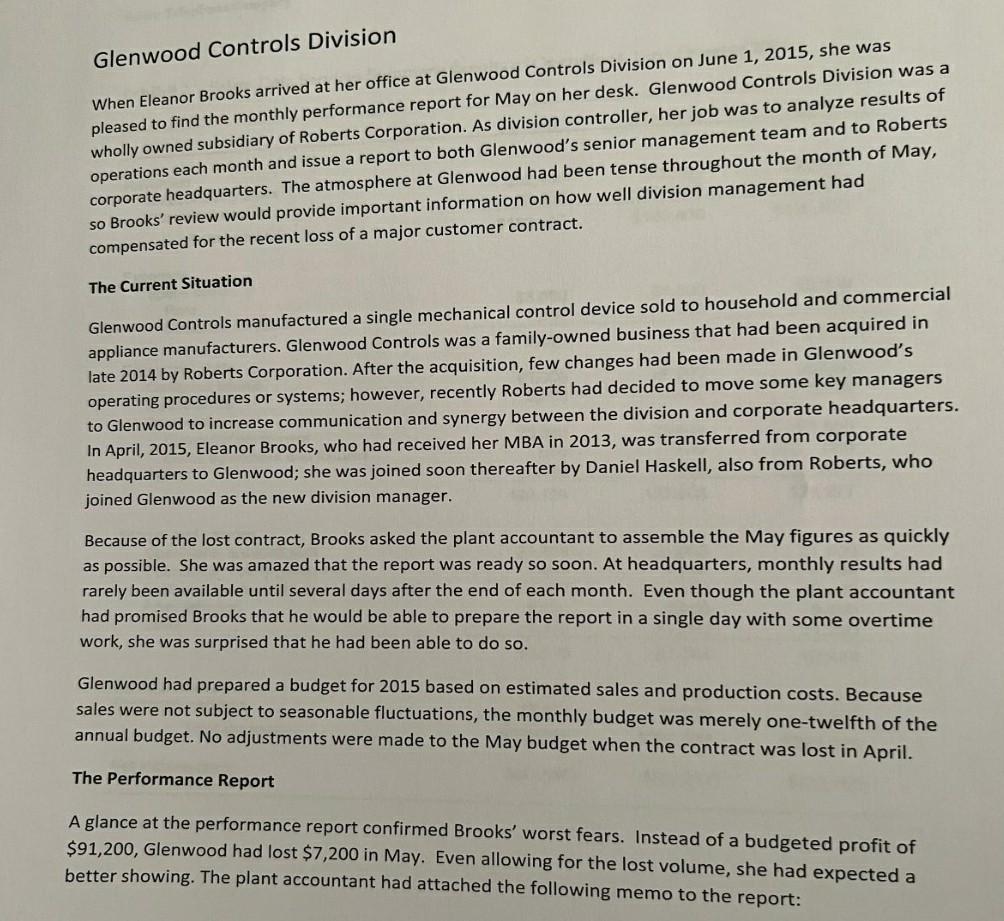
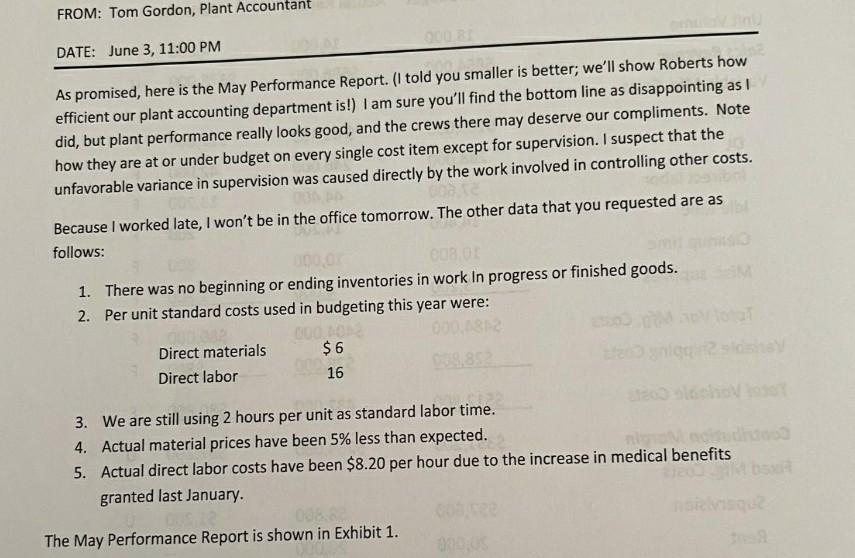
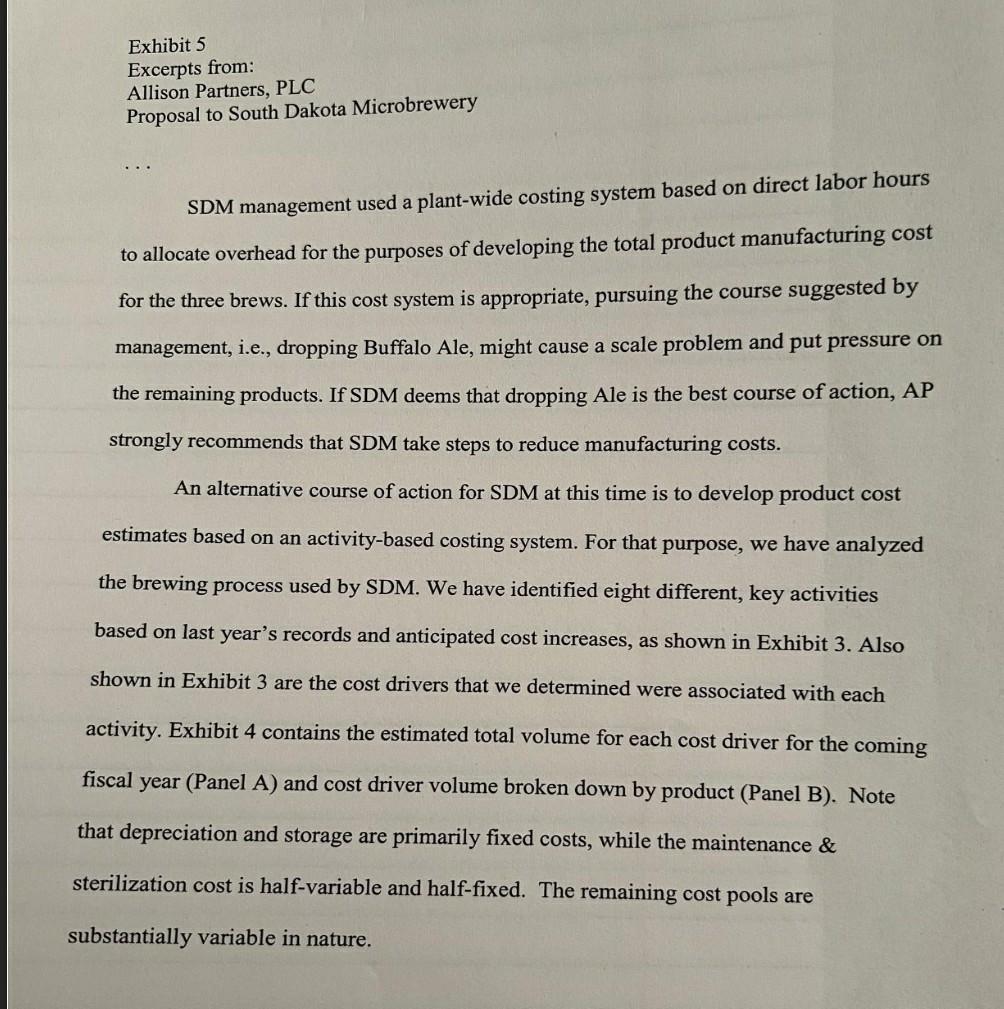
Questions MO 1. Using master budget data, how many controls would have to be sold for Glenwood Controls Division to break even? 2. Compare the break even volume to current volume. Why is Glenwood losing money in May? What are possible explanations? 3. Using the master budget data, create a flexible budget and calculate the flexible budget variances. 4. Which variances, if any, should be brought to management's attention? 5. Create a standard cost card and a corresponding actual results table for May. Hint: Derive the actual quantity value by dividing actual cost by actual price. 6. Using the information in #5, break down the direct material and direct labor flexible budget variances into price and quantity variances. 7. What's the story here? What recommendations would you make to Glenwood Controls Division to improve their future performance? Variance Exhibit 1. Performance Report, May, 2015 Actual Results Master Budget 4,000 $178,000 U 14,000 $686,000 18,000 $864,000 Unit Volume Sales Revenue F Variable Mfg. Costs F $22,600 42,000 13,200 DM F $ 85,400 246,000 44,400 14,200 10,000 4,000 $108,000 288,000 57,600 14,400 10,800 5,200 200 F DL Indirect labor Idle time Cleanup time Misc. supplies 800 F 1,200 F F $484,000 $28,800 $80,000 $800 $404,000 $28,000 Total Var. Mfg. Costs Variable Shipping Costs F F $80,800 432,000 $512,800 Total Variable Costs $254,000 $351,200 U $97,200 Contribution Margin Fixed Mfg. Costs Supervision $1,200 U Rent Depreciation $57,600 20,000 60,000 58,800 20,000 60,000 10,400 Other 10,400 $148,000 149,200 Total Fixed Mfg. Costs SG&A $1,200 U 112,000 112,000 Total Fixed Costs $260,000 261,200 $1,200 U Net Operating Income $91,200 ($ 7,200 ($98,400) ) U Glenwood Controls Division When Eleanor Brooks arrived at her office at Glenwood Controls Division on June 1, 2015, she was pleased to find the monthly performance report for May on her desk. Glenwood Controls Division was a wholly owned subsidiary of Roberts Corporation. As division controller, her job was to analyze results of operations each month and issue a report to both Glenwood's senior management team and to Roberts corporate headquarters. The atmosphere at Glenwood had been tense throughout the month of May, So Brooks' review would provide important information on how well division management had compensated for the recent loss of a major customer contract. The Current Situation Glenwood Controls manufactured a single mechanical control device sold to household and commercial appliance manufacturers. Glenwood Controls was a family-owned business that had been acquired in late 2014 by Roberts Corporation. After the acquisition, few changes had been made in Glenwood's operating procedures or systems; however, recently Roberts had decided to move some key managers to Glenwood to increase communication and synergy between the division and corporate headquarters. In April, 2015, Eleanor Brooks, who had received her MBA in 2013, was transferred from corporate headquarters to Glenwood; she was joined soon thereafter by Daniel Haskell, also from Roberts, who joined Glenwood as the new division manager. Because of the lost contract, Brooks asked the plant accountant to assemble the May figures as quickly as possible. She was amazed that the report was ready so soon. At headquarters, monthly results had rarely been available until several days after the end of each month. Even though the plant accountant had promised Brooks that he would be able to prepare the report in a single day with some overtime work, she was surprised that he had been able to do so. Glenwood had prepared a budget for 2015 based on estimated sales and production costs. Because sales were not subject to seasonable fluctuations, the monthly budget was merely one-twelfth of the annual budget. No adjustments were made to the May budget when the contract was lost in April. The Performance Report A glance at the performance report confirmed Brooks' worst fears. Instead of a budgeted profit of $91,200, Glenwood had lost $7,200 in May. Even allowing for the lost volume, she had expected a better showing. The plant accountant had attached the following memo to the report: FROM: Tom Gordon, Plant Accountant DATE: June 3, 11:00 PM As promised, here is the May Performance Report. (I told you smaller is better; we'll show Roberts how efficient our plant accounting department is!) I am sure you'll find the bottom line as disappointing as I did, but plant performance really looks good, and the crews there may deserve our compliments. Note how they are at or under budget on every single cost item except for supervision. I suspect that the unfavorable variance in supervision was caused directly by the work involved in controlling other costs. Because I worked late, I won't be in the office tomorrow. The other data that you requested are as follows: 0000 1. There was no beginning or ending inventories in work in progress or finished goods. 2. Per unit standard costs used in budgeting this year were: 000.00 0001 Direct materials $6 3 Direct labor 16 3. We are still using 2 hours per unit as standard labor time. 4. Actual material prices have been 5% less than expected. 5. Actual direct labor costs have been $8.20 per hour due to the increase in medical benefits granted last January. The May Performance Report is shown in Exhibit 1. Exhibit 5 Excerpts from: Allison Partners, PLC Proposal to South Dakota Microbrewery SDM management used a plant-wide costing system based on direct labor hours to allocate overhead for the purposes of developing the total product manufacturing cost for the three brews. If this cost system is appropriate, pursuing the course suggested by management, i.e., dropping Buffalo Ale, might cause a scale problem and put pressure on the remaining products. If SDM deems that dropping Ale is the best course of action, AP strongly recommends that SDM take steps to reduce manufacturing costs. An alternative course of action for SDM at this time is to develop product cost estimates based on an activity-based costing system. For that purpose, we have analyzed the brewing process used by SDM. We have identified eight different, key activities based on last year's records and anticipated cost increases, as shown in Exhibit 3. Also shown in Exhibit 3 are the cost drivers that we determined were associated with each activity. Exhibit 4 contains the estimated total volume for each cost driver for the coming fiscal year (Panel A) and cost driver volume broken down by product (Panel B). Note that depreciation and storage are primarily fixed costs, while the maintenance & sterilization cost is half-variable and half-fixed. The remaining cost pools are substantially variable in nature. Questions MO 1. Using master budget data, how many controls would have to be sold for Glenwood Controls Division to break even? 2. Compare the break even volume to current volume. Why is Glenwood losing money in May? What are possible explanations? 3. Using the master budget data, create a flexible budget and calculate the flexible budget variances. 4. Which variances, if any, should be brought to management's attention? 5. Create a standard cost card and a corresponding actual results table for May. Hint: Derive the actual quantity value by dividing actual cost by actual price. 6. Using the information in #5, break down the direct material and direct labor flexible budget variances into price and quantity variances. 7. What's the story here? What recommendations would you make to Glenwood Controls Division to improve their future performance? Variance Exhibit 1. Performance Report, May, 2015 Actual Results Master Budget 4,000 $178,000 U 14,000 $686,000 18,000 $864,000 Unit Volume Sales Revenue F Variable Mfg. Costs F $22,600 42,000 13,200 DM F $ 85,400 246,000 44,400 14,200 10,000 4,000 $108,000 288,000 57,600 14,400 10,800 5,200 200 F DL Indirect labor Idle time Cleanup time Misc. supplies 800 F 1,200 F F $484,000 $28,800 $80,000 $800 $404,000 $28,000 Total Var. Mfg. Costs Variable Shipping Costs F F $80,800 432,000 $512,800 Total Variable Costs $254,000 $351,200 U $97,200 Contribution Margin Fixed Mfg. Costs Supervision $1,200 U Rent Depreciation $57,600 20,000 60,000 58,800 20,000 60,000 10,400 Other 10,400 $148,000 149,200 Total Fixed Mfg. Costs SG&A $1,200 U 112,000 112,000 Total Fixed Costs $260,000 261,200 $1,200 U Net Operating Income $91,200 ($ 7,200 ($98,400) ) U Glenwood Controls Division When Eleanor Brooks arrived at her office at Glenwood Controls Division on June 1, 2015, she was pleased to find the monthly performance report for May on her desk. Glenwood Controls Division was a wholly owned subsidiary of Roberts Corporation. As division controller, her job was to analyze results of operations each month and issue a report to both Glenwood's senior management team and to Roberts corporate headquarters. The atmosphere at Glenwood had been tense throughout the month of May, So Brooks' review would provide important information on how well division management had compensated for the recent loss of a major customer contract. The Current Situation Glenwood Controls manufactured a single mechanical control device sold to household and commercial appliance manufacturers. Glenwood Controls was a family-owned business that had been acquired in late 2014 by Roberts Corporation. After the acquisition, few changes had been made in Glenwood's operating procedures or systems; however, recently Roberts had decided to move some key managers to Glenwood to increase communication and synergy between the division and corporate headquarters. In April, 2015, Eleanor Brooks, who had received her MBA in 2013, was transferred from corporate headquarters to Glenwood; she was joined soon thereafter by Daniel Haskell, also from Roberts, who joined Glenwood as the new division manager. Because of the lost contract, Brooks asked the plant accountant to assemble the May figures as quickly as possible. She was amazed that the report was ready so soon. At headquarters, monthly results had rarely been available until several days after the end of each month. Even though the plant accountant had promised Brooks that he would be able to prepare the report in a single day with some overtime work, she was surprised that he had been able to do so. Glenwood had prepared a budget for 2015 based on estimated sales and production costs. Because sales were not subject to seasonable fluctuations, the monthly budget was merely one-twelfth of the annual budget. No adjustments were made to the May budget when the contract was lost in April. The Performance Report A glance at the performance report confirmed Brooks' worst fears. Instead of a budgeted profit of $91,200, Glenwood had lost $7,200 in May. Even allowing for the lost volume, she had expected a better showing. The plant accountant had attached the following memo to the report: FROM: Tom Gordon, Plant Accountant DATE: June 3, 11:00 PM As promised, here is the May Performance Report. (I told you smaller is better; we'll show Roberts how efficient our plant accounting department is!) I am sure you'll find the bottom line as disappointing as I did, but plant performance really looks good, and the crews there may deserve our compliments. Note how they are at or under budget on every single cost item except for supervision. I suspect that the unfavorable variance in supervision was caused directly by the work involved in controlling other costs. Because I worked late, I won't be in the office tomorrow. The other data that you requested are as follows: 0000 1. There was no beginning or ending inventories in work in progress or finished goods. 2. Per unit standard costs used in budgeting this year were: 000.00 0001 Direct materials $6 3 Direct labor 16 3. We are still using 2 hours per unit as standard labor time. 4. Actual material prices have been 5% less than expected. 5. Actual direct labor costs have been $8.20 per hour due to the increase in medical benefits granted last January. The May Performance Report is shown in Exhibit 1. Exhibit 5 Excerpts from: Allison Partners, PLC Proposal to South Dakota Microbrewery SDM management used a plant-wide costing system based on direct labor hours to allocate overhead for the purposes of developing the total product manufacturing cost for the three brews. If this cost system is appropriate, pursuing the course suggested by management, i.e., dropping Buffalo Ale, might cause a scale problem and put pressure on the remaining products. If SDM deems that dropping Ale is the best course of action, AP strongly recommends that SDM take steps to reduce manufacturing costs. An alternative course of action for SDM at this time is to develop product cost estimates based on an activity-based costing system. For that purpose, we have analyzed the brewing process used by SDM. We have identified eight different, key activities based on last year's records and anticipated cost increases, as shown in Exhibit 3. Also shown in Exhibit 3 are the cost drivers that we determined were associated with each activity. Exhibit 4 contains the estimated total volume for each cost driver for the coming fiscal year (Panel A) and cost driver volume broken down by product (Panel B). Note that depreciation and storage are primarily fixed costs, while the maintenance & sterilization cost is half-variable and half-fixed. The remaining cost pools are substantially variable in natureStep by Step Solution
There are 3 Steps involved in it
Step: 1

Get Instant Access to Expert-Tailored Solutions
See step-by-step solutions with expert insights and AI powered tools for academic success
Step: 2

Step: 3
Ace Your Homework with AI
Get the answers you need in no time with our AI-driven, step-by-step assistance
Get Started
STAT 208 Statistical Thinking To Accompany Stat 208 At Virginia Common Wealth University
Authors: Becky Durfee, W. Scott Street IV
1st Edition
1544621205, 978-1544621203