

Answered step by step
Verified Expert Solution
Question
1 Approved Answer
Old MathJax webview Q1. Pen down the understanding of the business and industry that Seagate Technology is engaged in. (You may use B Canvas Model
Old MathJax webview
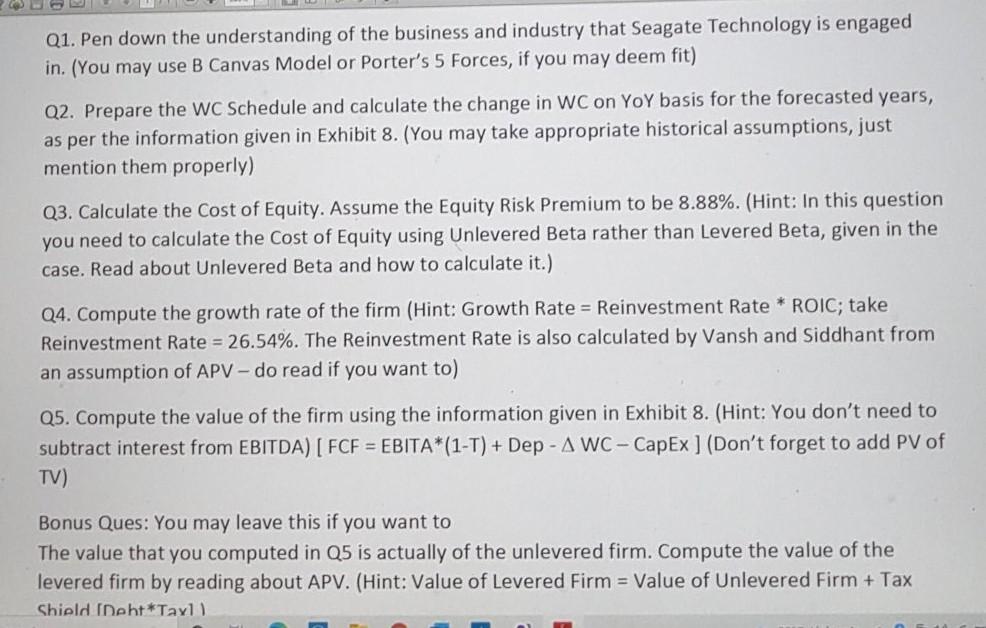
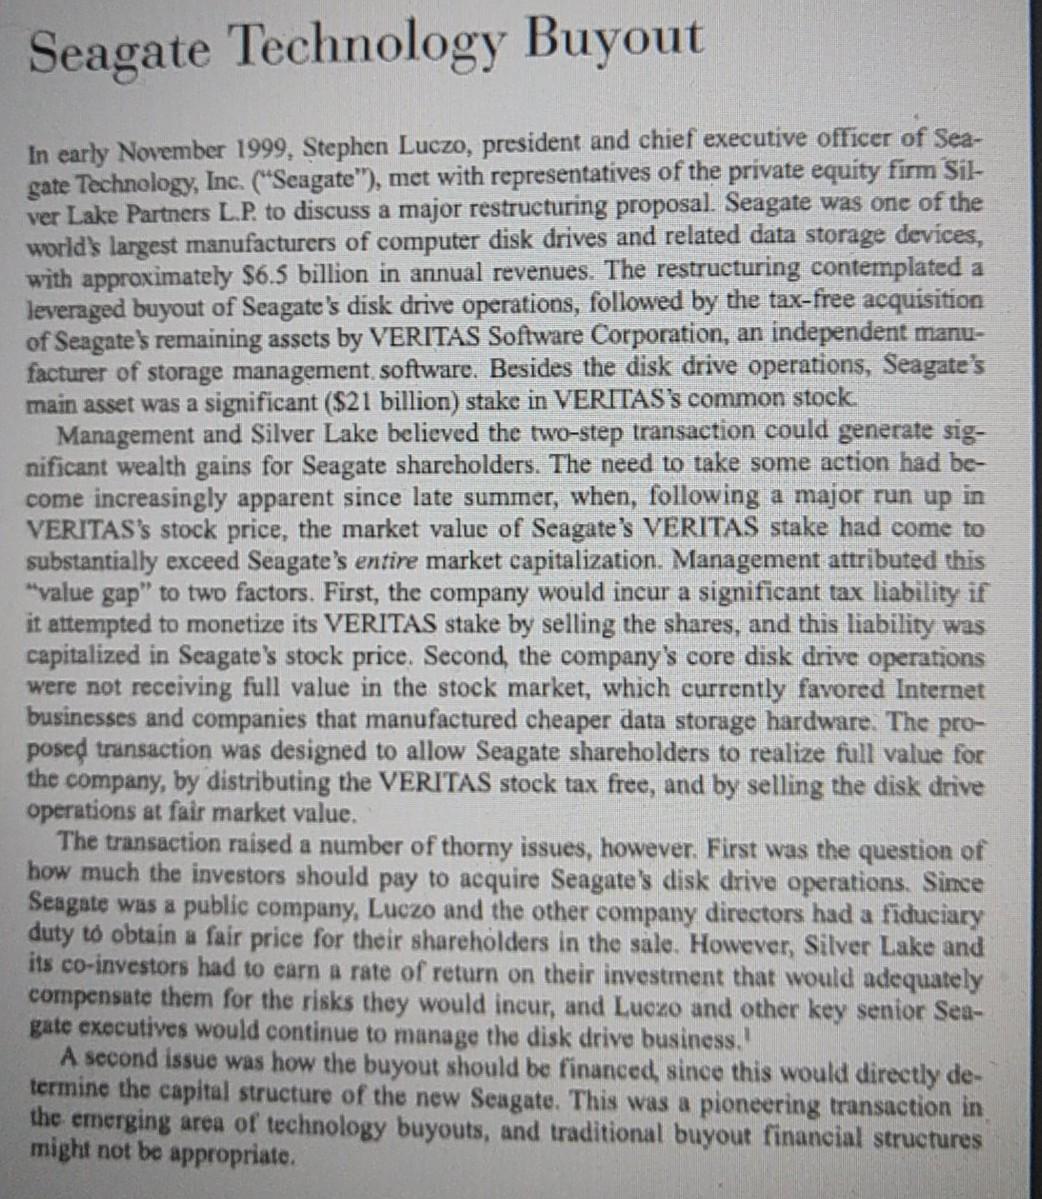
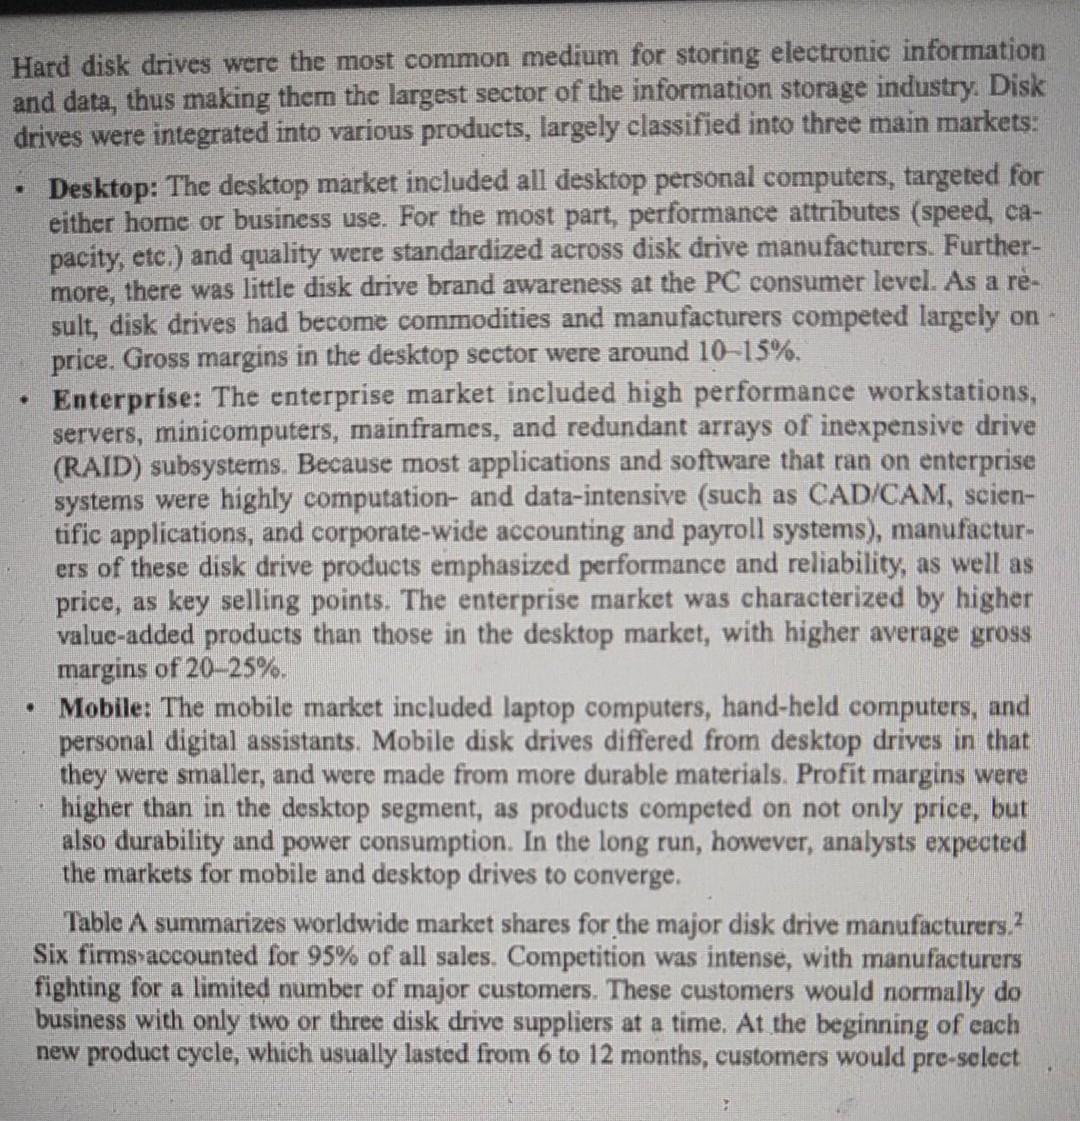
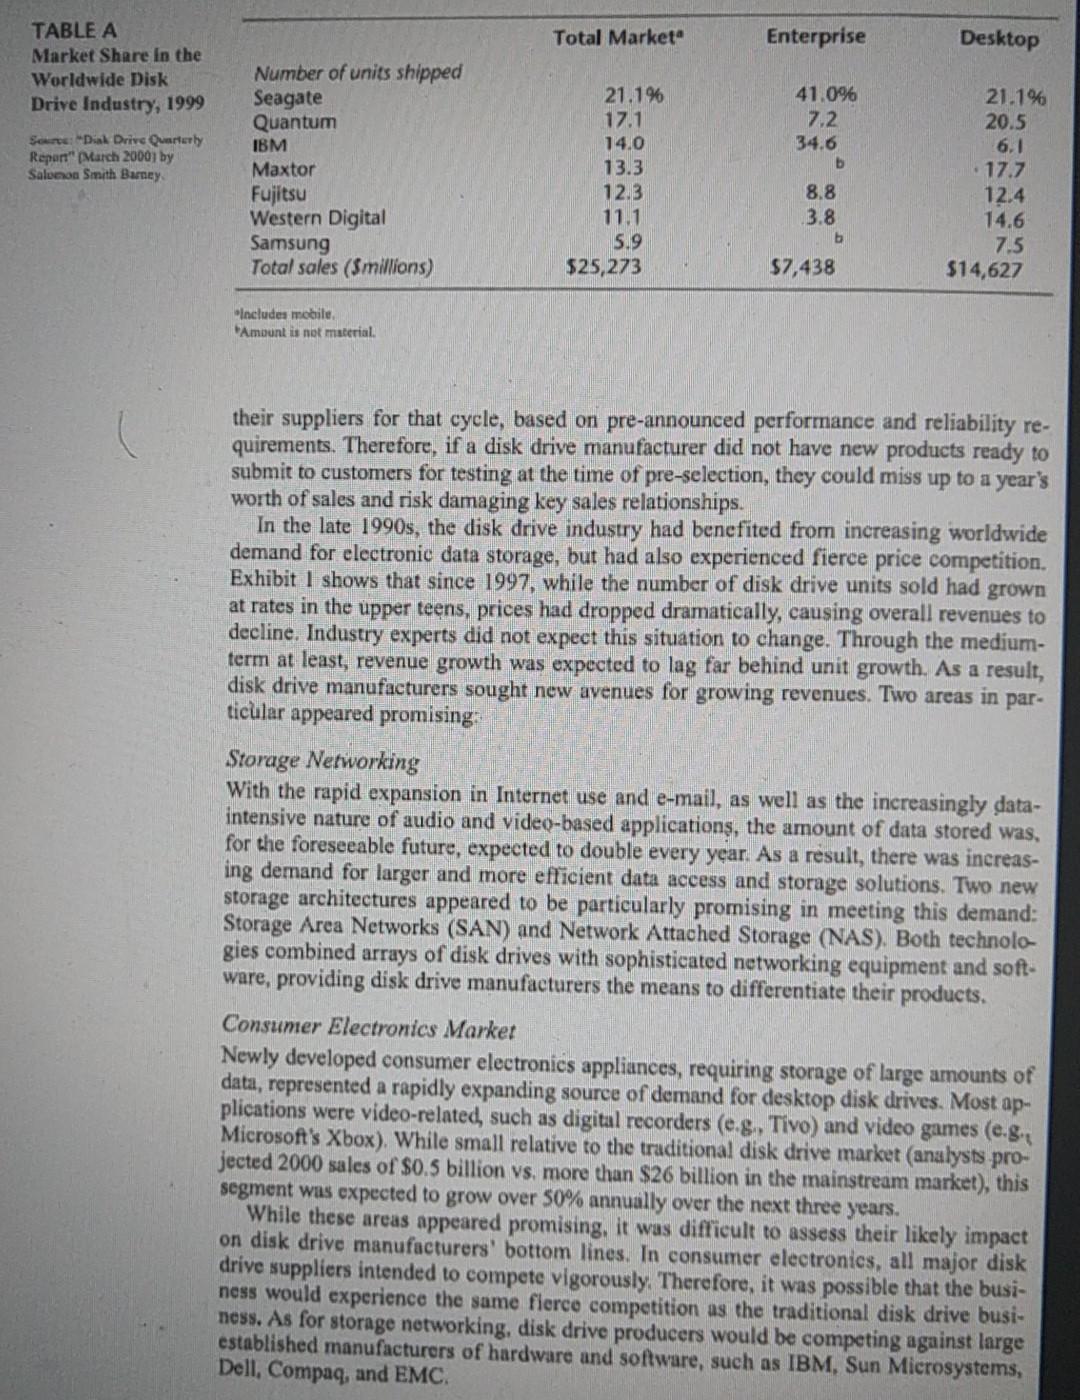
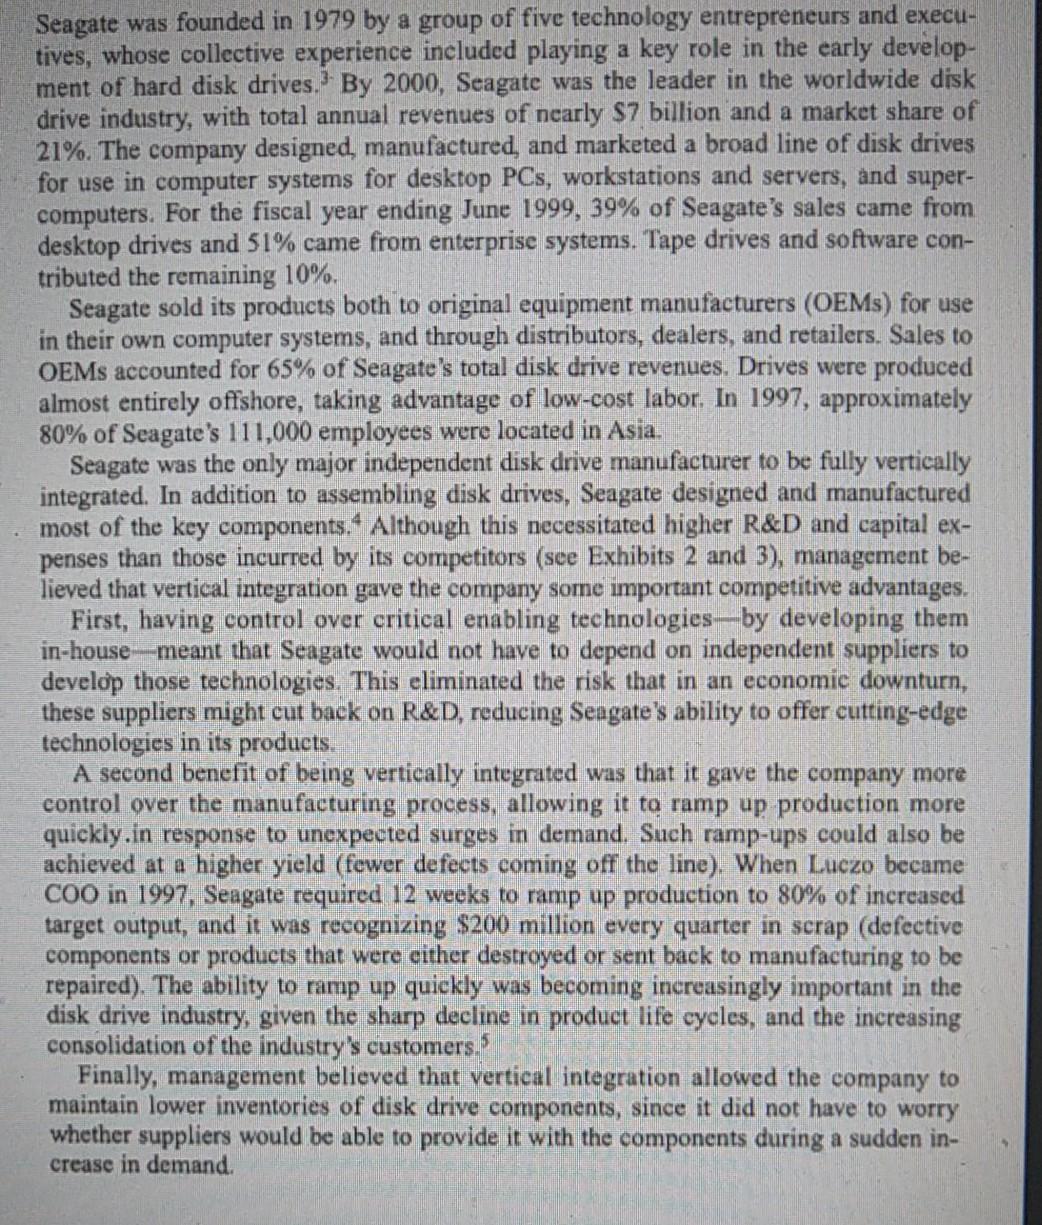
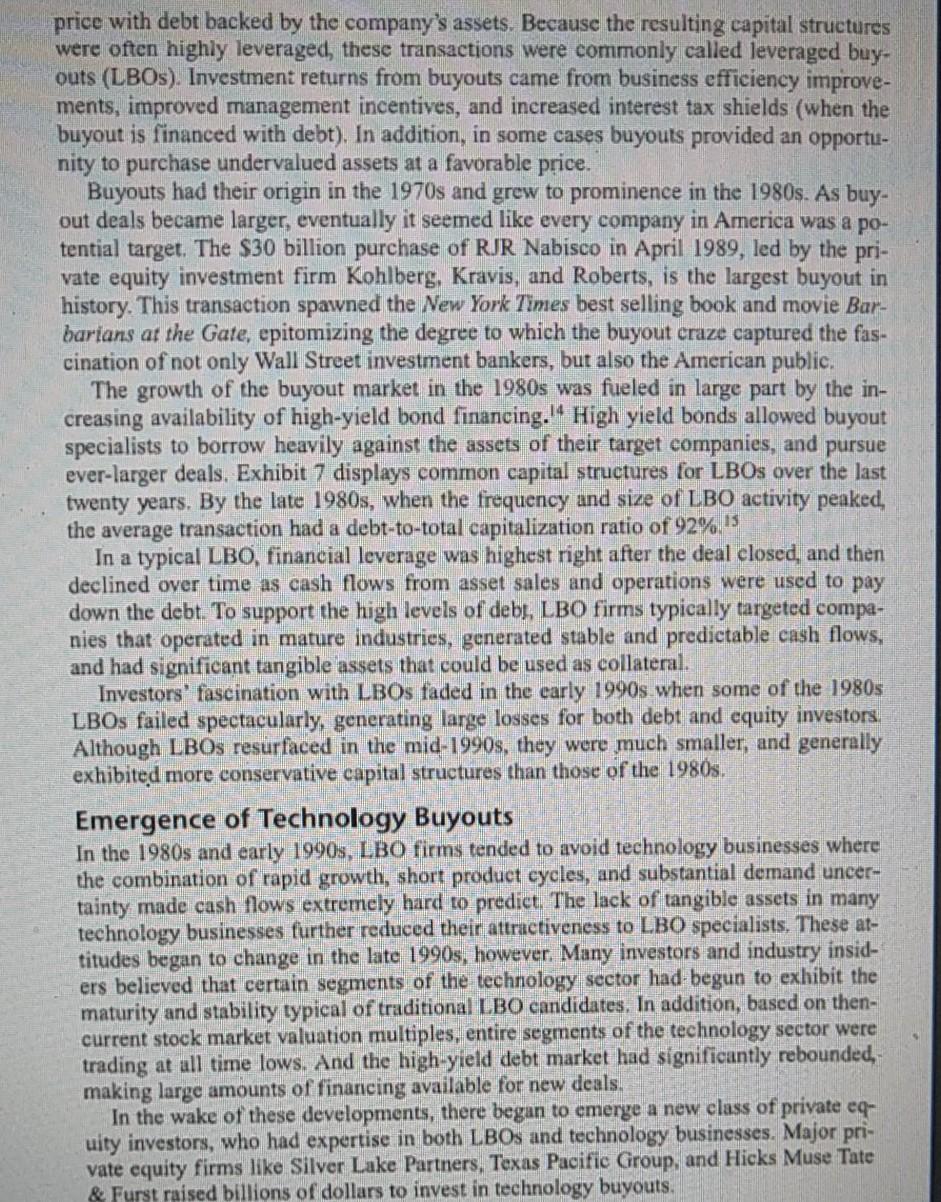
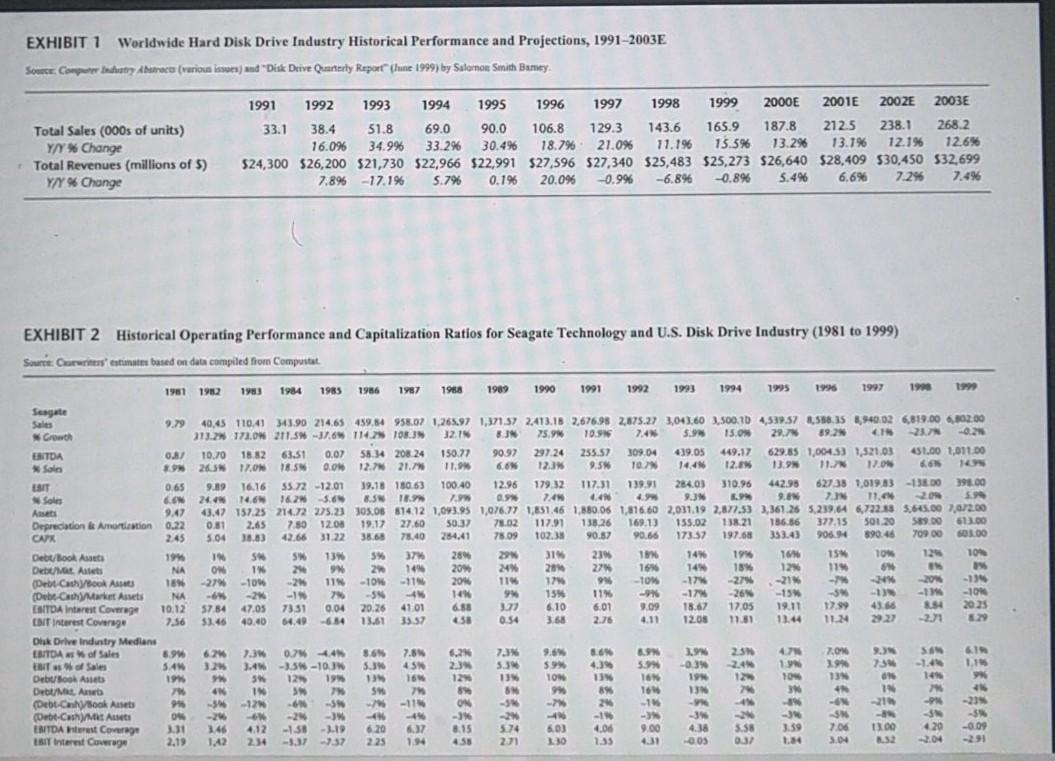
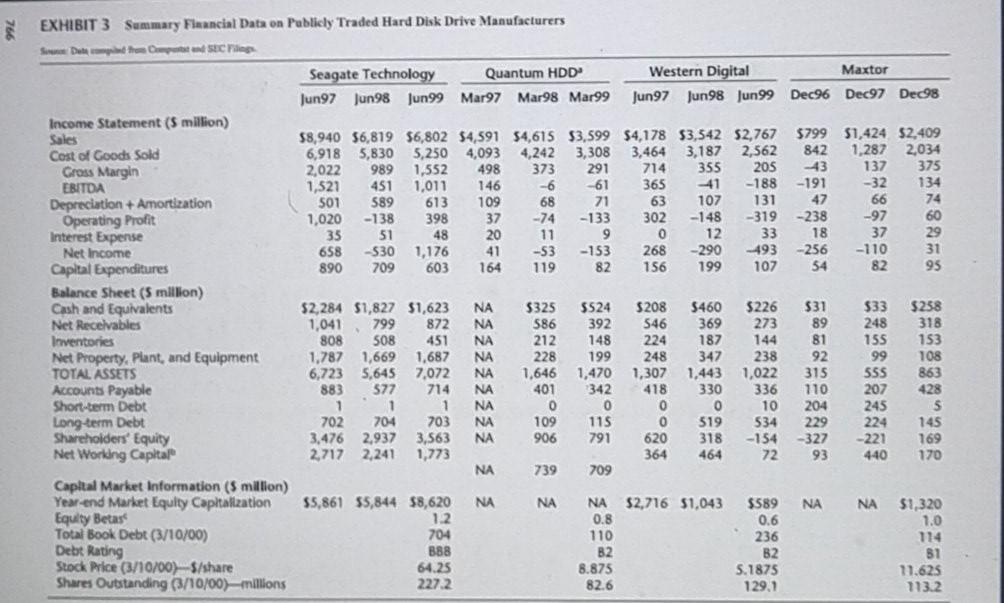
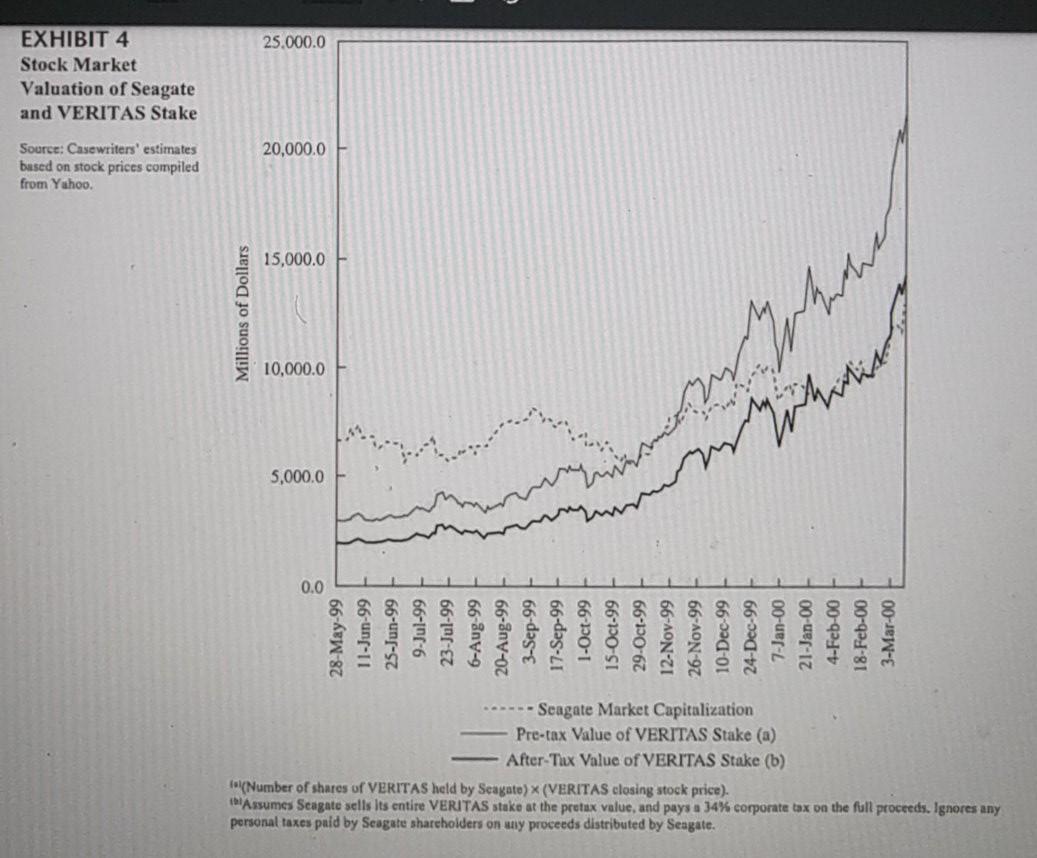
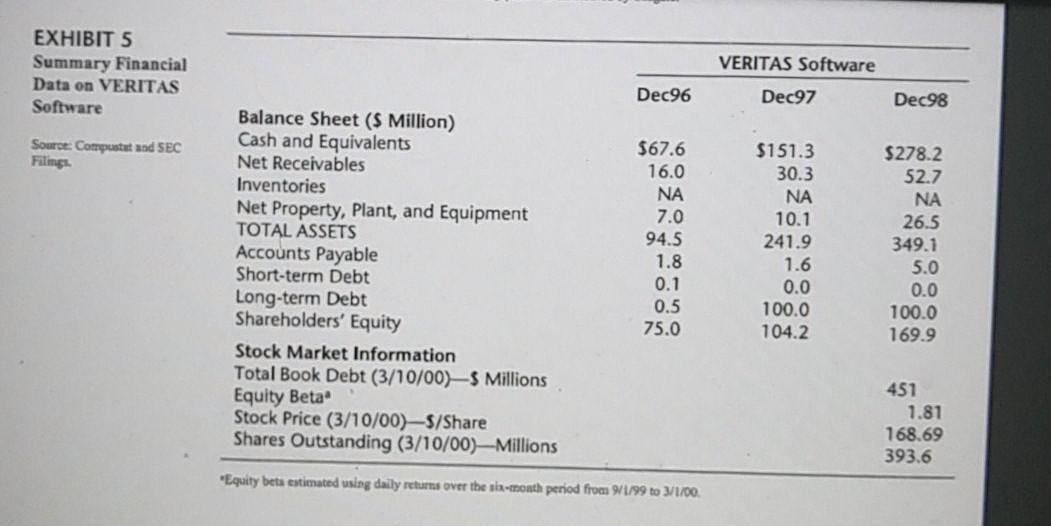
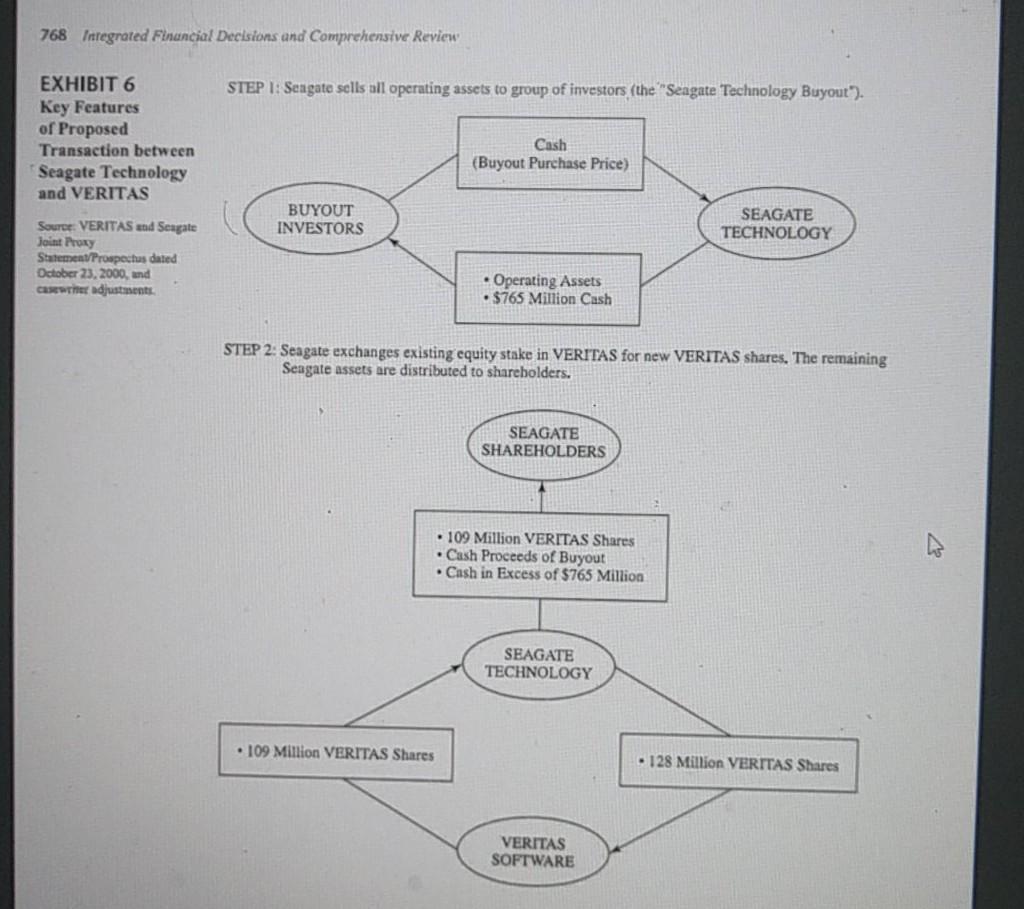
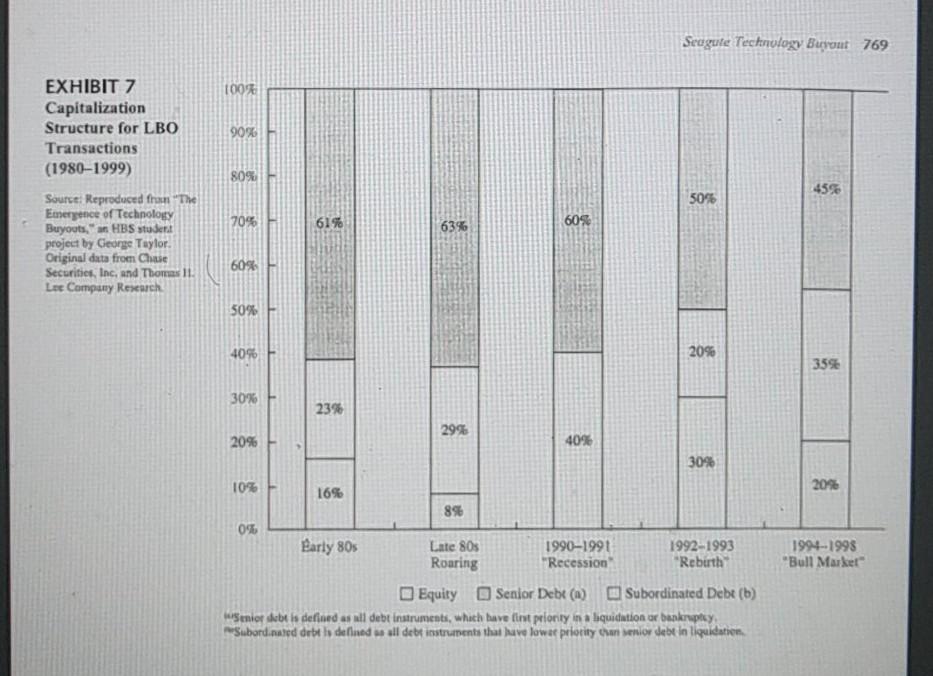
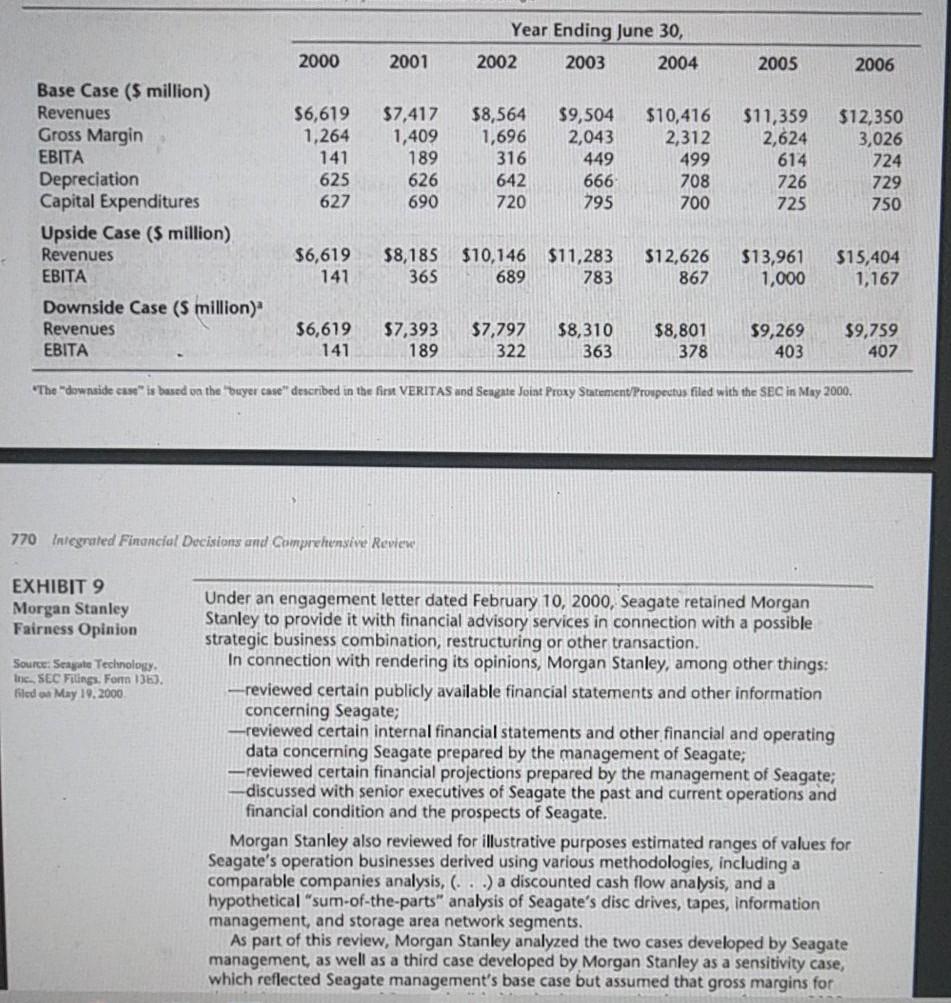
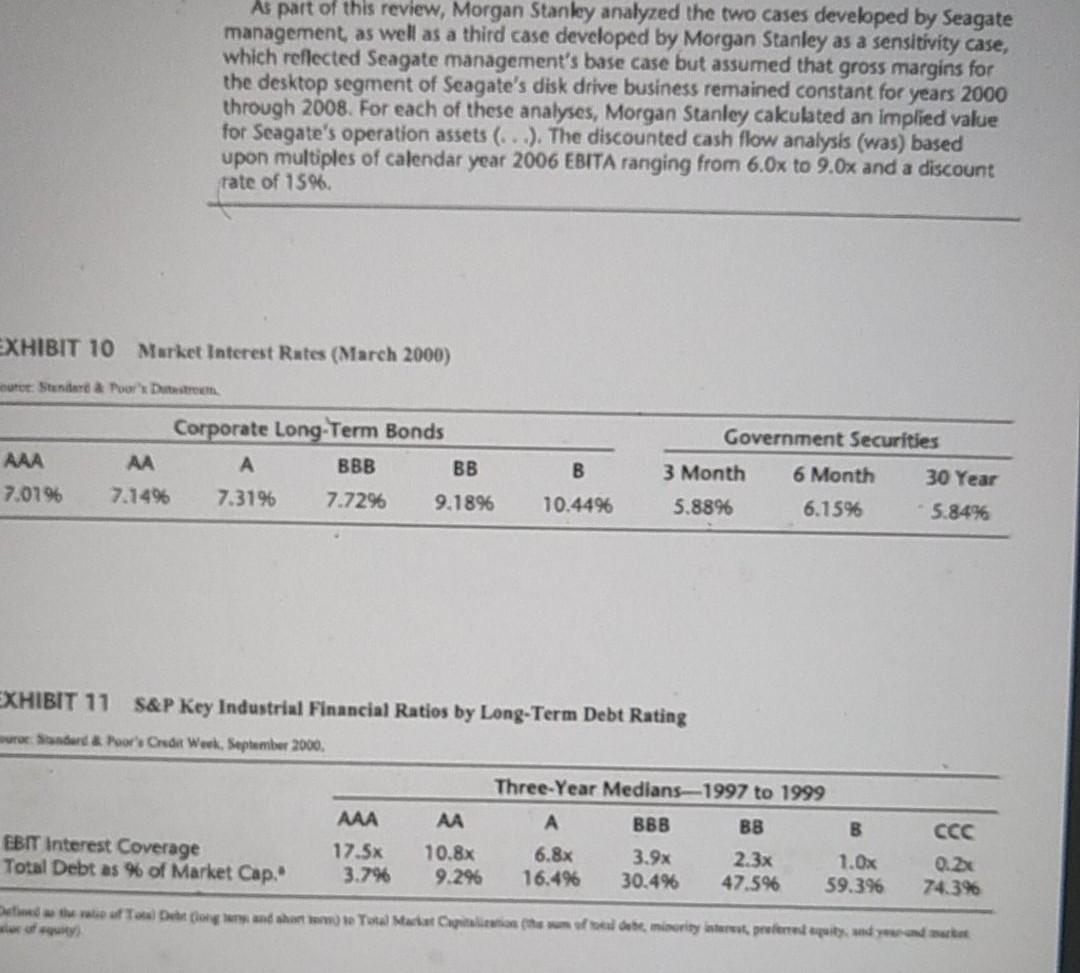
Q1. Pen down the understanding of the business and industry that Seagate Technology is engaged in. (You may use B Canvas Model or Porter's 5 Forces, if you may deem fit) Q2. Prepare the WC Schedule and calculate the change in WC on YoY basis for the forecasted years, as per the information given in Exhibit 8. (You may take appropriate historical assumptions, just mention them properly) Q3. Calculate the cost of Equity. Assume the Equity Risk Premium to be 8.88%. (Hint: In this question you need to calculate the cost of Equity using Unlevered Beta rather than Levered Beta, given in the case. Read about Unlevered Beta and how to calculate it.) Q4. Compute the growth rate of the firm (Hint: Growth Rate = Reinvestment Rate * ROIC; take Reinvestment Rate = 26.54%. The Reinvestment Rate is also calculated by Vansh and Siddhant from an assumption of APV - do read if you want to) Q5. Compute the value of the firm using the information given in Exhibit 8. (Hint: You don't need to subtract interest from EBITDA) [ FCF = EBITA*(1-T) + Dep - A WC - CapEx ] (Don't forget to add PV of TV) Bonus Ques: You may leave this if you want to The value that you computed in Q5 is actually of the unlevered firm. Compute the value of the levered firm by reading about APV. (Hint: Value of Levered Firm = Value of Unlevered Firm + Tax Shield Deht*Tayll Hard disk drives were the most common medium for storing electronic information and data, thus making them the largest sector of the information storage industry. Disk drives were integrated into various products, largely classified into three main markets: Desktop: The desktop market included all desktop personal computers, targeted for either home or business use. For the most part, performance attributes (speed, ca- pacity, etc.) and quality were standardized across disk drive manufacturers. Further- more, there was little disk drive brand awareness at the PC consumer level. As a re- sult, disk drives had become commodities and manufacturers competed largely on - price. Gross margins in the desktop sector were around 10-15%. Enterprise: The enterprise market included high performance workstations, servers, minicomputers, mainframes, and redundant arrays of inexpensive drive (RAID) subsystems. Because most applications and software that ran on enterprise systems were highly computation- and data-intensive (such as CAD/CAM, scien- tific applications, and corporate-wide accounting and payroll systems), manufactur- ers of these disk drive products emphasized performance and reliability, as well as price, as key selling points. The enterprise market was characterized by higher value-added products than those in the desktop market, with higher average gross margins of 20-25%. Mobile: The mobile market included laptop computers, hand-held computers, and personal digital assistants. Mobile disk drives differed from desktop drives in that they were smaller, and were made from more durable materials. Profit margins were higher than in the desktop segment, as products competed on not only price, but also durability and power consumption. In the long run, however, analysts expected the markets for mobile and desktop drives to converge. Table A summarizes worldwide market shares for the major disk drive manufacturers.? Six firms-accounted for 95% of all sales. Competition was intense, with manufacturers fighting for a limited number of major customers. These customers would normally do business with only two or three disk drive suppliers at a time. At the beginning of each new product cycle, which usually lasted from 6 to 12 months, customers would pre-select Total Market Enterprise Desktop TABLE A Market Share in the Worldwide Disk Drive Industry, 1999 41.096 7.2 34.6 b Source: "Dial Drive Quarterly Report" March 2000) by Salomon Smith Barney Number of units shipped Seagate Quantum IBM Maxtor Fujitsu Western Digital Samsung Total sales (Smillions) 21.1% 17.1 14.0 13.3 12.3 11.1 5.9 $25,273 21.1% 20.5 6.1 17.7 12.4 14.6 7.5 $14,627 8.8 3.8 b $7,438 includes mobile, Amount is not material, their suppliers for that cycle, based on pre-announced performance and reliability re- quirements. Therefore, if a disk drive manufacturer did not have new products ready to submit to customers for testing at the time of pre-selection, they could miss up to a year's worth of sales and risk damaging key sales relationships. In the late 1990s, the disk drive industry had benefited from increasing worldwide demand for electronic data storage, but had also experienced fierce price competition. Exhibit I shows that since 1997, while the number of disk drive units sold had grown at rates in the upper teens, prices had dropped dramatically, causing overall revenues to decline. Industry experts did not expect this situation to change. Through the medium- term at least, revenue growth was expected to lag far behind unit growth. As a result, disk drive manufacturers sought new avenues for growing revenues. Two areas in par- ticular appeared promising: Storage Networking With the rapid expansion in Internet use and e-mail, as well as the increasingly data- intensive nature of audio and video-based applications, the amount of data stored was, for the foreseeable future, expected to double every year. As a result, there was increas- ing demand for larger and more efficient data access and storage solutions. Two new storage architectures appeared to be particularly promising in meeting this demand: Storage Area Networks (SAN) and Network Attached Storage (NAS). Both technolo- gies combined arrays of disk drives with sophisticated networking equipment and soft- ware, providing disk drive manufacturers the means to differentiate their products. Consumer Electronics Market Newly developed consumer electronics appliances, requiring storage of large amounts of data, represented a rapidly expanding source of demand for desktop disk drives. Most ap- plications were video-related, such as digital recorders (e.g, Tivo) and video games (e.g., Microsoft's Xbox). While small relative to the traditional disk drive market (analysts pro- jected 2000 sales of $0.5 billion vs. more than $26 billion in the mainstream market), this segment was expected to grow over 50% annually over the next three years. While these areas appeared promising, it was difficult to assess their likely impact on disk drive manufacturers' bottom lines. In consumer electronics, all major disk drive suppliers intended to compete vigorously. Therefore, it was possible that the busi- ness would experience the same fierce competition as the traditional disk drive busi- ness. As for storage networking, disk drive producers would be competing against large established manufacturers of hardware and software, such as IBM, Sun Microsystems, Dell, Compaq, and EMC. Seagate was founded in 1979 by a group of five technology entrepreneurs and execu- tives, whose collective experience included playing a key role in the early develop- ment of hard disk drives. By 2000, Seagate was the leader in the worldwide disk drive industry, with total annual revenues of nearly S7 billion and a market share of 21%. The company designed, manufactured, and marketed a broad line of disk drives for use in computer systems for desktop PCs, workstations and servers, and super- computers. For the fiscal year ending June 1999, 39% of Seagate's sales came from desktop drives and 51% came from enterprise systems. Tape drives and software con- tributed the remaining 10%. Seagate sold its products both to original equipment manufacturers (OEMs) for use in their own computer systems, and through distributors, dealers, and retailers. Sales to OEMs accounted for 65% of Seagate's total disk drive revenues. Drives were produced almost entirely offshore, taking advantage of low-cost labor. In 1997, approximately 80% of Seagate's 111,000 employees were located in Asia. Seagate was the only major independent disk drive manufacturer to be fully vertically integrated. In addition to assembling disk drives, Seagate designed and manufactured most of the key components. Although this necessitated higher R&D and capital ex- penses than those incurred by its competitors (see Exhibits 2 and 3), management be- lieved that vertical integration gave the company some important competitive advantages. First, having control over critical enabling technologiesby developing them in-house---meant that Seagate would not have to depend on independent suppliers to develop those technologies. This eliminated the risk that in an economic downturn, these suppliers might cut back on R&D, reducing Seagate's ability to offer cutting-edge technologies in its products, A second benefit of being vertically integrated was that it gave the company more control over the manufacturing process, allowing it to ramp up production more quickly.in response to unexpected surges in demand. Such ramp-ups could also be achieved at a higher yield (fewer defects coming off the line). When Luczo became COO in 1997, Seagate required 12 weeks to ramp up production to 80% of increased target output, and it was recognizing $200 million every quarter in scrap (defective components or products that were cither destroyed or sent back to manufacturing to be repaired). The ability to ramp up quickly was becoming increasingly important in the disk drive industry, given the sharp decline in product life cycles, and the increasing consolidation of the industry's customers. Finally, management believed that vertical integration allowed the company to maintain lower inventories of disk drive components, since it did not have to worry whether suppliers would be able to provide it with the components during a sudden in- crease in demand, Most financial analysts who covered the disk drive industry disagreed with Sea- gate's views on vertical integration, however. They argued that vertically integrated firms had substantially higher fixed costs, which would hurt them in a downturn. In apparent support of this view, in recent years technology firms like Hewlett-Packard, Cisco, and IBM had increasingly outsourced the manufacture of computer hardware to specialized contract equipment manufacturers, such as Solectron. In theory, these enti- ties could achieve substantial economies of scale by serving the computer industry's combined manufacturing needs. Historically, the financial performance of Seagate and the rest of the disk drive in- dustry had been extremely volatile (Exhibit 2). During slowdowns in PC sales in the mid 1980s, early 1990s, and again in 1997-98, computer manufacturers severely cut back on disk drive purchases. Because of long manufacturing lead times, hard disk producers often ended up with excess capacity and inventory, resulting in price cuts and sharp profit declines. Always known as an efficient, low-cost producer, Seagate fared better than most-it was the only independent disk drive manufacturer to remain profitable in 199293 and again in 1999. A key reason for the company's cost advantage was that, unlike most of its competitors, it maintained a mix of products in both high end and low end markets. The latter included, for example, hard disk drives for PCs. Although the company earned relatively low margins for these products, serving these less glamorous markets on a large scale produced significant scale economies that translated into lower costs for Seagate's other businesses as well. In 1996 and early 1997, Seagate's business experienced a downturn with the rest of the industry, and it launched a broad restructuring effort. Beginning in 1997, Seagate closed or sold selected manufacturing operations in Ireland, Scotland, Malaysia, Mex- ico, and the Philippines. It exited from the mobile disk drive segment, discontinued a number of product lines, and cut back expenditures on new production facilities. As a result of these initiatives, by late 1999 the company's employee headcount had declined by over 20%. An additional casualty was Seagate's co-founder and CEO, Alan Shugart, who was ousted by the board and replaced by Stephen Luczo in July 1998. Luczo and his management team viewed the primary challenge facing Seagate as one of consolidating and expanding the firm's leadership position, not only in hard disk drives, but in general data storage applications. This meant diversifying away from tra- ditional disk drive segments into faster growing and higher margin businesses. The company had already begun supplying WebTV with disk drives, and other consumer electronics applications were being developed. In addition, Seagate began to target network-based storage applications. In January 2000, Seagate made its first major foray into storage networking with the acquisition of privately held XIOtech Corp, a provider of SAN technology. Analysts also expected that Seagate would re-enter the mobile disk drive segment. Currently, there were no independent mobile drive suppliers in the market. However, most computer manufacturers liked to deal with at least two disk drive suppliers, and preferably none that were competitors in the consumer market. Industry analysts be- lieved that a reputable independent supplier could quickly gain significant share in the mobile segment. Because of the higher margins, and the technological proximity and customer overlap between the mobile and desktop drive segments, this would be a po- tentially attractive area for future growth in Seagate's business. Seagate's future business expansion required it to make significant capital invest- ments, however. When Luczo took over as CEO, he felt that the company had been seri- ously under-investing in technology, and correcting this would require large outlays on R&D and improvements in manufacturing capacity. The company estimated that expen- ditures on R&D and capital could be increased by no less than $1-$2 million, a year. With disk drive producers already out of favor in the stock market, obtaining capital for long-term projects from public financial markets could prove to be difficult. By going private, Seagate might be able to aggressively pursue investments that had longer- term payoffs. Roger McNamee, a co-founder of Silver Lake Partners, said that once Seagate was taken private, it would "invest like crazy" in new product development and manufacturing facilities to support the growth of Seagate's core disk drive business. Background of the Buyout Transaction In May 1999, Seagate Technology sold its Network & Storage Management Group (NSMG) to VERITAS Software. In exchange, Seagate received approximately 155 mil- lion shares of VERITAS stock, making it VERITAS's largest stockholder with an own- ership stake over 40%.9 In the six months following the transaction, VERITAS's stock price increased by more than 200%. In contrast, over the same period, Seagate's stock price increased by 25%. Seagate's board was concerned that the market was not recognizing the full po- tential value of the company's VERITAS stake. At times, the value of Seagate's stake in VERITAS exceeded the entire market value of Seagate's equity. (See Exhibit 4 for a stock price history of Seagate and VERITAS, and Exhibit 5 for selected financial in- formation about VERITAS.) The market appeared to be assigning no value-even a negative value-to Seagate's disk drive business, despite its large size and market- leading position. Management realized it had to act quickly to address the situation. The company had been receiving numerous inquiries from concerned stockholders. And it was be- coming more difficult to provide proper incentives to employees. Although Seagate employees held significant amounts of stock options and restricted stock in the com- pany, the increasing market value of the VERITAS stake meant that Seagate stock price was becoming increasingly tied to VERITAS) stock price and less to the per- formance of Seagate's core disk drive business. As a result, senior management began to consider ways to increase the stock price and unlock the value that it saw in the VERITAS stake and disk drive operations. The company sold some VERITAS shares and repurchased its own shares in the open mar ket. However, both actions proved ineffective. Seagate's ability to sell off its VERITAS stake was limited by prior agreement with VERITAS (which feared that such sales would depress its own stock price), and the fact that such sales were taxable. Repur- chasing Seagate stock had little impact on the stock price. In late October, the board of directors authorized Luczo to engage Morgan Stanley to advise the company on its options for increasing Seagate stock price. A major cod- sideration in any analysis of Seagates options was the potentially huge tax liability that would be created-at both the corporate and personal levels--if Seagate simply sold its VERITAS shares, or distributed those sharcs to Seagate shareholders. 10 In early November, Morgan Stanley arranged a meeting between Luczo and represen- tatives of Silver Lake Partners, a successful private equity firm that had extensive experi- ence investing in technology businesses. After several months of discussion and analysis, the Silver Lake group, led by James Davidson, Glenn Hutchins, David Roux, and Inte- gral Capital Partners, produced a proposal that would necessitate Seagate separating its disk drive operations from its VERITAS stake without triggering the punitive tax liability, The proposal was a complicated two-stage transaction (see Exhibit 6). In the first stage, Seagate would sell all of its disk drive manufacturing assets, including approxi- mately $765 million of cash, to a newly formed company (Suez Acquisition Com- pany") controlled by Silver Lake. The purchase price would be financed with a combi- nation of equity (put up by Silver Lake and a group of other private equity investors'!) and a significant but as yet undetermined amount of debt. Thus Silver Lake proposed to take Seagate's disk drive business private in a leveraged buyout (LBO). In the second stage of the transaction, the remaining Seagate shell corporation, whose assets would then consist of 128,059,966 VERITAS shares, a few miscellaneous equity investments, and proceeds from the Seagate buyout, would be merged with VERITAS through a tax-free stock swap. 12 Under terms of the agreement, each share of Seagate stock would be exchanged for a combination of cash and VERITAS shares. 13 VERITAS executives indicated they would be interested in acquiring the Sea- gate shell corporation in exchange for 109,330,300 VERITAS shares. Provided the merger qualified as a "reorganization" under Section 368(a) of the Internal Revenue Code, no corporate or personal tax liability would be created by the deal. Silver Lake had great confidence in the abilities of Seagate's current management team. On average, Seagate's top executives had over 10 years of experience in the disk drive industry. Therefore as an important condition of the deal, the six top managers, including Luczo and Charles Pope, Seagate's chief financial officer, had to continue in these roles, and convert a portion of their Seagate equity into new equity and deferred compensation of the company that would operate the disk drive business. The Buyout Market The term "buyout" refers to the purchase, typically by a group of private investors, of a controlling stake in a company's equity. The traditional buyout model involved a group of investors purchasing a company or a division of a larger company, employing a small amount of equity (the investor's own capital), and financing most of the purchase price with debt backed by the company's assets. Because the resulting capital structures were often highly leveraged, these transactions were commonly called leveraged buy. outs (LBOs). Investment returns from buyouts came from business efficiency improve- ments, improved management incentives, and increased interest tax shields (when the buyout is financed with debt). In addition, in some cases buyouts provided an opportu- nity to purchase undervalued assets at a favorable price. Buyouts had their origin in the 1970s and grew to prominence in the 1980s. As buy- out deals became larger, eventually it seemed like every company in America was a po- tential target. The $30 billion purchase of RJR Nabisco in April 1989, led by the pri- vate equity investment firm Kohlberg, Kravis, and Roberts, is the largest buyout in history. This transaction spawned the New York Times best selling book and movie Bar- barians at the Gate, epitomizing the degree to which the buyout craze captured the fas- cination of not only Wall Street investment bankers, but also the American public. The growth of the buyout market in the 1980s was fueled in large part by the in- creasing availability of high-yield bond financing.* High yield bonds allowed buyout specialists to borrow heavily against the assets of their target companies, and pursue ever-larger deals. Exhibit 7 displays common capital structures for LBOs over the last twenty years. By the late 1980s, when the frequency and size of LBO activity peaked, the average transaction had a debt-to-total capitalization ratio of 92%." In a typical LBO, financial leverage was highest right after the deal closed, and then declined over time as cash flows from asset sales and operations were used to pay down the debt. To support the high levels of debs, LBO firms typically targeted compa- nies that operated in mature industries, generated stable and predictable cash flows, and had significant tangible assets that could be used as collateral. Investors' fascination with LBOs faded in the early 1990s when some of the 1980s LBOs failed spectacularly, generating large losses for both debt and equity investors. Although LBOs resurfaced in the mid-1990s, they were much smaller, and generally exhibited more conservative capital structures than those of the 1980s. Emergence of Technology Buyouts In the 1980s and early 1990s, LBO firms tended to avoid technology businesses where the combination of rapid growth, short product cycles, and substantial demand uncer- tainty made cash flows extremely hard to predict. The lack of tangible assets in many technology businesses further reduced their attractiveness to LBO specialists. These ar- titudes began to change in the late 1990s, however. Many investors and industry insid- ers believed that certain segments of the technology sector had begun to exhibit the maturity and stability typical of traditional LBO candidates. In addition, based on then- current stock market valuation multiples, entire segments of the technology sector were trading at all time lows. And the high-yield debt market had significantly rebounded- making large amounts of financing available for new deals. In the wake of these developments, there began to emerge a new class of private eq- uity investors, who had expertise in both LBOs and technology businesses. Major pri- vate equity firms like Silver Lake Partners, Texas Pacific Group, and Hicks Muse Tate & Furst raised billions of dollars to invest in technology buyouts, Against this backdrop, Silver Lake began to investigate the possibility of acquiring Sea- gate's disk drive operations. Due to Seagate's size, market capitalization, and industry- leading position, the proposed buyout had the potential to become a landmark transaction, similar in stature to the RJR Nabisco deal in 1989. The characteristics of the disk drive business, which Luczo would describe as "the extreme sport of technology,"16 did not make it an easy place to do LBOs, however. Price competition was intense, product life cycles were extremely short (often under six months), and the technological sophistication of disk drives required large expendi- tures on R&D. R&D was the lifeblood of the business, as being the first to introduce a new product or innovation generally made the difference between making or losing money. In addition, to win business, a disk drive manufacturer had to be able to pro- duce an order to a customer's specifications quickly and on a large scale. This required significant investment in manufacturing capacity. Like the expenditures on R&D, this investment would use up scarce cash and make it more difficult to support a relatively high debt load, as found in traditional LBO structures. In addition to all this, Seagate's disk drive business was highly vertically integrated, which also required significant investment in R&D and capital equipment. Thus Sea- gate appeared to be particularly unsuited for an LBO, Seagate's disk drive business had a number of characteristics that might allow it to do well as an LBO, however. Management believed that being vertically integrated gave the company a strong competitive advantage, allowing it to respond more quickly to changes in technology and customer demands, and avoid costly supply chain disruptions. And high R&D and capital expenditures, while using up cash, could also give the company a competitive advantage, by deterring new entry by smaller, less well-capitalized competitors. The Silver Lake team was also extremely optimistic about the disk drive industry's prospects. For the last two years the firm had come to the view that data storage was going to be the wave of the future in technology. Disk drives were the key technologi- cal component in a growing number of hardware products, including workstations and related technologies that managed and processed data. As Glenn Hutchins, one of Sil- ver Lake's principals, would say: "If there's going to be an information superhighway, we're going to need plenty of parking lots." Closing the Deal Silver Lake's proposal offered a potentially attractive solution to Seagate difficulties. However, the buyout group still had to determine how much to pay for the disk drive operations and how to finance the deal. As part of this process, the group intensively analyzed Seagate's historical financial performance and that of its competitors (Ex- hibits 2 and 3). In addition, it developed detailed financial projections for Seagate fol- lowing the buyout and merger (Exhibit 8). Despite continued competitive pressure in its traditional disk drive segments, rev- enues and profits were expected to grow as Seagate re-entered the mobile disk drive segment and capitalized on its foray into SAN and NAS storage networking. Capital expenditures were projected to continue rising through 2003 as Seagate invested in Existand comprehensive Rere 18 these new opportunities, but were projected to drop thereafter. Net noncash operating working capital used in the disk drive business had historically been about zero, These base case projections represented a "best guess concerning performance, and thus summarized expectations for the future. However, to assess the sensitivity of the valuation to the underlying growth assumptions, both "upside and downside" projections were generated. Excerpts from the valuation performed by Seagate's finan- cial advisor, Morgan Stanley, are shown in Exhibit 9. Another decision that the buyout team had to make involved the capital structure of the new entity. In order to maximize the return on their equity investments, LBOs had traditionally employed large amounts of debt and maintained small cash balances. Given the volatility of disk drive profits, a prudent capital structure for this transaction would be more conservative (i.e., less leveraged) than that of traditional LBOs. The challenge was to weigh the possible benefits of higher debt against the potential costs. Seagate's access to future financing would probably be enhanced if it were able to maintain an investment grade rating of BBB or better throughout the projection period. Therefore, credit rating agencies' assessment of Seagate's debt post-buyout would no doubt be an important consideration in the buyout team's analysis. Exhibit 10 contains information on long-term interest rates for different credit rat- ings, as of March 2000. Exhibit 11 reports median coverage and leverage ratios, by S&P debt rating, for a large sample of industrial issuers. However S&P explicitly points out "financial ratios are viewed in the context of a firm's business risk. A com- pany with more predictable cash flows can afford to undertake added financial risk while maintaining the same credit rating."1 Conversely, companies with above av- erage business risk and less predictable cash flows would need higher coverage and lower leverage than the figures reported in Exhibit 11 to attain a given rating. A final consideration was that the buyout could not proceed unless VERITAS share- holders approved the second-stage merger. Therefore it would be necessary to offer them a sufficiently attractive return for acquiring the remaining assets of Seagate (mainly 128 million VERITAS shares) after the disk drive business had been sold. EXHIBIT 1 Worldwide Hard Disk Drive Industry Historical Performance and Projections, 1991-2003E Source Company Atrace (various issues and Disk Drive Quarterly Report"une 1999) by Salomon Smith Baney 1991 Total Sales (000s of units) Y/Y Change Total Revenues (millions of 5) YY% Change 1992 1993 1994 1995 1996 1997 1998 1999 2000E 2001E 2002E 2003E 33.1 38.4 51.8 69.0 90.0 106.8 129.3 143.6 165.9 187.8 2125 238.1 268.2 16.0% 34.996 33.296 30.4% 18.7% 21.0% 11.1% 15.5% 13.296 13.1% 12.196 12.6% $24,300 $26,200 $21,730 $22,966 $22.991 $27,596 527,340 $25,483 $25,273 $26,640 $28,409 $30,450 $32,699 7.896-17.1% 5.796 0.196 20.0% -0.9% -6.896 -0.896 5.4% 6.6% 7.29 7.4% EXHIBIT 2 Historical Operating Performance and Capitalization Ratios for Seagate Technology and U.S. Disk Drive Industry (1981 to 1999) Source: Cartes estate based on data compiled from Computat ETOA 1981 1982 1983 1984 1985 1986 1987 1988 1989 1990 1991 1992 1993 1994 1995 1995 1992 Seagate Sales 9.79 40,45 110.41 343.90 214,65 459.84 958.07 1,265.97 1,371.3 2.413.13 2,676.98 2,675.22 3,043,60 3,500.1D 4,539.57 8.558.15 8.940,02 6819.00 4.502.00 Growth 213.2 171.0W 211.5W-37.6114.2N TORN J2IN SIN 75.9 10.9 7.4 5.9 15.09 29. CIN -23 . 0.8 10.70 18.32 63.51 0.07 58.34 208.24 150.27 90.97 297.24 255.57 309.04 439.05 449.17 629.85 1,004,53 1,521.03 31.00 1,011.00 Solo 3.9N 20N 17.0W 18.5 0.00 12.7 21.7% 11.9 6.6% 12.3 9.5W TON 144N 12.IN 13.9N 11.N 12.0N 6.61 ESIT 0.65 9.89 16.16 55.72 -12.01 19.18 180.63 100.40 12.96 179.32 117.31 139.91 2840) 310.95 442.98 627.38 1.019.83 -13.00 390.00 Soles CON 24 14.6N 162 3.6 BSN TEN 7.95 0.95 2.49 44 9.JN 9. IN 11.09 200 Anet 9.47 43.47 157.25 214.72 275.23 305.06 814 12 1,093.95 1,076.77 1,851.46 1,350,06 1,816,60 2,031.19 2.877,53 3,361.26 5.239.64 6,722.88 5.645.00 7,072.00 Deprecation & Amortation 0.22 0.81 2,65 7.50 12.00 19.12 27.60 50.37 78.02 117.91 138.26 169.13 155.02 13821 186.86 377.15 501.20 569.00 613.00 CAIX 2.45 5.04 38.53 42.66 31.22 38.68 76.40 254.41 78.09 102.38 90.57 90.66 173.57 197.68 353.4) 90694 890.46 709 00 SO100 DeoBook Assets 199 IN SW SW 13 5% 37 289 23N 18 14 194 16 15 TON 100 Deb/ Mr. As NA ON TN 9W 2 14% 20% 2013 27 16% 14 18% 12 11N 6 IN ON (Debt-Cash Book AS 18N -27 -10 -2 11 -101 -111 2016 11 179 99 -TOM -17 -21 - 201 - (Debt-Market Assets NA - -2W - N -5 - 15% 11% - -17 -26 -13 -100 ETDA Interest Coverage 10.12 57.84 47.05 73.51 0.04 20.26 4101 6.88 32 6.10 6:01 9.09 18.67 17.05 19.11 12.99 43.66 3184 2025 INT Intrest Coverage 7.56 33.46 40.40 64.49 13.61 35.37 458 0.54 2.76 4.11 12.08 11.44 112 8.29 Dhak Drive Industry Medians EBITDA s of Sales 8.99 62% 7.3% 0.7 4.49 8.6% 7.89 6.2 7.3 9.69 86 1. 2.5 4 2.0 SON EBIT of Sales 54N 3.24 3.4-3.5% -10.3 5. 45 2.3 5.3 59% 4.) 5.99 -0.3% 19 3.94 7.3 1,19 Debok Asit 19 12 19 16 12 10 13 16 19 12 TON IN os 14 DeMt Aneb W 4N IN SM 7 ON 99 89 16 IN ON 4N IN 4 (Debt-took At 9% -34-12 -6N -- -N-111 ON -14 -IN -ON 211 - (Debt-Cast Anti ON -2 - -) -4 44 -) AN -18 -- -3 - - SN EBITDA st Coverage - 3.31 146 4.12 -1.58 B.ID 6.20 637 8.15 5.74 60) 4.06 9.00 4.38 3.58 3.59 7.00 ESIT interest Coverage 13.00 -0.09 2,19 1.42 2.34 -3.3 -1.37 2.25 1.94 455 21 130 1.35 4.31 -0.05 0.37 1.84 3.04 22 -2.04 -2.91 24 EXHIBIT 3 Summary Financial Data on Publicly Traded Hard Disk Drive Manufacturers Deleg Seagate Technology Quantum HDD Jun97 Jun98 Jun99 Mar97 Mar98 Mar99 Western Digital Maxtor Jun97 Jun98 Jun99 Dec96 Dec97 Dec98 3,308 58,940 56,819 56,802 $4,591 54,615 $3,599 $4,178 $3,542 52,767 6,918 5,830 5,250 4,093 4,242 3,464 3,187 2,562 2,022 989 1,552 498 373 291 714 355 205 1,521 451 1,011 146 -6 -61 365 -188 501 -41 589 613 109 68 71 63 107 131 - 138 398 37 --74 -133 302 -319 35 51 48 20 11 9 12 33 658 -530 1,176 41 -53 -153 268 -290 -493 890 709 603 164 119 82 156 199 107 $799 $1,424 $2,409 842 1,287 2,034 43 137 375 -191 -32 134 47 66 74 --238 -97 60 18 37 29 -256 -110 31 54 82 95 1.020 -148 Income Statement (5 million) Sales Cost of Goods Sold Gross Margin EBITDA Depreciation + Amortization Operating Profit Interest Expense Net Income Capital Expenditures Balance Sheet (5 million) Cash and Equivalents Net Recelvables Inventories Net Property, plant, and Equipment TOTAL ASSETS Accounts Payable Short-term Debt Long-term Debt Shareholders' Equity Net Working Capital Capital Market Information (5 million) Year-end Market Equity Capitalization Equity Betas Total Book Debt (3/10/00) Debt Rating Stock Price (3/10/00) S/share Shares Outstanding (3/10/00) millions $2,284 51,827 $1,623 1,041 799 872 808 508 451 1,787 1,669 1,687 6,723 5,645 7,072 883 577 714 1 1 702 704 703 3,476 2.937 3,563 2,717 2,241 1,773 NA NA NA NA NA NA NA NA NA $325 586 212 228 1,646 401 0 109 906 $524 392 148 199 1,470 342 0 115 791 5208 546 224 248 1,307 418 0 5460 369 187 347 1,443 330 0 519 318 464 $226 273 144 238 1,022 336 10 534 -154 72 $31 89 81 92 315 110 204 229 -327 93 $33 248 155 99 555 207 245 224 -221 440 $258 318 153 108 863 428 620 364 145 169 170 NA 739 709 NA NA $2,716 51,043 NA NA $5,861 55,844 $8,620 1.2 704 388 64.25 227.2 NA 0.8 110 B2 8.875 82.6 $589 0.6 236 B2 5.1875 129.1 $1,320 1.0 114 81 11.625 113.2 25.000.0 EXHIBIT 4 Stock Market Valuation of Seagate and VERITAS Stake 20,000.0 Source: Casewriters' estimates based on stock prices compiled from Yahoo 15,000.0 Millions of Dollars 10,000.0 wwwww Munich 5,000.0 0.0 28-May-99 11-Jun-99 25-Jun-99 9-Jul-99 23-Jul-99 6-Aug-99 20-Aug-99 18-Feb-00 3-Mar-00 Seagate Market Capitalization Pre-tax Value of VERITAS Stake (a) After-Tux Value of VERITAS Stake (b) *(Number of shares of VERITAS held by Seagato) X (VERITAS closing stock price). Assumes Seagate sells its entire VERITAS stake at the pretux value, and pays a 34% corporate tax on the full proceeds. Ignores any personal taxes paid by Seagate shareholders on any proceeds distributed by Seagate. EXHIBIT 5 Summary Financial Data on VERITAS Software VERITAS Software Dec96 Dec97 Dec98 Source: Computut and SEC Filings Balance Sheet ($ Million) Cash and Equivalents Net Receivables Inventories Net Property, Plant, and Equipment TOTAL ASSETS Accounts Payable Short-term Debt Long-term Debt Shareholders' Equity Stock Market Information Total Book Debt (3/10/00)-5 Millions Equity Beta Stock Price (3/10/00)-S/Share Shares Outstanding (3/10/00)-Millions $67.6 16.0 NA 7.0 94.5 1.8 0.1 0.5 75.0 $151.3 30.3 NA 10.1 241.9 1.6 0.0 100.0 104.2 $278.2 52.7 NA 26.5 349.1 5.0 0.0 100.0 169.9 451 1.81 168.69 393.6 "Equity beta estimated using daily returns over the sia-month period from 91/99 to 3/1/00 768 Integrated Financial Decisions and Comprehensive Review STEP 1: Seagate sells all operating assets to group of investors (the "Seagate Technology Buyout"). EXHIBIT 6 Key Features of Proposed Transaction between Seagate Technology and VERITAS Cash (Buyout Purchase Price) BUYOUT INVESTORS SEAGATE TECHNOLOGY Source: VERITAS and Seagate Joint Proxy Statement Prospectus dated October 23, 2000, and Casewrher adjustments Operating Assets $765 Million Cash STEP 2: Seagate exchanges existing equity stake in VERITAS for new VERITAS shares. The remaining Seagate assets are distributed to shareholders. SEAGATE SHAREHOLDERS 109 Million VERITAS Shares Cash Proceeds of Buyout Cash in Excess of $765 Million SEAGATE TECHNOLOGY 109 Million VERITAS Shares 128 Million VERITAS Shares VERITAS SOFTWARE Seagule Technology Buyout 769 1001 90% 80% EXHIBIT 7 Capitalization Structure for LBO Transactions (1980-1999) Source: Reproduced from "The Emergence of Technology Buyouts, an HBS studera project by George Taylor. Original data from Chase Securities, Inc. and Thomas 11. Lee Company Research 45% 50% 70% 61% 63% 60% 60% 50% 4096 20% 359 20% 30% 23% 29% 20% 40% 30% 10% 16% 896 0% Barly 80s Late 80s 1990-1991 1992-1993 Roaring "Recession "Rebirth Equity Senior Debe (a) Subordinated Debe (b) microbe is defined as all debt instruments, which have fint priorly in a lquidation or bankruptcy, Subordinated debt le defined us all debt instruments that have lower priority can senior debe in liquidation 1994-1998 "Bull Market Year Ending June 30, 2002 2003 2004 2000 2001 2005 2006 $6,619 1,264 141 625 627 $7,417 1,409 189 626 690 $8,564 1,696 316 642 720 $9,504 2,043 449 666 795 $10,416 2,312 499 708 700 $11,359 2,624 614 726 725 $12,350 3,026 724 729 750 Base Case (5 million) Revenues Gross Margin EBITA Depreciation Capital Expenditures Upside Case (5 million) Revenues EBITA Downside Case (S million) Revenues EBITA $6,619 141 $8,185 $10,146 $11,283 365 689 783 $12,626 867 $13,961 1,000 $15,404 1,167 $6,619 141 $7,393 189 $7,797 322 $8,310 363 $8,801 378 $9,269 403 $9,759 407 "The "downside case" is based on the buyer case" described in the first VERITAS and Sengate Joint Proxy Statement Prospectus filed with the SEC in May 2000 770 Integrated Financial Decisions and comprehensive Review EXHIBIT 9 Morgan Stanley Fairness Opinion Source: Seagate Technology, tric. SEC Filings. For 135). filed on May 19, 2000 Under an engagement letter dated February 10, 2000, Seagate retained Morgan Stanley to provide it with financial advisory services in connection with a possible strategic business combination, restructuring or other transaction. In connection with rendering its opinions, Morgan Stanley, among other things: --reviewed certain publicly available financial statements and other information concerning Seagate; -reviewed certain internal financial statements and other financial and operating data concerning Seagate prepared by the management of Seagate; -reviewed certain financial projections prepared by the management of Seagate; -discussed with senior executives of Seagate the past and current operations and financial condition and the prospects of Seagate. Morgan Stanley also reviewed for illustrative purposes estimated ranges of values for Seagate's operation businesses derived using various methodologies, including a comparable companies analysis, (...) a discounted cash flow analysis, and a hypothetical "sum-of-the-parts" analysis of Seagate's disc drives, tapes, information management, and storage area network segments. As part of this review, Morgan Stanley analyzed the two cases developed by Seagate management, as well as a third case developed by Morgan Stanley as a sensitivity case, which reflected Seagate management's base case but assumed that gross margins for As part of this review, Morgan Stanley analyzed the two cases developed by Seagate management as well as a third case developed by Morgan Stanley as a sensitivity case, which reflected Seagate management's base case but assumed that gross margins for the desktop segment of Seagate's disk drive business remained constant for years 2000 through 2008. For each of these analyses, Morgan Stanley cakulated an implied value for Seagate's operation assets (...). The discounted cash flow analysis (was) based upon multiples of calendar year 2006 EBITA ranging from 6.0x to 9.0x and a discount rate of 15%. EXHIBIT 10 Market Interest Rates (March 2000) Standard & Poor's Detroit 7.01% Corporate Long-Term Bonds A BBB BB 7.1496 7.31% 7.72% 9.1896 B. Government Securities 3 Month 6 Month 30 Year 5.88% 6.15% 5.84% 10.4496 EXHIBIT 11 S&P Key Industrial Financial Ratios by Long-Term Debt Rating andard & Poor's Credit Work, September 2000, Three-Year Medians-1997 to 1999 MA BBB BB B EBIT Interest Coverage 17.5x 10.8x 6.8x 3.9x 2.3x 1.0x Total Debt as % of Market Cap." 3.7% 9.296 16.4% 30.4% 47.5% 59.396 CCC 0.2 74.396 ed the ratio of Tolong and share to Total Media Catalans holde minority interes preferred muity and conduct w
Step by Step Solution
There are 3 Steps involved in it
Step: 1

Get Instant Access to Expert-Tailored Solutions
See step-by-step solutions with expert insights and AI powered tools for academic success
Step: 2

Step: 3
Ace Your Homework with AI
Get the answers you need in no time with our AI-driven, step-by-step assistance
Get Started
Finance And Sustainability Proceedings From The Finance And Sustainability Conference Wroclaw 2017
Authors: Agnieszka Bem, Karolina Daszy?ska-?ygad?o , Ta?ána Hajdíková, Péter Juhász
1st Edition
3319922270,3319922289