

Answered step by step
Verified Expert Solution
Question
1 Approved Answer
ole 2 contains the results (ie. TOTAL COSTS) of 200 simulation trials for each of 2 (Two) projects (Project A and Using Second Order Stochastic
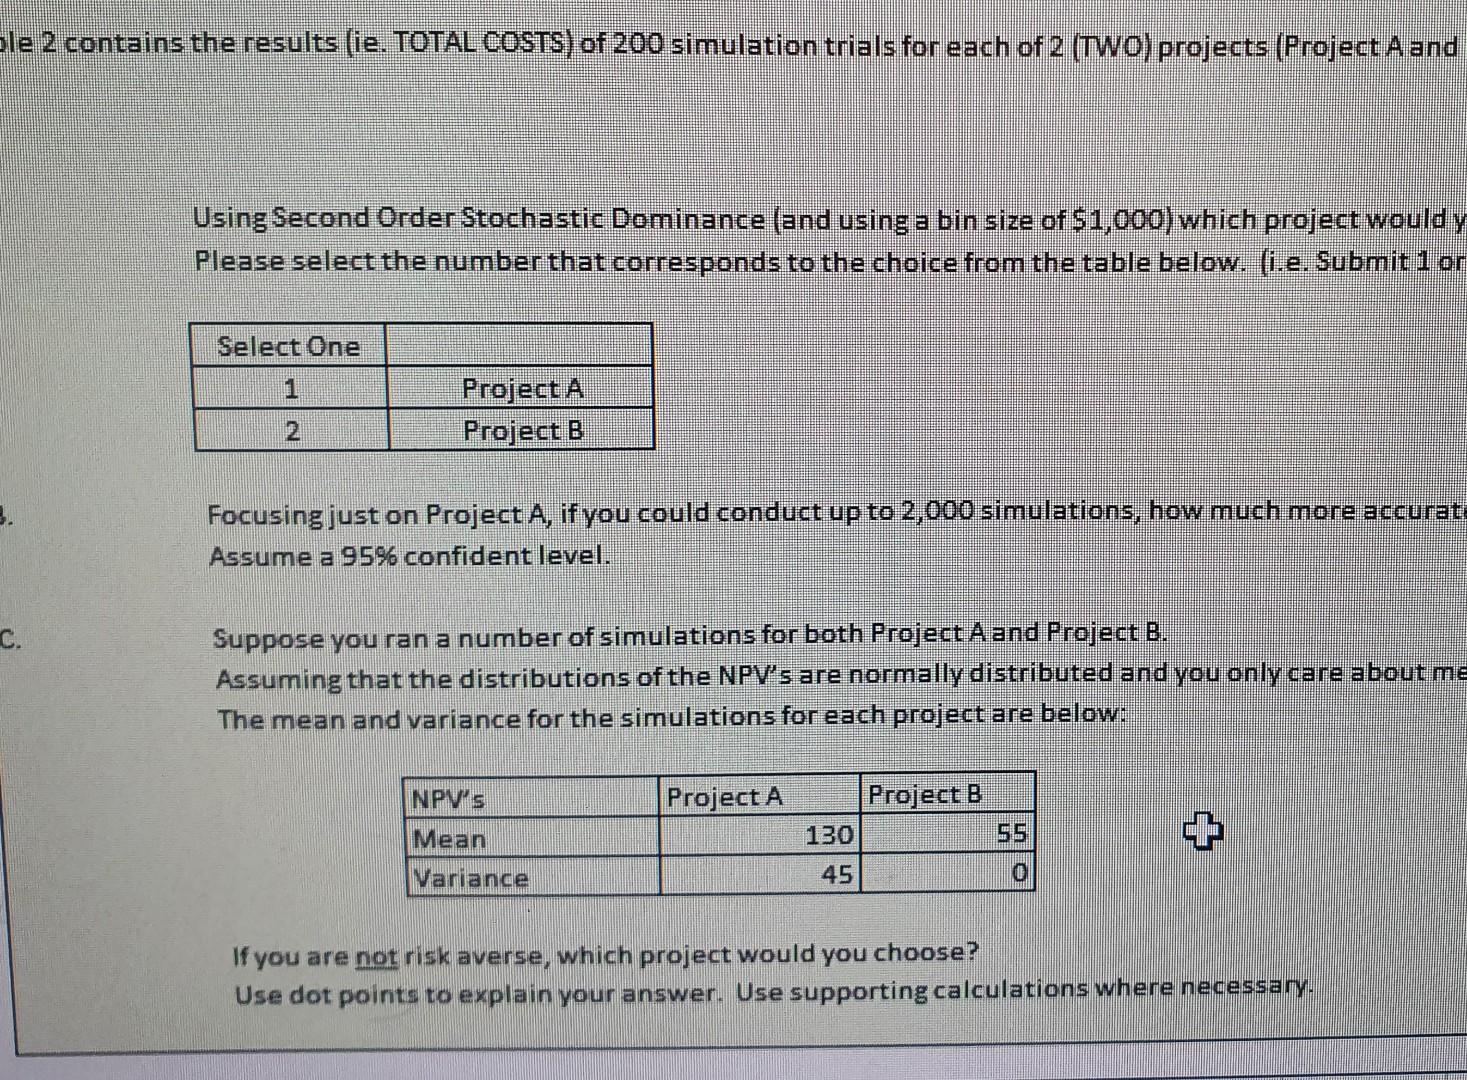
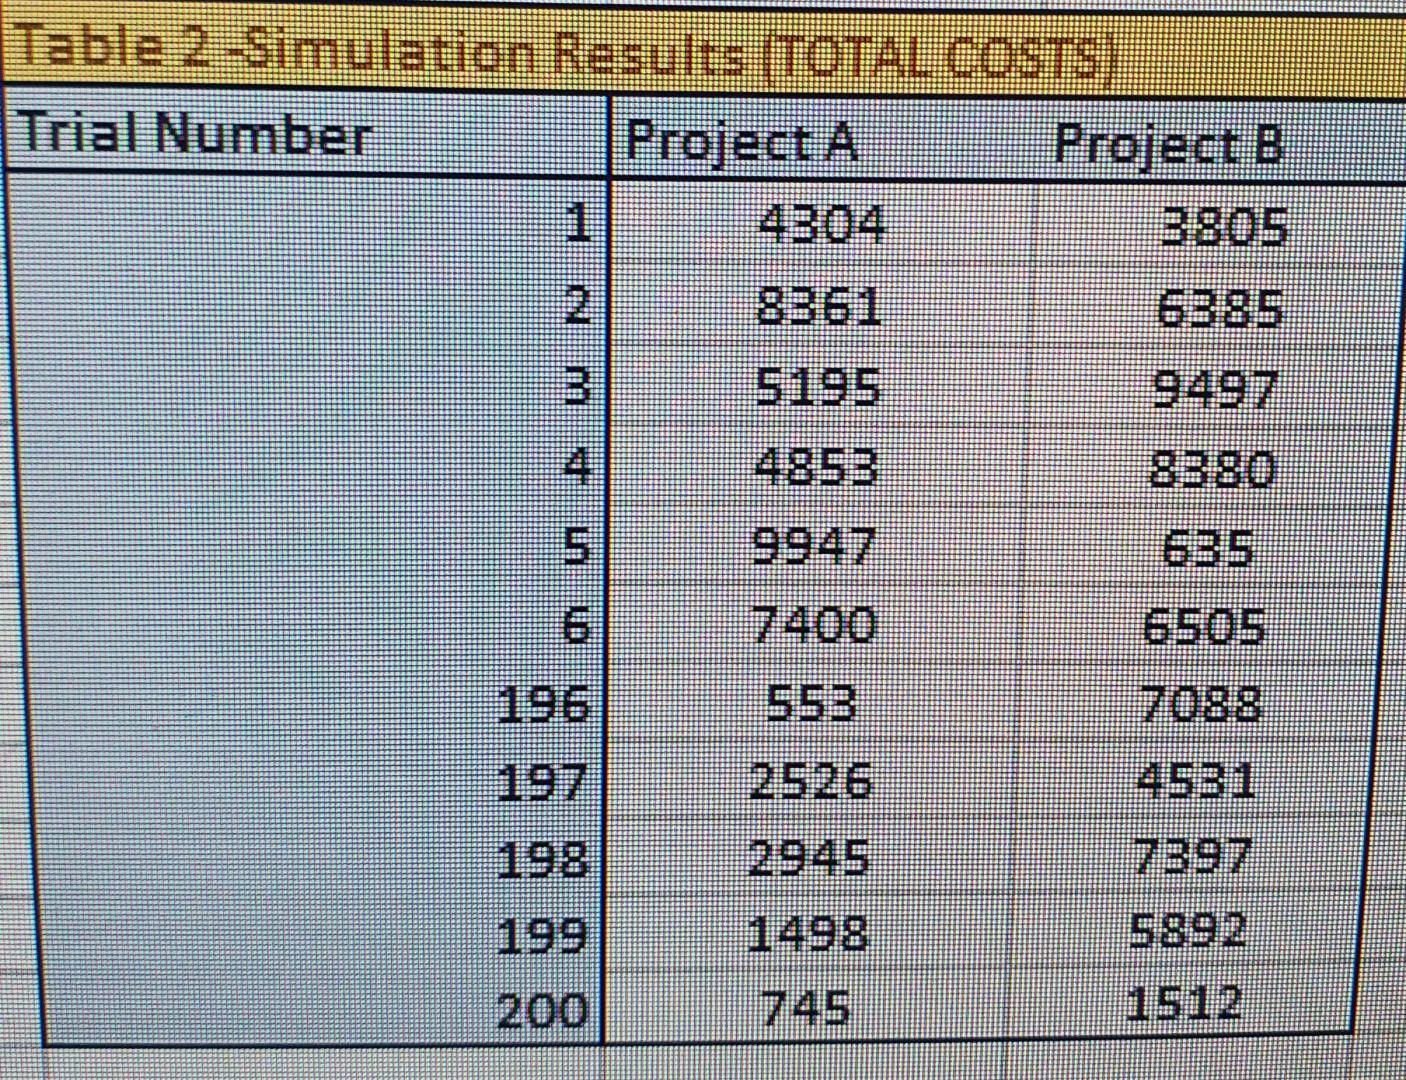
ole 2 contains the results (ie. TOTAL COSTS) of 200 simulation trials for each of 2 (Two) projects (Project A and Using Second Order Stochastic Dominance (and using a bin size of $1,000)which project would y Please select the number that corresponds to the choice from the table below. (i.e. Submit 1 or Select One Project A Project B Focusing just on Project A, if you could conduct up to 2,000 simulations, how much more accurat Assume a 95% confident level. C. Suppose you ran a number of simulations for both Project A and Project B. Assuming that the distributions of the NPV's are normally distributed and you only care about me The mean and variance for the simulations for each project are below: NPV'S Project A Mean Project B 130 45 55 + Variance 0 If you are not risk averse, which project would you choose? Use dot points to explain your answer. Use supporting calculations where necessary. Table 2 Simulation Results (TOTAL COSTS Tal Number Project A Project B 1 2 3 4 83180 7400 6505 880Z 2526 198 2945 199 1498 5892 200 745 1512 ole 2 contains the results (ie. TOTAL COSTS) of 200 simulation trials for each of 2 (Two) projects (Project A and Using Second Order Stochastic Dominance (and using a bin size of $1,000)which project would y Please select the number that corresponds to the choice from the table below. (i.e. Submit 1 or Select One Project A Project B Focusing just on Project A, if you could conduct up to 2,000 simulations, how much more accurat Assume a 95% confident level. C. Suppose you ran a number of simulations for both Project A and Project B. Assuming that the distributions of the NPV's are normally distributed and you only care about me The mean and variance for the simulations for each project are below: NPV'S Project A Mean Project B 130 45 55 + Variance 0 If you are not risk averse, which project would you choose? Use dot points to explain your answer. Use supporting calculations where necessary. Table 2 Simulation Results (TOTAL COSTS Tal Number Project A Project B 1 2 3 4 83180 7400 6505 880Z 2526 198 2945 199 1498 5892 200 745 1512
Step by Step Solution
There are 3 Steps involved in it
Step: 1

Get Instant Access to Expert-Tailored Solutions
See step-by-step solutions with expert insights and AI powered tools for academic success
Step: 2

Step: 3
Ace Your Homework with AI
Get the answers you need in no time with our AI-driven, step-by-step assistance
Get Started
Take Action For Performance Under Pressure How To Handle Stress And Succeed
Authors: Arnulfo Wedige
1st Edition
979-8388686084