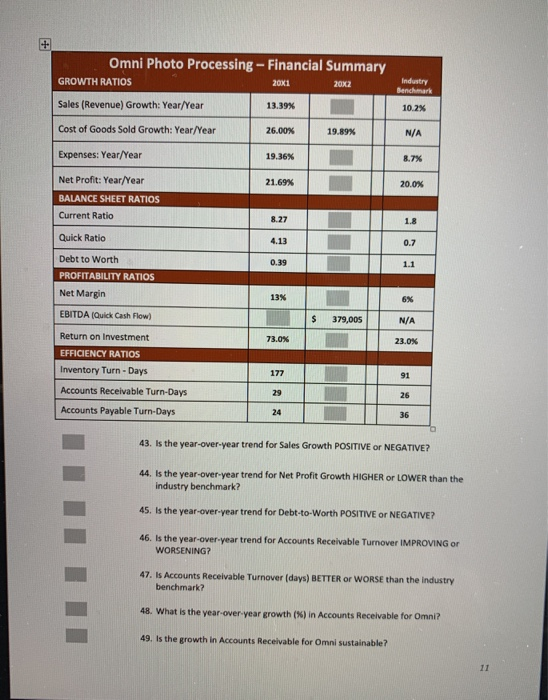
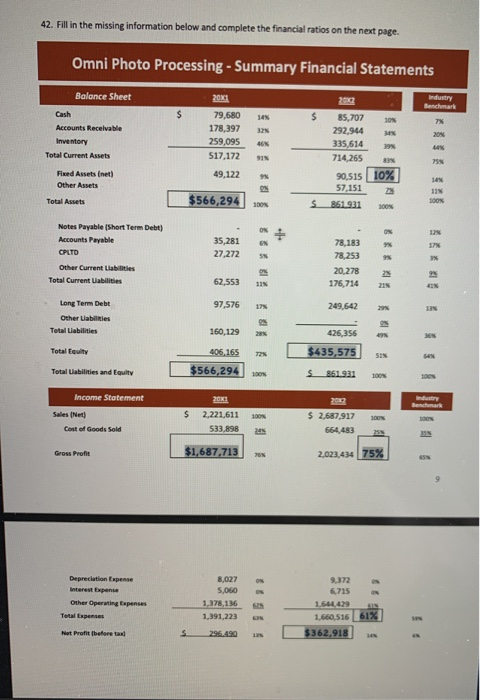
Omni Photo Processing - Financial Summary GROWTH RATIOS 20x1 20x2 Industry Benchmark 10.2% 13.39% Sales (Revenue)Growth: Year/Year Cost of Goods Sold Growth: Year/Year 26.00% 19.89% N/A Expenses: Year/Year 19.36% 8.7% 21.69% 20.0% Net Profit: Year/Year BALANCE SHEET RATIOS Current Ratio 8.27 1.8 Quick Ratio 4.13 0.7 0.39 1.1 Debt to Worth PROFITABILITY RATIOS Net Margin 13% 6% EBITDA (Quick Cash Flow) 379,005 N/A 73.0% 23.0% Return on Investment EFFICIENCY RATIOS Inventory Turn - Days Accounts Receivable Turn-Days Accounts Payable Turn-Days 177 91 29 26 24 36 43. Is the year-over-year trend for Sales Growth POSITIVE or NEGATIVE? 44. Is the year-over-year trend for Net Profit Growth HIGHER or LOWER than the industry benchmark? 45. Is the year-over-year trend for Debt-to-Worth POSITIVE or NEGATIVE? 46. Is the year-over-year trend for Accounts Receivable Turnover IMPROVING ON WORSENING? 47. Is Accounts Receivable Turnover (days) BETTER or WORSE than the industry benchmark? 48. What is the year-over-year growth (X) in Accounts Receivable for Omni? 49. Is the growth in Accounts Receivable for Omni sustainable? 11 42. Fill in the missing information below and complete the financial ratios on the next page. Omni Photo Processing - Summary Financial Statements Balance Sheet Industry Benchmark $ $ 145 3.2 73 20X1 79,680 178,397 259,095 517,172 Cash Accounts Receivable Inventory Total Current Assets 20 46 91% 85,707 10 292,944 335,614 39 714,265 90,515 / 10% 57,151 851.931 100N 75 49,122 Fixed Assets (net) Other Assets 9 145 11% 100% Total Assets $566,294 100% ON ON --- Notes Payable (Short Term Debit) Accounts Payable CPLTD 12 9 35,281 27,272 17 5% 1 Other Current Liabilities Total Current Liabilities 78,183 78,253 20,278 176,714 62,553 115 23 22 97,576 17 249,642 29 13 Long Term Debt Other abilities Total abilities 160,129 36 426,356 $435,575 Total uity 406,165 72% SIN Total abilities and Equity $566,294 100% S861931 100% Industry Benmark Income Statement Sales (Net Cost of Goods Sold $ 20/01 2,221,611 533,898 100% 100% $ 2.687,917 664,483 24 35 Gross Profit $1,687.713 2,023,434 75% 9 05 ON Depreciation Expense Interest Expense Other Operating Bepenses Total Expenses 8,027 5,060 1,378,136 1,391,223 9,372 6,715 1.644429 1.660,516 61% Net Profit before and S 296.490 $362,918


