Answered step by step
Verified Expert Solution
Question
1 Approved Answer
On FactSet, under the Financials tab on the left, select Ratio Analysis. There you will find 10 years' worth of data (if your company has
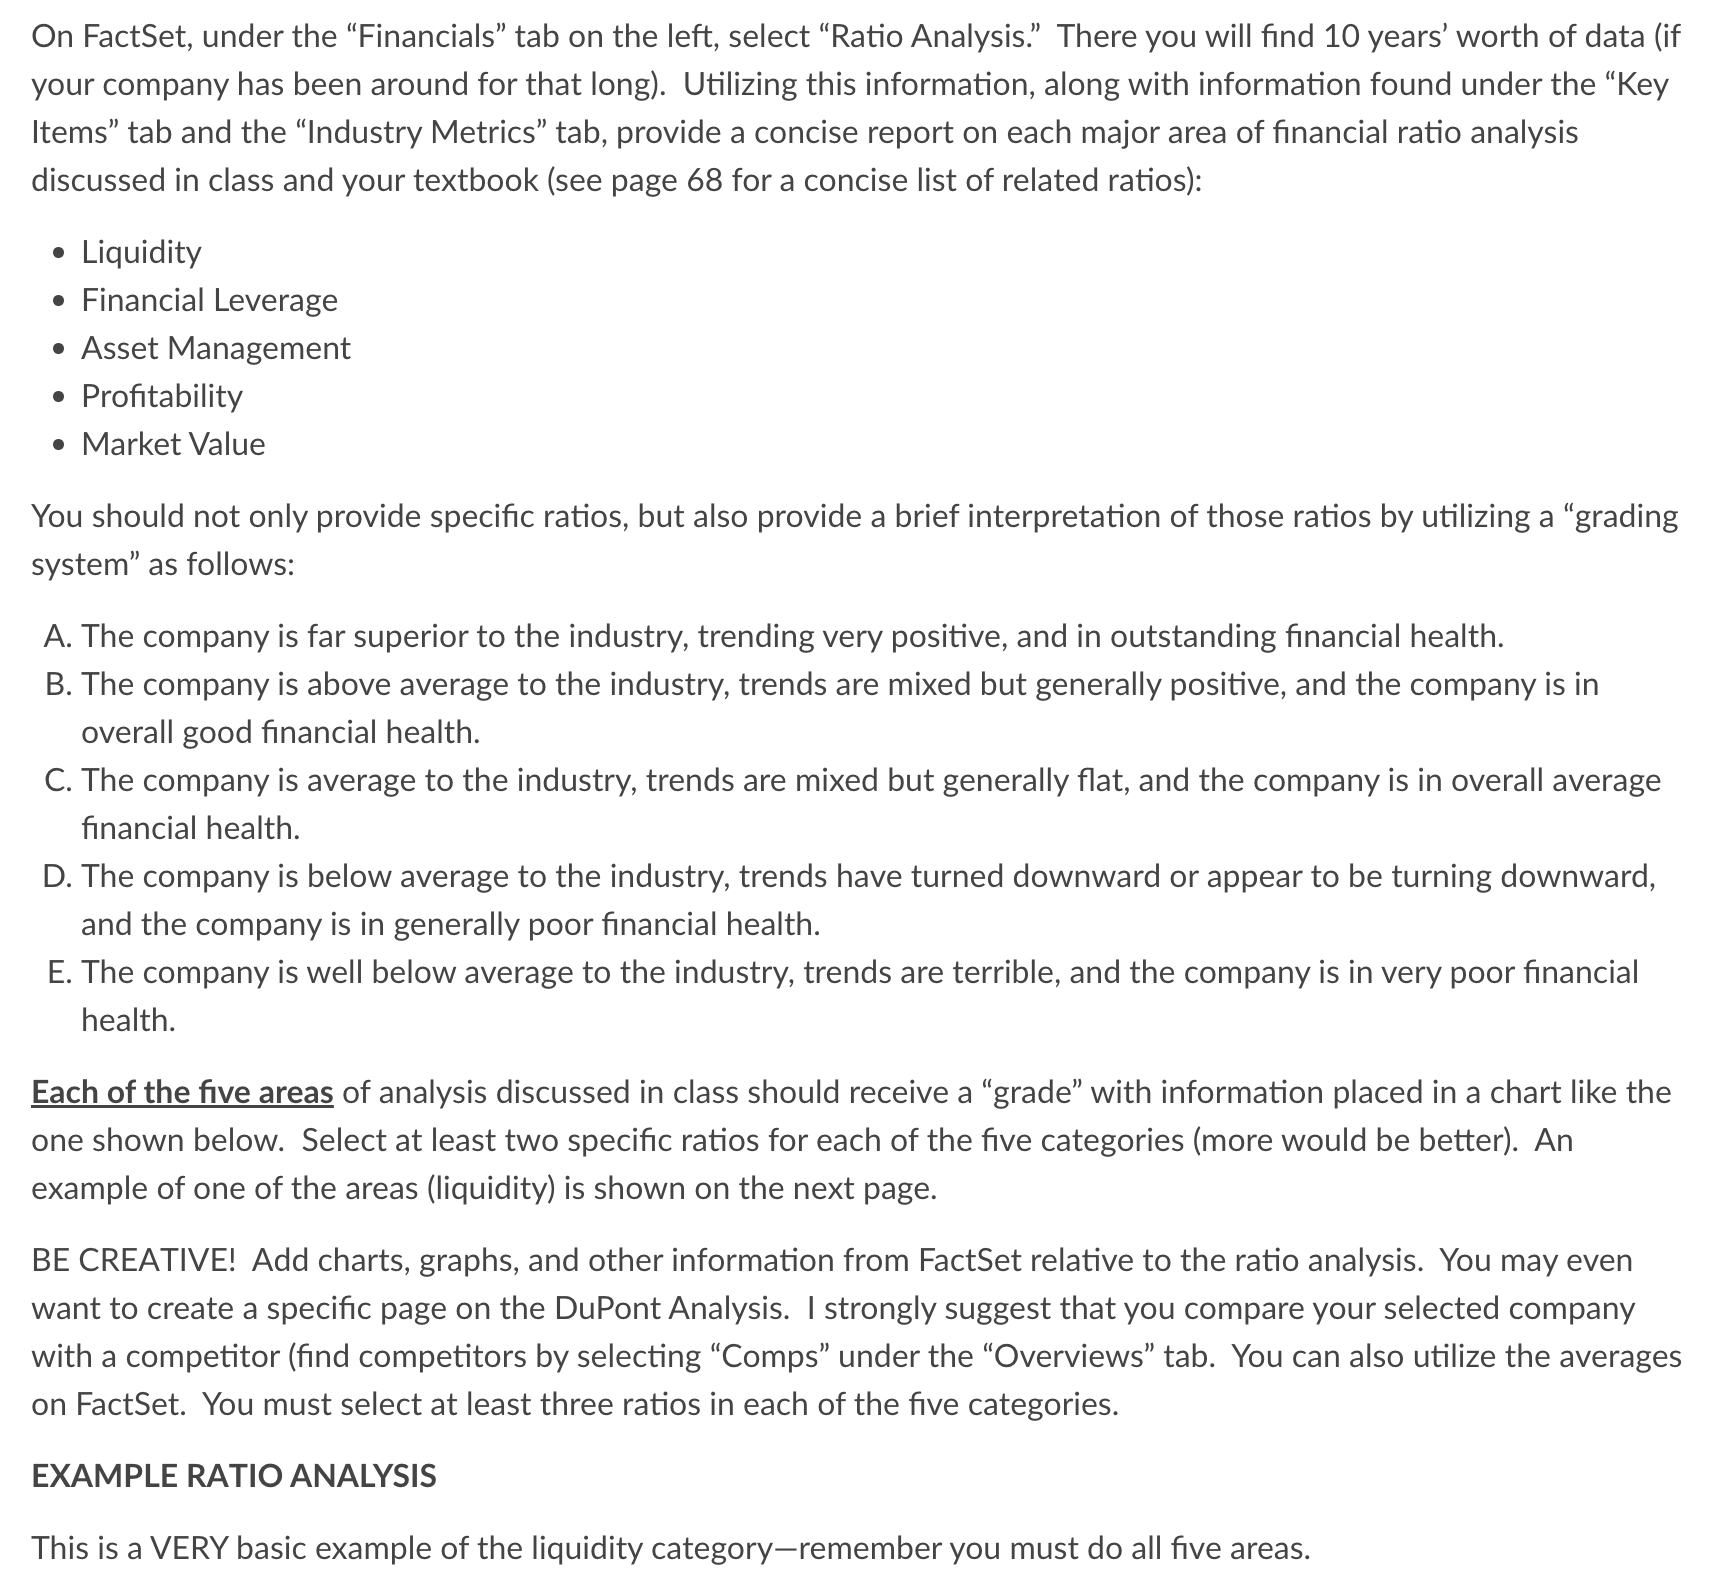
 On FactSet, under the "Financials" tab on the left, select "Ratio Analysis." There you will find 10 years' worth of data (if your company has been around for that long). Utilizing this information, along with information found under the "Key Items" tab and the "Industry Metrics" tab, provide a concise report on each major area of financial ratio analysis discussed in class and your textbook (see page 68 for a concise list of related ratios): - Liquidity - Financial Leverage - Asset Management - Profitability - Market Value You should not only provide specific ratios, but also provide a brief interpretation of those ratios by utilizing a "grading system" as follows: A. The company is far superior to the industry, trending very positive, and in outstanding financial health. B. The company is above average to the industry, trends are mixed but generally positive, and the company is in overall good financial health. C. The company is average to the industry, trends are mixed but generally flat, and the company is in overall average financial health. D. The company is below average to the industry, trends have turned downward or appear to be turning downward, and the company is in generally poor financial health. E. The company is well below average to the industry, trends are terrible, and the company is in very poor financial health. Each of the five areas of analysis discussed in class should receive a "grade" with information placed in a chart like the one shown below. Select at least two specific ratios for each of the five categories (more would be better). An example of one of the areas (liquidity) is shown on the next page. BE CREATIVE! Add charts, graphs, and other information from FactSet relative to the ratio analysis. You may even want to create a specific page on the DuPont Analysis. I strongly suggest that you compare your selected company with a competitor (find competitors by selecting "Comps" under the "Overviews" tab. You can also utilize the averages on FactSet. You must select at least three ratios in each of the five categories. EXAMPLE RATIO ANALYSIS
 Step by Step Solution
There are 3 Steps involved in it
Step: 1

Get Instant Access to Expert-Tailored Solutions
See step-by-step solutions with expert insights and AI powered tools for academic success
Step: 2

Step: 3

Ace Your Homework with AI
Get the answers you need in no time with our AI-driven, step-by-step assistance
Get Started


