On June 23rd, 2020 GNC Holdings filed for Chapter 11 (reorganization) bankruptcy. GNC had long struggled with its debt, raising capital by issuing about
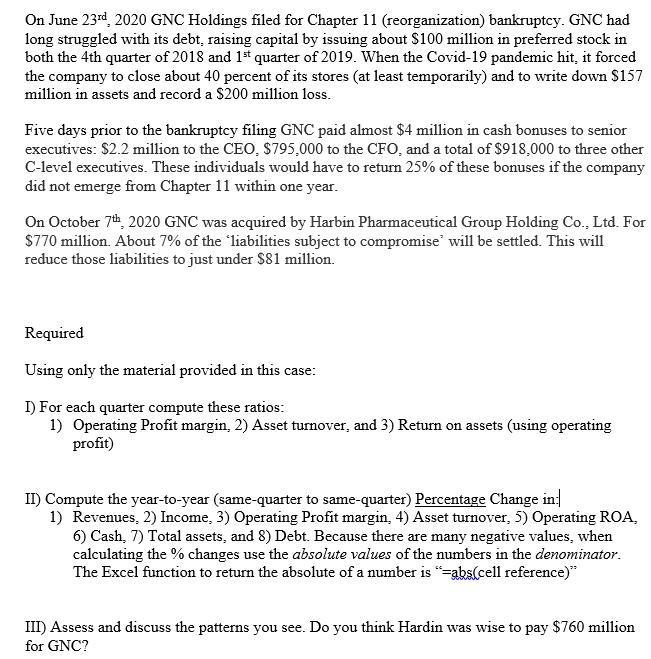
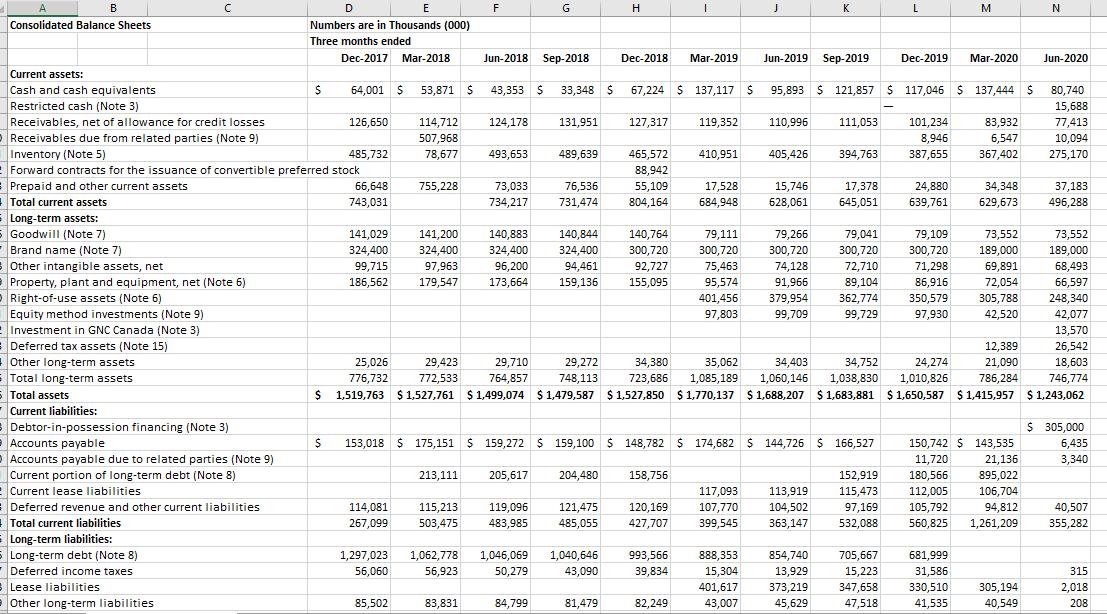
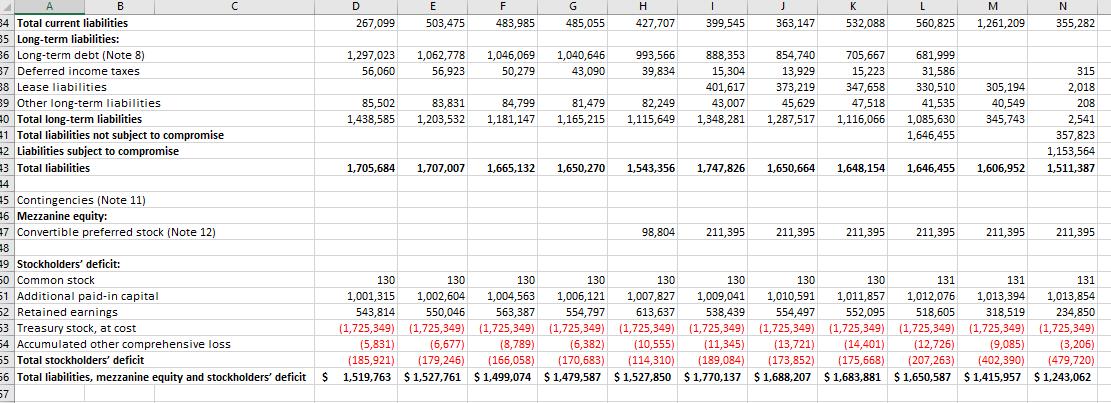
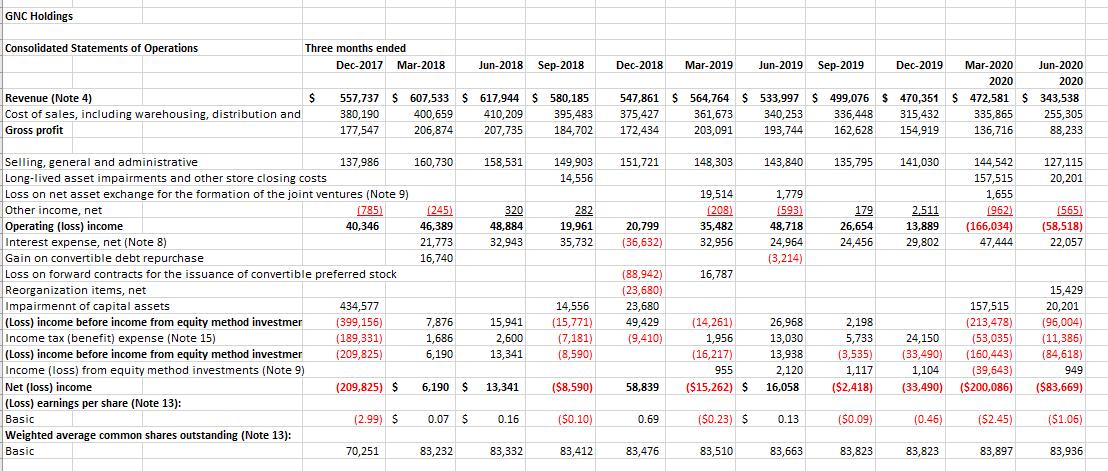
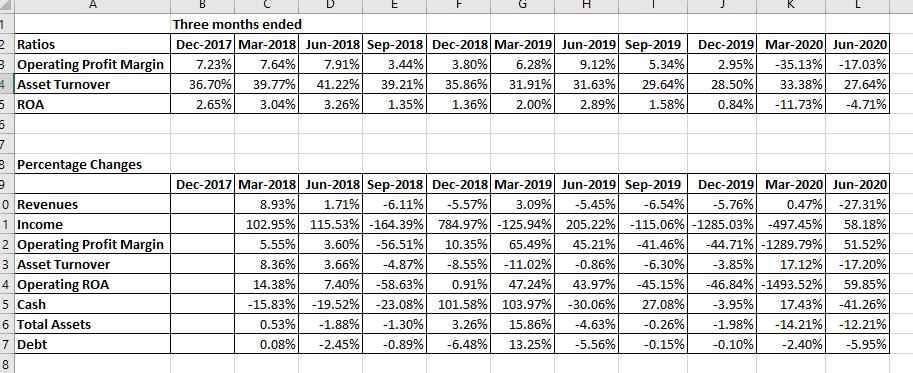
On June 23rd, 2020 GNC Holdings filed for Chapter 11 (reorganization) bankruptcy. GNC had long struggled with its debt, raising capital by issuing about $100 million in preferred stock in both the 4th quarter of 2018 and 1st quarter of 2019. When the Covid-19 pandemic hit, it forced the company to close about 40 percent of its stores (at least temporarily) and to write down $157 million in assets and record a $200 million loss. Five days prior to the bankruptcy filing GNC paid almost $4 million in cash bonuses to senior executives: $2.2 million to the CEO, $795,000 to the CFO, and a total of $918,000 to three other C-level executives. These individuals would have to return 25% of these bonuses if the company did not emerge from Chapter 11 within one year. On October 7th, 2020 GNC was acquired by Harbin Pharmaceutical Group Holding Co., Ltd. For $770 million. About 7% of the "liabilities subject to compromise' will be settled. This will reduce those liabilities to just under $81 million. Required Using only the material provided in this case: I) For each quarter compute these ratios: 1) Operating Profit margin, 2) Asset turnover, and 3) Return on assets (using operating profit) II) Compute the year-to-year (same-quarter to same-quarter) Percentage Change in 1) Revenues, 2) Income, 3) Operating Profit margin, 4) Asset turnover, 5) Operating ROA, 6) Cash, 7) Total assets, and 8) Debt. Because there are many negative values, when calculating the % changes use the absolute values of the numbers in the denominator. The Excel function to return the absolute of a number is "=abs(cell reference)" III) Assess and discuss the patterns you see. Do you think Hardin was wise to pay $760 million for GNC? F Jun-2018 B D E G H I J K L M N Consolidated Balance Sheets Numbers are in Thousands (000) Three months ended Dec-2017 Mar-2018 Sep-2018 Dec-2018 Mar-2019 Jun-2019 Sep-2019 Dec-2019 Mar-2020 Jun-2020 Current assets: Cash and cash equivalents $ 64,001 $ 53,871 $ 43.353 $ 33,348 $ 67,224 $ 137,117 95,893 $121,857 $ 117,046 $ 137,444 $ 80,740 Restricted cash (Note 3) - 15,688 Receivables, net of allowance for credit losses 126,650 124,178 131,951 127,317 119,352 110,996 111,053 83,932 77,413 114,712 507,968 Receivables due from related parties (Note 9) 101,234 8,946 387,655 6,547 10,094 T Inventory (Note 5) 485,732 78,677 493,653 489,639 465,572 410,951 405,426 394,763 367,402 275,170 Forward tracta Forward contracts for the issuance of convertible preferred stock 88,942 Pronaid and other Prepaid and other current assets 66,648 755,228 73,033 76,536 55,109 17,528 15,746 24,880 34,348 37,183 F 17,378 645,051 Total current assets 743,031 734,217 731,474 804,164 684,948 628,061 639,761 629,673 496,288 www Long-term assets: Goodwill (Note 7) 141,029 141,200 140,883 140,844 140,764 79,111 79,266 79,109 73,552 73,552 Dend name (Note Brand name (Note 7) 79,041 300,720 324,400 324,400 324,400 300,720 300,720 300,720 300,720 189,000 189,000 Other inte. Other intangible assets, net 99,715 97,963 96,200 324,400 94,461 159,136 92,727 75,463 74,128 72,710 71,298 68,493 Proper 186,562 179,547 Property, plant and equipment, net (Note 6) Dicht 173,664 155,095 95,574 89,104 91,966 86,916 69,891 72,054 305,788 55 507 66,597 248 240 248,340 Right-of-use assets (Note 6) 401,456 379,954 362,774 350,579 Caritmetho ALOTT Equity method investments (Note 9) 97,803 99,709 99,729 97,930 42,520 42,077 Investment in GNC Canada (Note 3) 13.570 13,570 Deferred tax assets (Note 15) 12,389 26,542 Other long Other long-term assets 29,423 29,272 34,380 35,062 34,403 34,752 24,274 21,090 18,603 Total long 25,026 776,732 29,710 764,857 748,113 723,686 1,085,189 1,060,146 1,038,830 1,010,826 $ 1,519,763 $1,527,761 $ 1,499,074 $ 1,479,587 $1,527,850 $ 1,770,137 $1,688,207 $1,683,881 $1,650,587 $1,415,957 $ 1,243,062 Total long-term assets 772,533 786,284 746,774 Total assets Current liabilities: Debtor-in-possession financing (Note 3) $ 305,000 Accounts payable $ 153,018 $ 175,151 $ 159,272 $ 159,100 $ 148,782 $174,682 $144,726 $ 166,527 150,742 $ 143,535 6,435 Accounts payable due to related parties (Note 9) 11,720 21,136 3,340 Current portion of long-term debt (Note 8) 213,111 205,617 204,480 158,756 152,919 180,566 895,022 Current lease liabilities concent lease abi 117,093 113,919 115,473 112,005 106,704 Deferred revenue and other current liabilities 114,081 115,213 119,096 121,475 120,169 107,770 104,502 97,169 105,792 94,812 40,507 Total current liabilities procal cancr 267,099 503,475 483,985 485,055 427,707 399,545 363,147 532,088 560,825 1,261,209 355,282 Long-term liabilities: 5 Long-term debt (Note 8) 993,566 888,353 854,740 705,667 681,999 1,297,023 1,062,778 56,060 1,046,069 1,040,646 50,279 Deferred income taxes 56,923 43,090 39,834 15,304 13,929 15,223 31,586 315 Lease liabilities 401,617 373,219 347,658 330,510 305,194 2,018 Other long-term liabilities 85,502 83,831 84,799 81,479 82,249 43,007 45,629 47,518 41,535 40,549 208 B E F G D 267,099 H 427,707 I 399,545 J 363,147 K 532,088 L 560,825 M 1,261,209 N 355,282 34 Total current liabilities 503,475 483,985 485,055 35 Long-term liabilities: 36 Long-term debt (Note 8) 1,062,778 1,046,069 1,040,646 993,566 888,353 1,297,023 56,060 854,740 13,929 705,667 15,223 681,999 31,586 37 Deferred income taxes belehed 56,923 50,279 43,090 39,834 15,304 315 38 Lease liabilities 347,658 330,510 305,194 2,018 373,219 45,629 39 Other long-term liabilities 83,831 47,518 401,617 81,479 82,249 43,007 1,165,215 1,115,649 1,348,281 1,287,517 1,116,066 41,535 85,502 1,438,585 1,203,532 40,549 84,799 1,181,147 40 Total long-term liabilities 345,743 1,085,630 1,646,455 #1 Total liabilities not subject to compromise 208 2,541 357,823 1,153,564 1,511,387 42 Liabilities subject to compromise 43 Total liabilities 1,705,684 1,707,007 1,665.132 1,650,270 1,543,356 1,747,826 1,650,664 1,648,154 1,646,455 1,606,952 14 44 45 Contingencies (Note 11) 46 Mezzanine equity: 47 Convertible preferred stock (Note 12) 98,804 211,395 211,395 211,395 211,395 211,395 211,395 18 48 49 Stockholders' deficit: 50 Common stock 131 51 Additional paid-in capital 52 Retained earnings 130 130 1,001,315 1,002,604 543,814 550,046 (1,725,349) (1,725,349) (5,831) 53 Treasury stock, at cost 130 130 130 130 130 130 131 131 1,004,563 1,006,121 1,007,827 1,009,041 1,010,591 1,011,857 1,012,076 1,013,394 1,013,854 563,387 554,797 613.637 538,439 554,497 552,095 518,605 318,519 234,850 (1,725,349) (1,725,349) (1,725,349) (1,725,349) (1,725,349) (1,725,349) (1,725,349) (1,725,349) (1,725,349) (1,725,349) (1,725,349) (1,725,349) (1,725,349) (1,725,349) (8,789) (6,382) (10,555) (11,345) (13,721) (14,401) (12,726) (9,085) (3,206) (402,390) (479,720) 54 Accumulated other comprehensive loss (6,677) 55 Total stockholders' deficit (185,921) (179,246) (166,058) (170,683) (114,310) (189,084) (173,852) (175,668) (207,263) 56 Total liabilities, mezzanine equity and stockholders' deficit $ 1,519,763 $1,527,761 $ 1,499,074 $1,479,587 $1,527,850 $ 1,770,137 $ 1,688,207 $1,683,881 $1,650,587 $ 1,415,957 $ 1,243,062 57 GNC Holdings Consolidated Statements of Operations Three months ended Dec-2017 Mar-2018 Jun-2018 Sep-2018 Revenue (Note 4) $ Cost of sales, including warehousing, distribution and Gross profit 557,737 $ 607,533 $ 617,944 $ 580,185 380,190 400,659 410,209 395,483 206,874 207,735 184,702 177,547 Selling, general and administrative 137,986 160,730 158,531 149,903 151,721 Long-lived asset impairments and other store closing costs 14,556 Loss on net asset exchange for the formation of the joint ventures (Note 9) Other income, net (785) (245) 282 19,961 Operating (loss) income 40,346 320 48,884 32,943 46,389 20,799 Interest expense, net (Note 8) 21,773 35,732 (36,632) Gain on convertible debt repurchase 16,740 inne on foouard contracts Loss on forward contracts for the issuance of convertible preferred stock (88,942) F (23,680) Reorganization items, net ncors mennt of Impairmennt of capital assets 434,577 14,556 23,680 (Loss) income before income from equity method investmer (399,156) 15,941 (15,771) 49,429 Income tax (benefit) expense (Note 15) (189,331) 7,876 1,686 6,190 2,600 (7,181) (9,410) (Loss) income before income from equity method investmer Income (loss) from equity method investments (Note 9) (209,825) 13,341 (8,590) Mer Net (loss) income (209,825) $ 6,190 $ 13,341 ($8,590) 58,839 (Loss) earnings per share (Note 13): Basic (2.99) $ 0.07 $ 0.16 ($0.10) 0.69 Weighted average common shares outstanding (Note 13): Basic 83,332 83,412 83,476 70,251 83,232 Dec-2018 Mar-2019 Jun-2019 Sep-2019 Dec-2019 Mar-2020 2020 Jun-2020 2020 547,861 $ 564,764 $ 533,997 $ 499,076 $ 470,351 $ 472,581 $ 343,538 375,427 172,434 255,305 361,673 203,091 340,253 193,744 336,448 315,432 162,628 154,919 335,865 136,716 88,233 148,303 143,840 135,795 141,030 127,115 144,542 157,515 20,201 19,514 1,779 1,655 (962) (208) (593) 179 26,654 2,511 13,889 35,482 48,718 (166,034) 47,444 (565) (58,518) 22,057 32,956 24,964 24,456 29,802 (3,214) 16,787 15,429 157,515 (213,478) 20,201 (96,004) (14,261) 26,968 2,198 13,030 (53,035) 1,956 (16,217) 955 ($15,262) $ 13,938 2,120 16,058 5,733 24,150 (3,535) (33,490) (160,443) 1,117 1,104 (39,643) ($2,418) (33,490) ($200,086) (11,386) (84,618) 949 ($83,669) ($0.23) $ 0.13 ($0.09) (0.46) ($2.45) ($1.06) 83,510 83,663 83,823 83,823 83,897 83,936 A 1 2 Ratios 3 Operating Profit Margin 4 Asset Turnover 5 ROA 5 7 8 Percentage Changes 3 0 Revenues 1 Income 2 Operating Profit Margin 3 Asset Turnover 4 Operating ROA 5 Cash 6 Total Assets 7 Debt 8 F H K Three months ended 3.80% 6.28% 9.12% 5.34% 2.95% Dec-2017 Mar-2018 Jun-2018 Sep-2018 Dec-2018 Mar-2019 Jun-2019 Sep-2019 Dec-2019 Mar-2020 Jun-2020 7.23% 7.64% 7.91% 3.44% 36.70% 39.77% 41.22% 39.21% 35.86% 31.91% 31.63% 29.64% 28.50% 2.65% 3.04% 3.26% 1.35% 1.36% 2.00% 2.89% 1.58% 0.84% -35.13% -17.03% 33.38% 27.64% -11.73% -4.71% Dec-2017 Mar-2018 Jun-2018 Sep-2018 Dec-2018 Mar-2019 Jun-2019 Sep-2019 Dec-2019 Mar-2020 Jun-2020 -5.45% -6.54% -5.76% 8.93% 1.71% -6.11% -5.57% 3.09% 0.47% -27.31% 102.95% 115.53% -164.39% 784.97% -125.94% 205.22% -115.06% -1285.03% -497.45% 58.18% 5.55% 3.60% -56.51% 10.35% 65.49% 45.21% -41.46% -44.71% -1289.79% 51.52% 8.36% 3.66% -4.87% -8.55% -11.02% -0.86% -6.30% -3.85% 17.12% -17.20% 14.38% 7.40% -58.63% 0.91% 47.24% 43.97% -45.15% -46.84% -1493.52% 59.85% -15.83% -19.52% -23.08% 101.58% 103.97% -30.06% 27.08% -3.95% 17.43% -41.26% 0.53% -1.88% -1.30% 3.26% 15.86% -4.63% -0.26% -1.98% -14.21% -12.21% 0.08% -2.45% -0.89% -6.48% 13.25% -5.56% -0.15% -0.10% -2.40% -5.95%
Step by Step Solution
3.40 Rating (153 Votes )
There are 3 Steps involved in it
Step: 1
ANSWERS I Operating Profit margin Operating Profit Net Sales Quarter 1 Operating Profit margin 007 059 012 Quarter 2 Operating Profit margin 003 057 0...
See step-by-step solutions with expert insights and AI powered tools for academic success
Step: 2

Step: 3

Ace Your Homework with AI
Get the answers you need in no time with our AI-driven, step-by-step assistance
Get Started


