

Question
On Monday, February 10, Mr. Mitchell Gordon, Vice President of Operations, asked the Controller, the Sales Manager, and the Production Manager to meet with him
On Monday, February 10, Mr. Mitchell Gordon, Vice President of Operations, asked the Controller, the Sales Manager, and the Production Manager to meet with him to discuss the number of tomato products to pack that season. The tomato crop, which had been purchased at planting, was beginning to arrive at the cannery, and packing operations would have to be started by the following Monday. Red Brand Canners was a medium-sized company that canned and distributed a variety of fruit and vegetable products under private brands in the western states.
Mr. William Cooper, the Controller, and Mr. Charles Myers, the Sales Manager, were the first to arrive in Mr. Gordons office. Dan Tucker, the Production Manager, came in a few minutes later and said that he had picked up Produce Inspections latest estimate of the quality of the incoming tomatoes. According to their report, about 20 percent of the crop was Grade A quality, and the remaining portion of the 3-million-pound crop was Grade B.
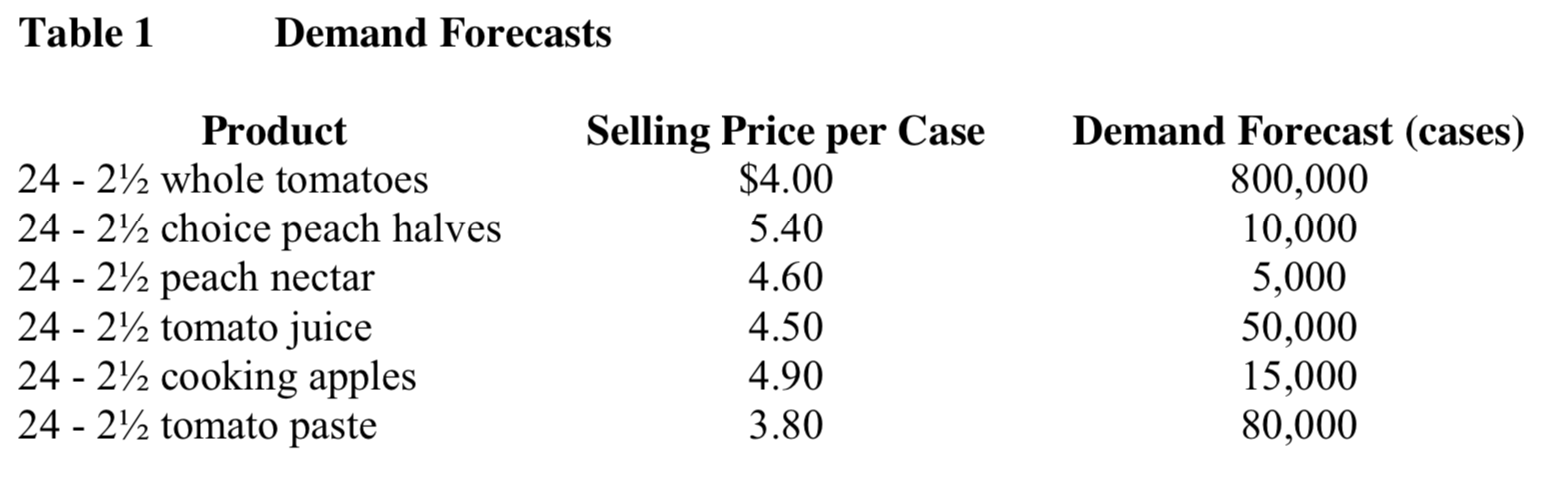
Gordon asked Myers about the demand for tomato products for the coming year. Myers replied that they could sell all of the whole canned tomatoes they could produce. The expected demand for tomato juice and tomato paste, on the other hand, was limited. The Sales Manager then passed around the latest demand forecast, which is shown in Table 1. He reminded the group that the selling prices had been set in light of the long-term marketing strategy of the company and that the potential sales had been forecast at these prices.
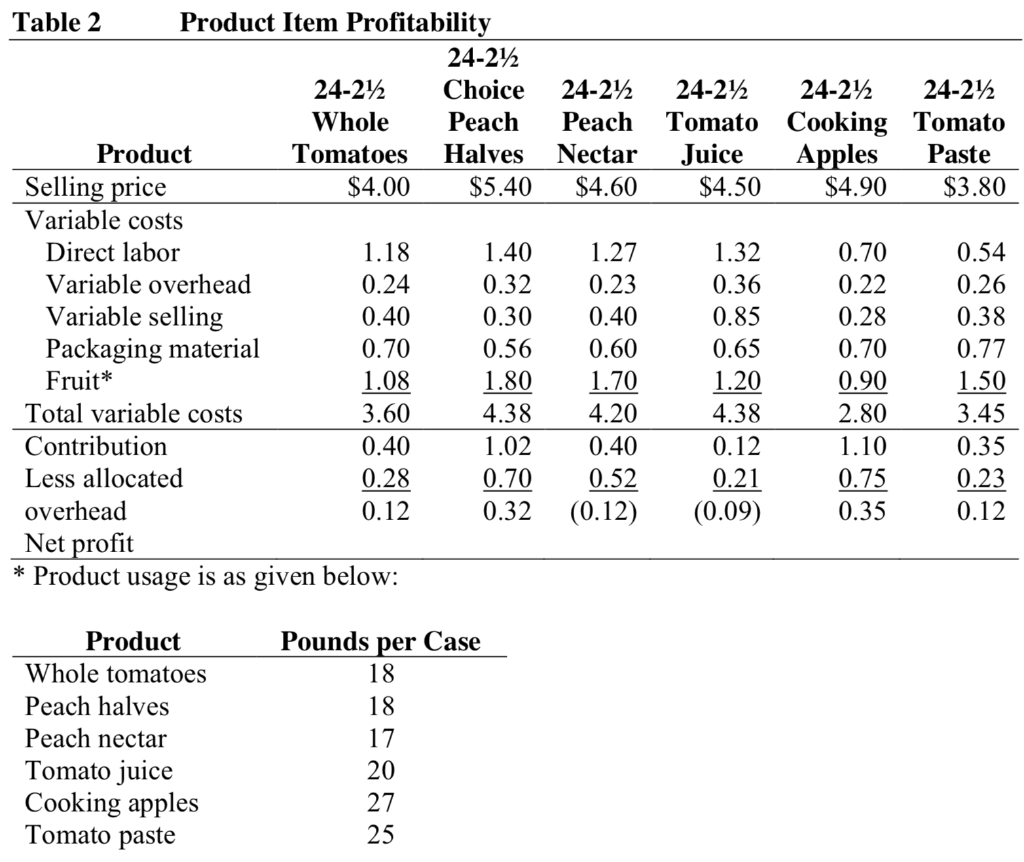
Bill Cooper, after looking at Myers estimates of demand, said that it looked like the company should do quite well [on the tomato crop] this year. With the new accounting system that had been set up, he had been able to compute the contribution for each product, and according to his analysis, the incremental profit on the whole tomatoes was greater than the incremental profit on any other tomato product. In May, after Red Brand had signed contracts agreeing to purchase the growers production at an average delivered price of 6 cents per pound, Cooper had computed the tomato product contributions (see Table 2).
Dan Tucker brought to Coopers attention that capacity, it was impossible to produce all whole tomatoes, since too small a portion of the tomato crop was A quality. Red Brand used a numerical scale to record the quality of both raw produce and prepared products. This scale ran from 0 to 10, the higher number representing better quality. According to this scale, A tomatoes averaged 9 points per pound and B tomatoes averaged 5 points per pound. Tucker noted that the minimum average input quality was 8 points per pound for canned whole tomatoes and 6 points per pound for juice. The paste could be made entirely from B grade tomatoes. This meant that whole tomato production was limited to 800,000 pounds.
Gordon stated that this was not a real limitation. He had been recently solicited to purchase 80,000 pounds of grade A tomatoes at 812 cents per pound and at that time had turned down the offer. He felt, however, that the tomatoes were still available.
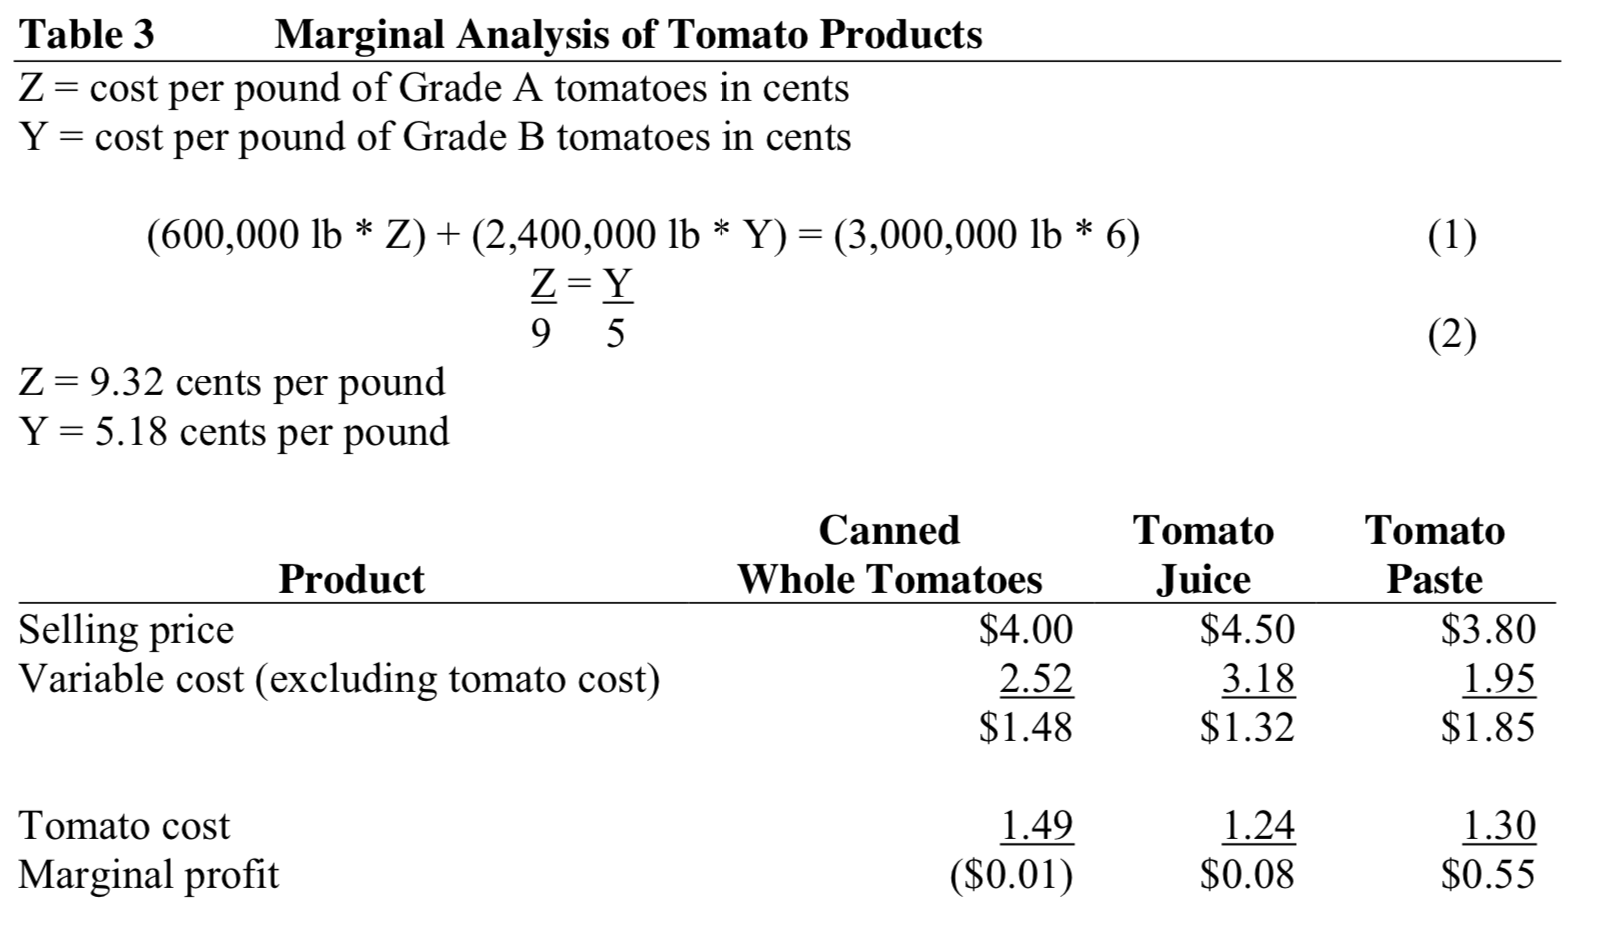
Myers, who had been doing some calculations, said that although he agreed that the company should do quite well this year, it would not be by canning whole tomatoes. It seemed to him that the tomato cost should be allocated on the basis of quality and quantity rather than by quantity only, as Cooper had done. Therefore, he had recomputed the marginal profit on this basis (see Table 3), and from his results had concluded thatRed Brand should use 2,000,000 pounds of the B tomatoes for paste and the remaining400,000 pounds of B tomatoes and all of the A tomatoes for juice. If the demand expectations were realized, a contribution of $48,000 would be made on this years tomato crop.
3. Formulate this same linear programming problem on a spreadsheet and SOLVE using Excel solver. Keep at least FOUR DECIMAL POINTS in the solution output. (Provide the corresponding Excel Spreadsheet, Answer Report and Sensitivity Report). Interpret the solution (i.e. include managerial statements that communicate the results of the analyses). (7 points)
Please help me figure out how to format this properly with screenshots from excel, please.
Table 1 Demand Forecasts Product 24 - 2/2 whole tomatoes 24 - 27/2 choice peach halves 24 - 27/2 peach nectar 24 - 2%2 tomato juice 24 - 24/2 cooking apples 24 - 27/2 tomato paste Selling Price per Case $4.00 5.40 4.60 4.50 4.90 3.80 Demand Forecast (cases) 800,000 10,000 5,000 50,000 15,000 80,000 24-212 24-242 24-242 Tomato Cooking Tomato Juice Apples Paste $4.50 $4.90 $3.80 1.32 0.70 0.22 Table 2 Product Item Profitability 24-242 24-212 Choice 24-242 Whole Peach Peach Product Tomatoes Halves Nectar Selling price $4.00 $5.40 $4.60 Variable costs Direct labor 1.18 1.40 1.27 Variable overhead 0.24 0.32 0.23 Variable selling 0.40 0.30 0.40 Packaging material 0.70 0.56 0.60 Fruit* 1.08 1.80 1.70 Total variable costs 3.60 4.38 4.20 Contribution 0.40 1.02 0.40 Less allocated 0.28 0.70 0.52 overhead 0.12 0.32 (0.12) Net profit * Product usage is as given below: 0.36 0.85 0.65 1.20 4.38 0.12 0.21 (0.09) 0.28 0.70 0.90 2.80 1.10 0.75 0.35 0.54 0.26 0.38 0.77 1.50 3.45 0.35 0.23 0.12 Pounds per Case 18 Product Whole tomatoes Peach halves Peach nectar Tomato juice Cooking apples Tomato paste 17 20 27 25 Table 3. Marginal Analysis of Tomato Products Z= cost per pound of Grade A tomatoes in cents Y = cost per pound of Grade B tomatoes in cents (600,000 lb * Z) + (2,400,000 lb * Y)= (3,000,000 lb * 6) Z=Y 9 5 Z= 9.32 cents per pound Y = 5.18 cents per pound Product Selling price Variable cost (excluding tomato cost) Canned Whole Tomatoes $4.00 2.52 $1.48 Tomato Juice $4.50 3.18 $1.32 Tomato Paste $3.80 1.95 $1.85 1.49 Tomato cost Marginal profit 1.24 $0.08 1.30 $0.55 ($0.01) Table 1 Demand Forecasts Product 24 - 2/2 whole tomatoes 24 - 27/2 choice peach halves 24 - 27/2 peach nectar 24 - 2%2 tomato juice 24 - 24/2 cooking apples 24 - 27/2 tomato paste Selling Price per Case $4.00 5.40 4.60 4.50 4.90 3.80 Demand Forecast (cases) 800,000 10,000 5,000 50,000 15,000 80,000 24-212 24-242 24-242 Tomato Cooking Tomato Juice Apples Paste $4.50 $4.90 $3.80 1.32 0.70 0.22 Table 2 Product Item Profitability 24-242 24-212 Choice 24-242 Whole Peach Peach Product Tomatoes Halves Nectar Selling price $4.00 $5.40 $4.60 Variable costs Direct labor 1.18 1.40 1.27 Variable overhead 0.24 0.32 0.23 Variable selling 0.40 0.30 0.40 Packaging material 0.70 0.56 0.60 Fruit* 1.08 1.80 1.70 Total variable costs 3.60 4.38 4.20 Contribution 0.40 1.02 0.40 Less allocated 0.28 0.70 0.52 overhead 0.12 0.32 (0.12) Net profit * Product usage is as given below: 0.36 0.85 0.65 1.20 4.38 0.12 0.21 (0.09) 0.28 0.70 0.90 2.80 1.10 0.75 0.35 0.54 0.26 0.38 0.77 1.50 3.45 0.35 0.23 0.12 Pounds per Case 18 Product Whole tomatoes Peach halves Peach nectar Tomato juice Cooking apples Tomato paste 17 20 27 25 Table 3. Marginal Analysis of Tomato Products Z= cost per pound of Grade A tomatoes in cents Y = cost per pound of Grade B tomatoes in cents (600,000 lb * Z) + (2,400,000 lb * Y)= (3,000,000 lb * 6) Z=Y 9 5 Z= 9.32 cents per pound Y = 5.18 cents per pound Product Selling price Variable cost (excluding tomato cost) Canned Whole Tomatoes $4.00 2.52 $1.48 Tomato Juice $4.50 3.18 $1.32 Tomato Paste $3.80 1.95 $1.85 1.49 Tomato cost Marginal profit 1.24 $0.08 1.30 $0.55 ($0.01)
Step by Step Solution
There are 3 Steps involved in it
Step: 1

Get Instant Access to Expert-Tailored Solutions
See step-by-step solutions with expert insights and AI powered tools for academic success
Step: 2

Step: 3
Ace Your Homework with AI
Get the answers you need in no time with our AI-driven, step-by-step assistance
Get Started
ACC 120 Wake Tech Financial Accounting W Connect Plus Access
Authors: J. David Spiceland
1st Edition
1308168926, 978-1308168920