

Question
On New Year's Day, I started weighing myself every morning in order to have an interesting data set. There is 1 chart given below. One
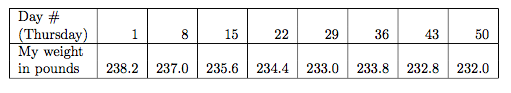
On New Year's Day, I started weighing myself every morning in order to have an interesting data set. There is 1 chart given below. One has my weight for the first eight Thursdays of the year (January 1, 2009 was a Thursday and we'll count it as Day 1).
(a)Plot the data using DESMOS and explain whether or not it is linear
(b)Discuss any data points discrepancies which may be justified from a historical perspective.
(c)Find the least squares regression line for the last four data points and comment on the goodness of fit. Interpret the slope of the line of best fit.
(d)Use the regression line to predict the weight at day 108.
Step by Step Solution
There are 3 Steps involved in it
Step: 1

Get Instant Access to Expert-Tailored Solutions
See step-by-step solutions with expert insights and AI powered tools for academic success
Step: 2

Step: 3
Ace Your Homework with AI
Get the answers you need in no time with our AI-driven, step-by-step assistance
Get Started
College Algebra Graphs and Models
Authors: Marvin L. Bittinger, Judith A. Beecher, David J. Ellenbogen, Judith A. Penna
5th edition
321845404, 978-0321791009, 321791002, 978-0321783950, 321783956, 978-0321845405