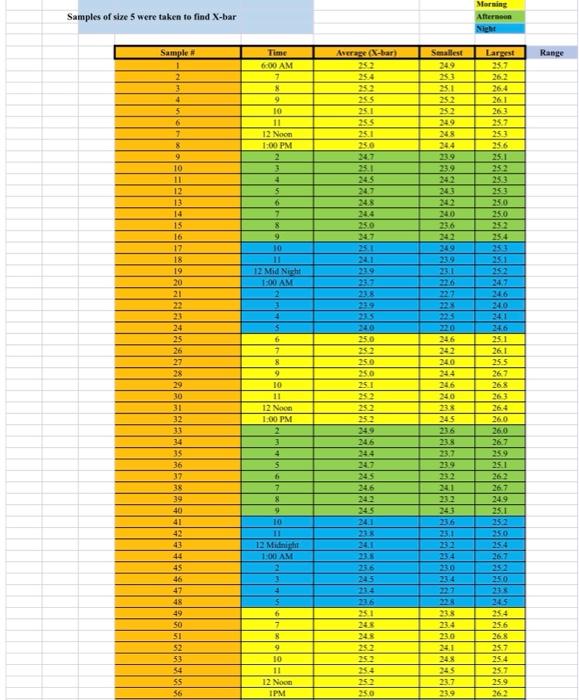
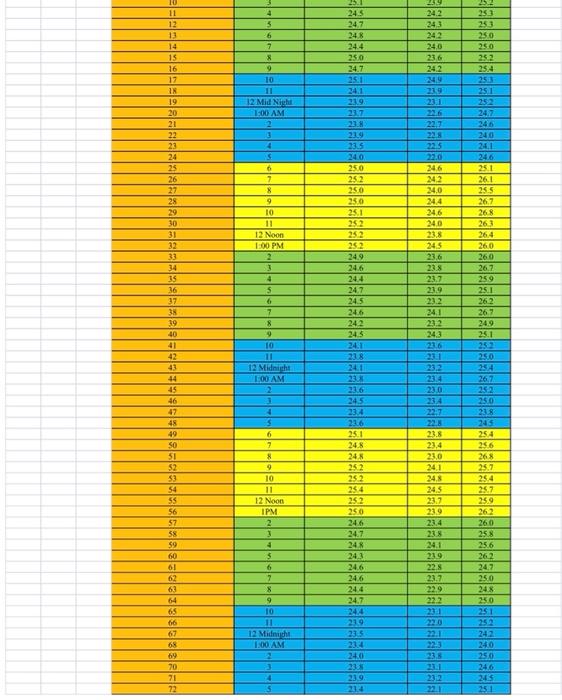
On November 1, 2013 John Adams, a customer service representative of Americo Drilling Supplies (ADS), was summoned to the Houston office of Drilling Contractors, Inc. (DCI), to inspect three boxcars of mud-treating agents that ADS had shipped to the Houston firm. DCI had filed a complaint that the 25 Pound bags of treating agents that it had just received from ADS were light-weighted. The light-weight bags were initially detected by one of DCI's receiving clerks, who noticed that the rail road side scale tickets indicated that the net weights were significantly less on all three of the boxcars than those of identical shipments received on October 25, 2013. ADS's traffic department was called to determine if lighter-weight dunnage or pallets were used on the shipments. (This might explain the lighter weights.) ADS indicated, however, that no changes had been made in the loading or palletizing procedures. Hence, DCI randomly checked 25 of the bags and discovered that the average net weight was almost 24.5 pounds. Consequently, they concluded that the sample indicated a significance short- weight. ADS, was then contacted, and Adams was sent to investigate the complaint and to issue credit (???) to DCI DCI, however, was not completely satisfied with only the issuance of credit for the short shipment. The charts followed by their mud engineers on the drilling platforms were based on 25-pound bags of treating agents. Lighter-weight bags might result in poor chemical control during the drilling operation and might adversely affect drilling efficiency. (Mud-treating agents are used to control the pH and other chemical properties of the open during drilling operations. This could cause severe economic consequences because of the extremely high cost of oil and natural gas drilling operations. Consequently, special use instructions had to accompany the delivery of these shipments to the drilling platforms. Moreover, the light-weight shipments had to be isolated in DCI warehouse, causing extra handling and poor space utilization. Hence, Adams was informed that CDI might seek a new supplier of mud-treating agents if in the future it received bags that deviated significantly below 25 pounds. The quality control department at ADS suspected that the light-weight bags may have resulted from "growing pains" at the Orange, Texas plant. Because of the earlier energy crises, oil and natural gas exploration activity had greatly increased. This increased activity, in turn, created increased demand for products produced by related industries, including drilling muds. Consequently, ADS had to expand from one shift (6 A.M. to 2 P.M.) to a two-shift (2 P.M. to 10 P.M.) operation in Mid 2011s, and finally to a three-shift operation (24 hours per day) in January of 2013. The additional night shift bagging crew was staffed entirely by new employees. The most experienced foremen were temporarily assigned to supervise the night shift. Most emphasis was placed on increasing the output of bags to meet the ever-increasing demand. It was suspected that only occasional reminders were made to double-check the bag weight feeder. (A double check is performed by systematically weighting a bag on a scale to determine if the proper weight is being loaded by the weight-feeder. If there is significant deviation from 25 pounds, corrective adjustments are made to the weight-release mechanism.) To verify this expectation, the quantity control staff at ADS randomly sampled the bag output and prepared the following table (see Excel dataset). Five bags were sampled and weighted each hour. ANALYSIS Assume you are John Adams of ADS. Based on the following analysis, prepare a report to be submitted to both ADS and DCI executives regarding the status of the filling process at ADS and recommend method to improve quality control at the filling station and estimate the amount of credit to DCI. Use the data provided in the Excel data file. Insert all.graphs and provide analysis in this word file after every question. Only The Word fik is seaded. a- Calculate the Range Column in Excel (Larpest-Smallest) and find mean and standard deviations for Average Weight, Smallest, Largest, and Range columns b- What is the standard deviation of individual bags if sample averages are based on 5 bags? Explain your finding. Hinther - sqrt(n). Havingstur based on part (a) calculation, solve forgiven 5. So = ((sqrt(n)) C- Construct a time series plot of all four variables (two graphs: one includes avg, smallest, and largest and the other has range data and discuss your findings based on the graphs. d- Construct X-bar and R Charts, graph, and discuss your findings based on the control charts, Make sure to include the controllimit calculations below, is the process out of control? Why? Explain e- Is there any differences between performances of three shifts? Hint: (Carve out the morning, aftemoon, and night shift data into three columns and graph their averages. Explain your findings based on graph f- Use One Way Analysis of Variance (ANOVA) to compare the three groups (shifts) to test if there is significant differences in the performance of three shift averages. Use Alpha 0:01. Indicate the Null and Alt. hypotheses and explain your findings based on ANOVA table g- Assume Tolerance limits of 25+1.25 lbs is specified in the sales contract and find the Process Capability index Discuss if this process is capable to meet contractual agreement h- Redo part g for all three shifts separately and determine their Note that you must carve out the three shifts and find the mean and standard deviations for each shift separately and go through part b calculations for each shift i- If the process average is adjusted to 25.0 lbs. and process standard deviation (answer in part b) is reduced by 60%, what is the new C? Are you comfortable for making such recommendation te management? Explain j- Find the control limits for an X-bar and R chart if a new improved process has average of 25.0 lbs. and R-bar of 1.2 lbs. Assume - for new process control. No graph needed. K- Estimate the amount of crodit (5) must be given to DCI (for the past 24 months) if it purchased 25,000 bags per month at cost of S4 per ib. - Provide complete conclusion regarding your findings and make recommendations regarding the filling process in your conclusion paragraph Samples of size 5 were taken to find X-bar Morning Afternoon Night Sample # Time Smallest 249 25.3 Largest 25.7 Range 2 3 4 5 6 7 6:00 AM 7 8 9 10 11 12 Noce 1:00 PM 2 3 4 5 6 7 Average (bar) 252 25.4 252 255 25.1 255 25.1 23.0 9 26.4 26.1 263 25.7 253 25.6 25.1 252 253 253 250 250 252 25.4 252 24.9 28 344 239 23.9 242 243 22 240 236 242 249 239 231 245 247 248 244 25.0 8 25.1 9 10 11 12 Mid Nicht 1:00 AM 251 252 24.1 247 23.8 227 225 10 11 12 13 14 15 16 17 18 19 20 21 22 23 24 25 26 27 28 29 30 31 32 33 34 35 36 37 38 39 40 41 42 43 44 45 46 47 4 5 6 7 8 9 10 11 12 Noon 1:00 PM 2 3 4 5 6 17 8 9 10 11 12 Midnight 1:00 AM 2 215 240 250 252 250 250 25.1 252 252 25.2 249 24.6 244 27 245 24.6 242 345 24.1 235 246 242 240 244 246 240 23 245 236 238 23.2 24.0 241 26 25.1 26.1 255 26.7 26. 263 26.4 26.0 26.0 26.7 2509 25.1 262 26.7 24.9 25.1 25 2 350 25.4 219 241 202 243 23.6 25.1 232 234 4 5 23.5 23 245 214 216 251 248 230 214 22.7 228 238 23.4 230 21 49 SO 51 52 53 54 55 56 245 252 250 21 245 25.4 25.6 263 25.7 25.4 25.7 25.9 262 6 7 8 9 10 11 12 Noon IPM 25.2 252 25.4 252 250 345 23.7 23.9 10 11 4 227 253 253 13 6 7 25.1 245 247 24 8 24.4 25.0 34.7 OST 8 2219 242 243 242 24.0 236 24.2 1249 21.9 23.1 22.6 6 250 25.2 25.4 25 251 24.1 23.9 24.2 12 13 14 15 16 17 18 19 20 21 22 23 24 25 26 27 28 29 30 31 32 33 34 35 36 10 11 12 Mid Night 11:00AM 12 3 4 5 6 7 BRE X 9 23 219 23-5 24.0 250 252 250 250 25.1 252 25.2 252 249 24.6 244 ( 225 23.0 246 24.2 24.0 24.4 24.6 24.0 23.8 245 23.6 23.8 10 11 12 Noon 1:00PM 240 24.1 24.6 25.1 26.1 25.5 26.7 268 263 264 260 26.0 26.7 259 25.1 262 26.7 24.9 3 4 5 247 LE 38 39 40 7 8 24.5 246 242 245 241 238 23.2 24.1 232 243 23.6 9 25.1 01 II 23.2 250 25 26.7 12 Midnight 11:00AM 2 3 2304 42 43 44 45 46 47 48 49 50 51 52 23.0 234 22:2 22 5 9 23 23.6 34.5 234 236 25.1 24.8 24.5 252 25.2 25.4 218 7 25.0 238 245 254 296 26% 25.7 25.4 26.7 259 8 6 ES 54 55 56 57 58 10 11 12 Noon IPM 2 3 4 5 6 7 8 23,4 23.0 241 24.8 245 23.7 239 23.4 238 34.1 219 22.8 23.7 22.9 222 23:1 260 25.8 25.6 65 60 19 9 25.0 346 24.7 24.8 243 24.6 24,6 244 24.7 24.4 23.9 235 23.4 24.0 235 239 21:4 62 63 64 65 66 67 6 24.7 250 24.8 25.0 251 22.1 89 69 10 11 12 Midnih 11:00AM 2 3 4 5 242 24.0 25.0 246 245 251 23.8 21:1 232 (221 70 0 72