Answered step by step
Verified Expert Solution
Question
1 Approved Answer
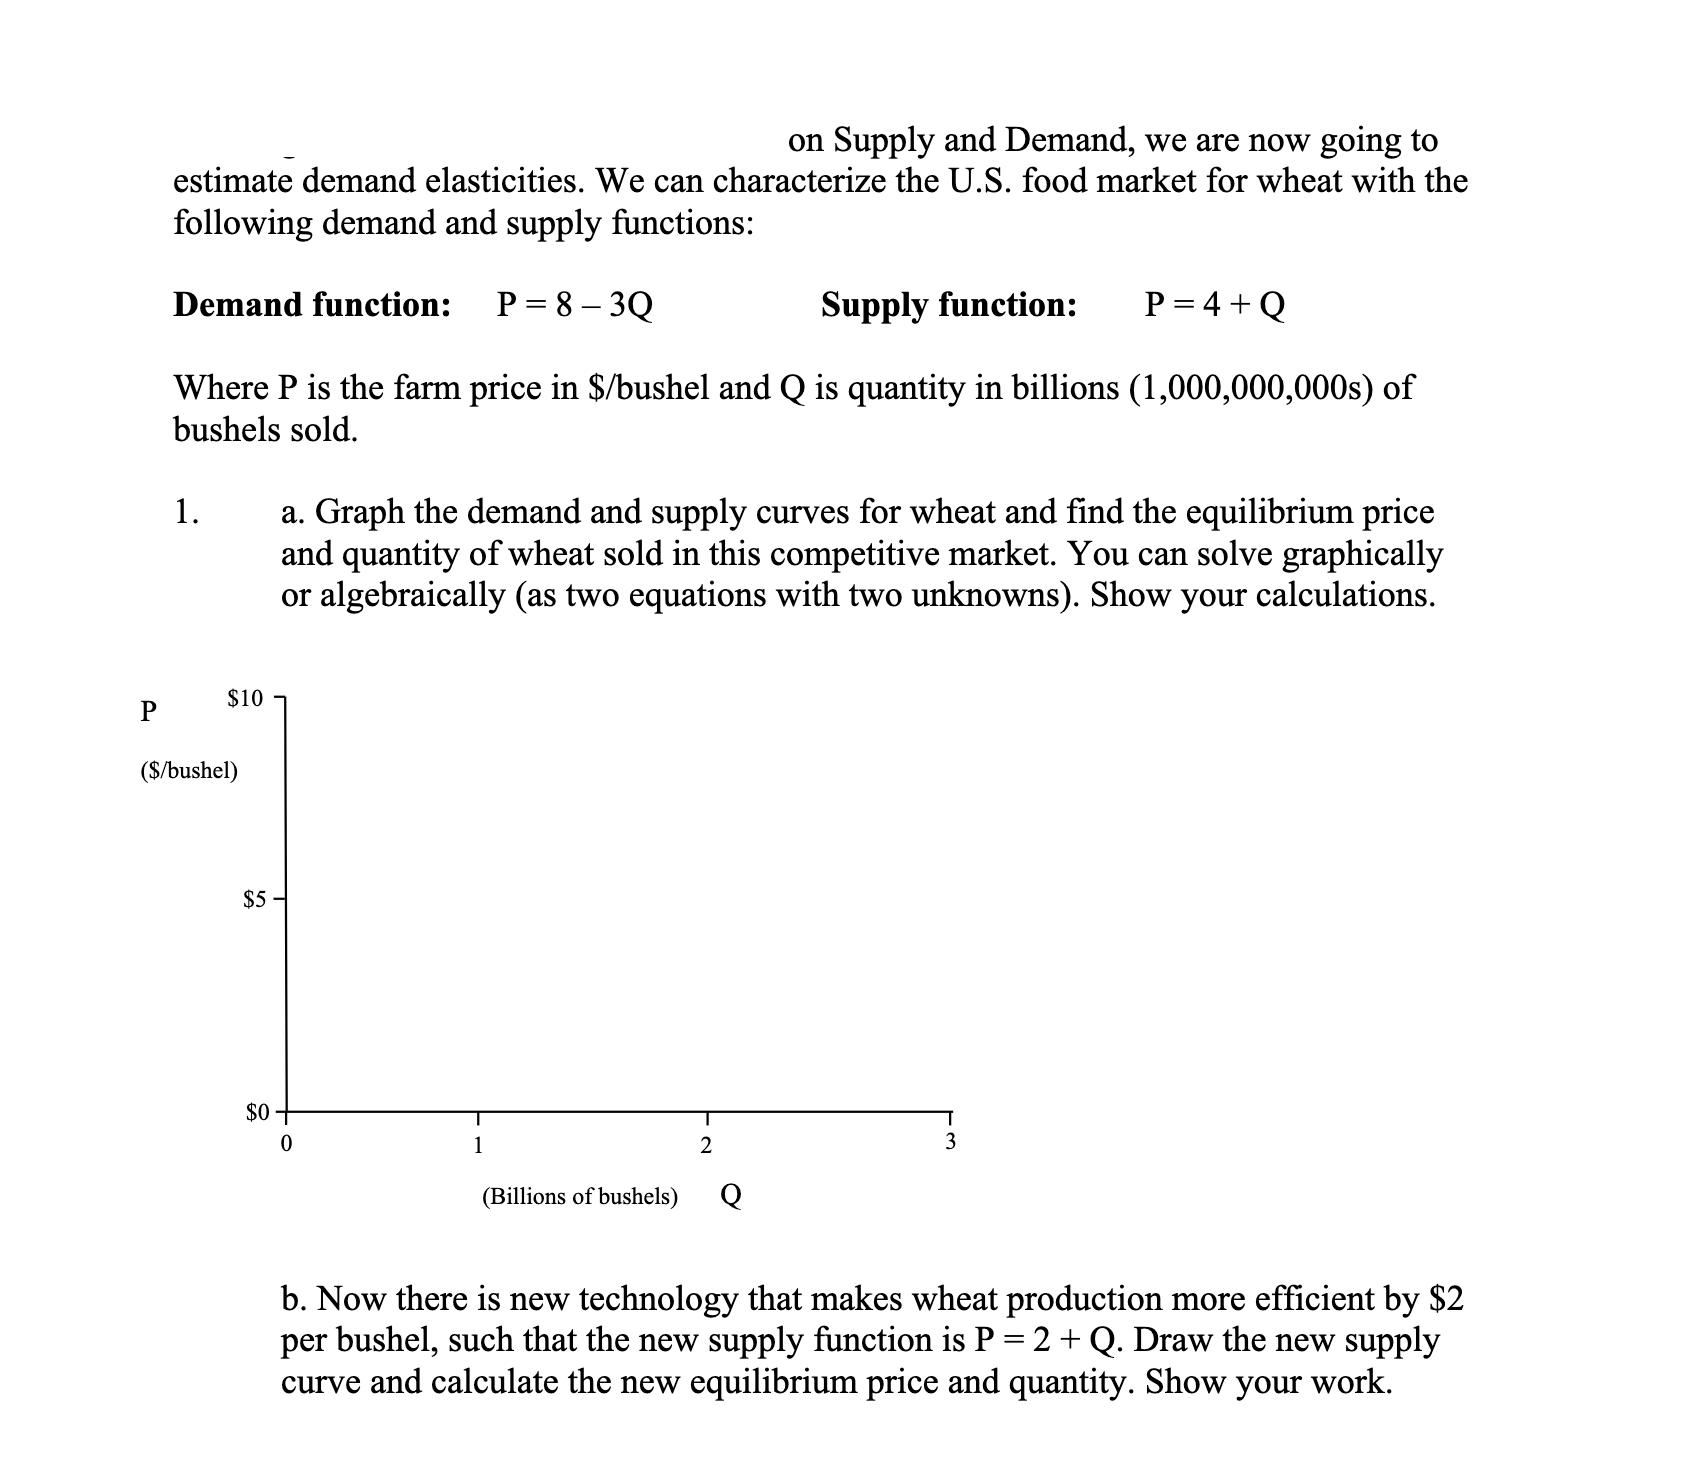
on Supply and Demand, we are now going to estimate demand elasticities. We can characterize the U.S. food market for wheat with the following


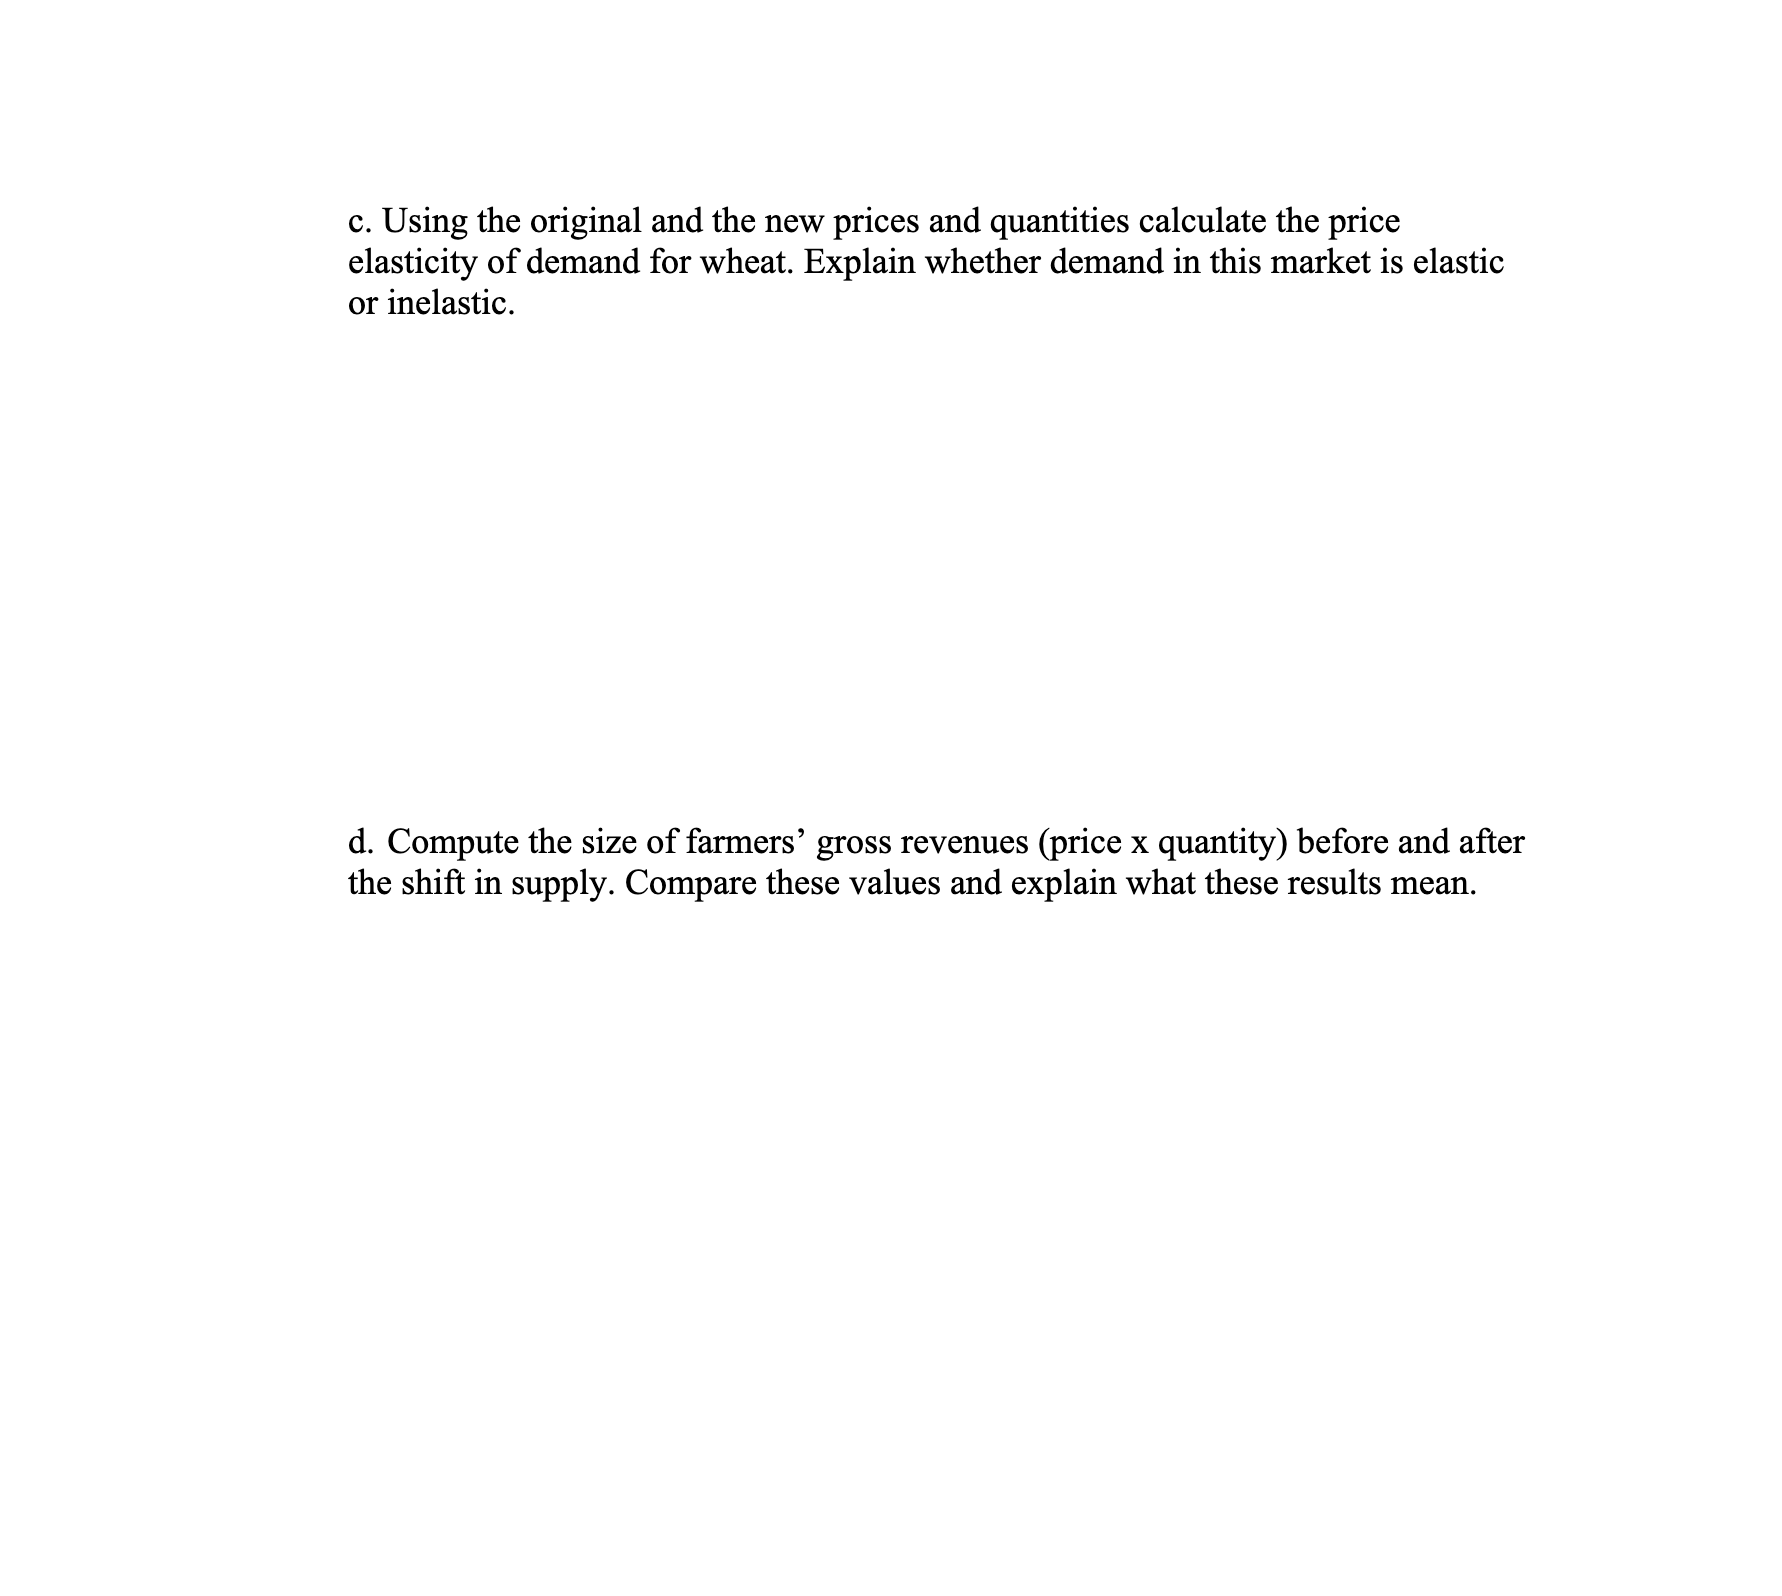
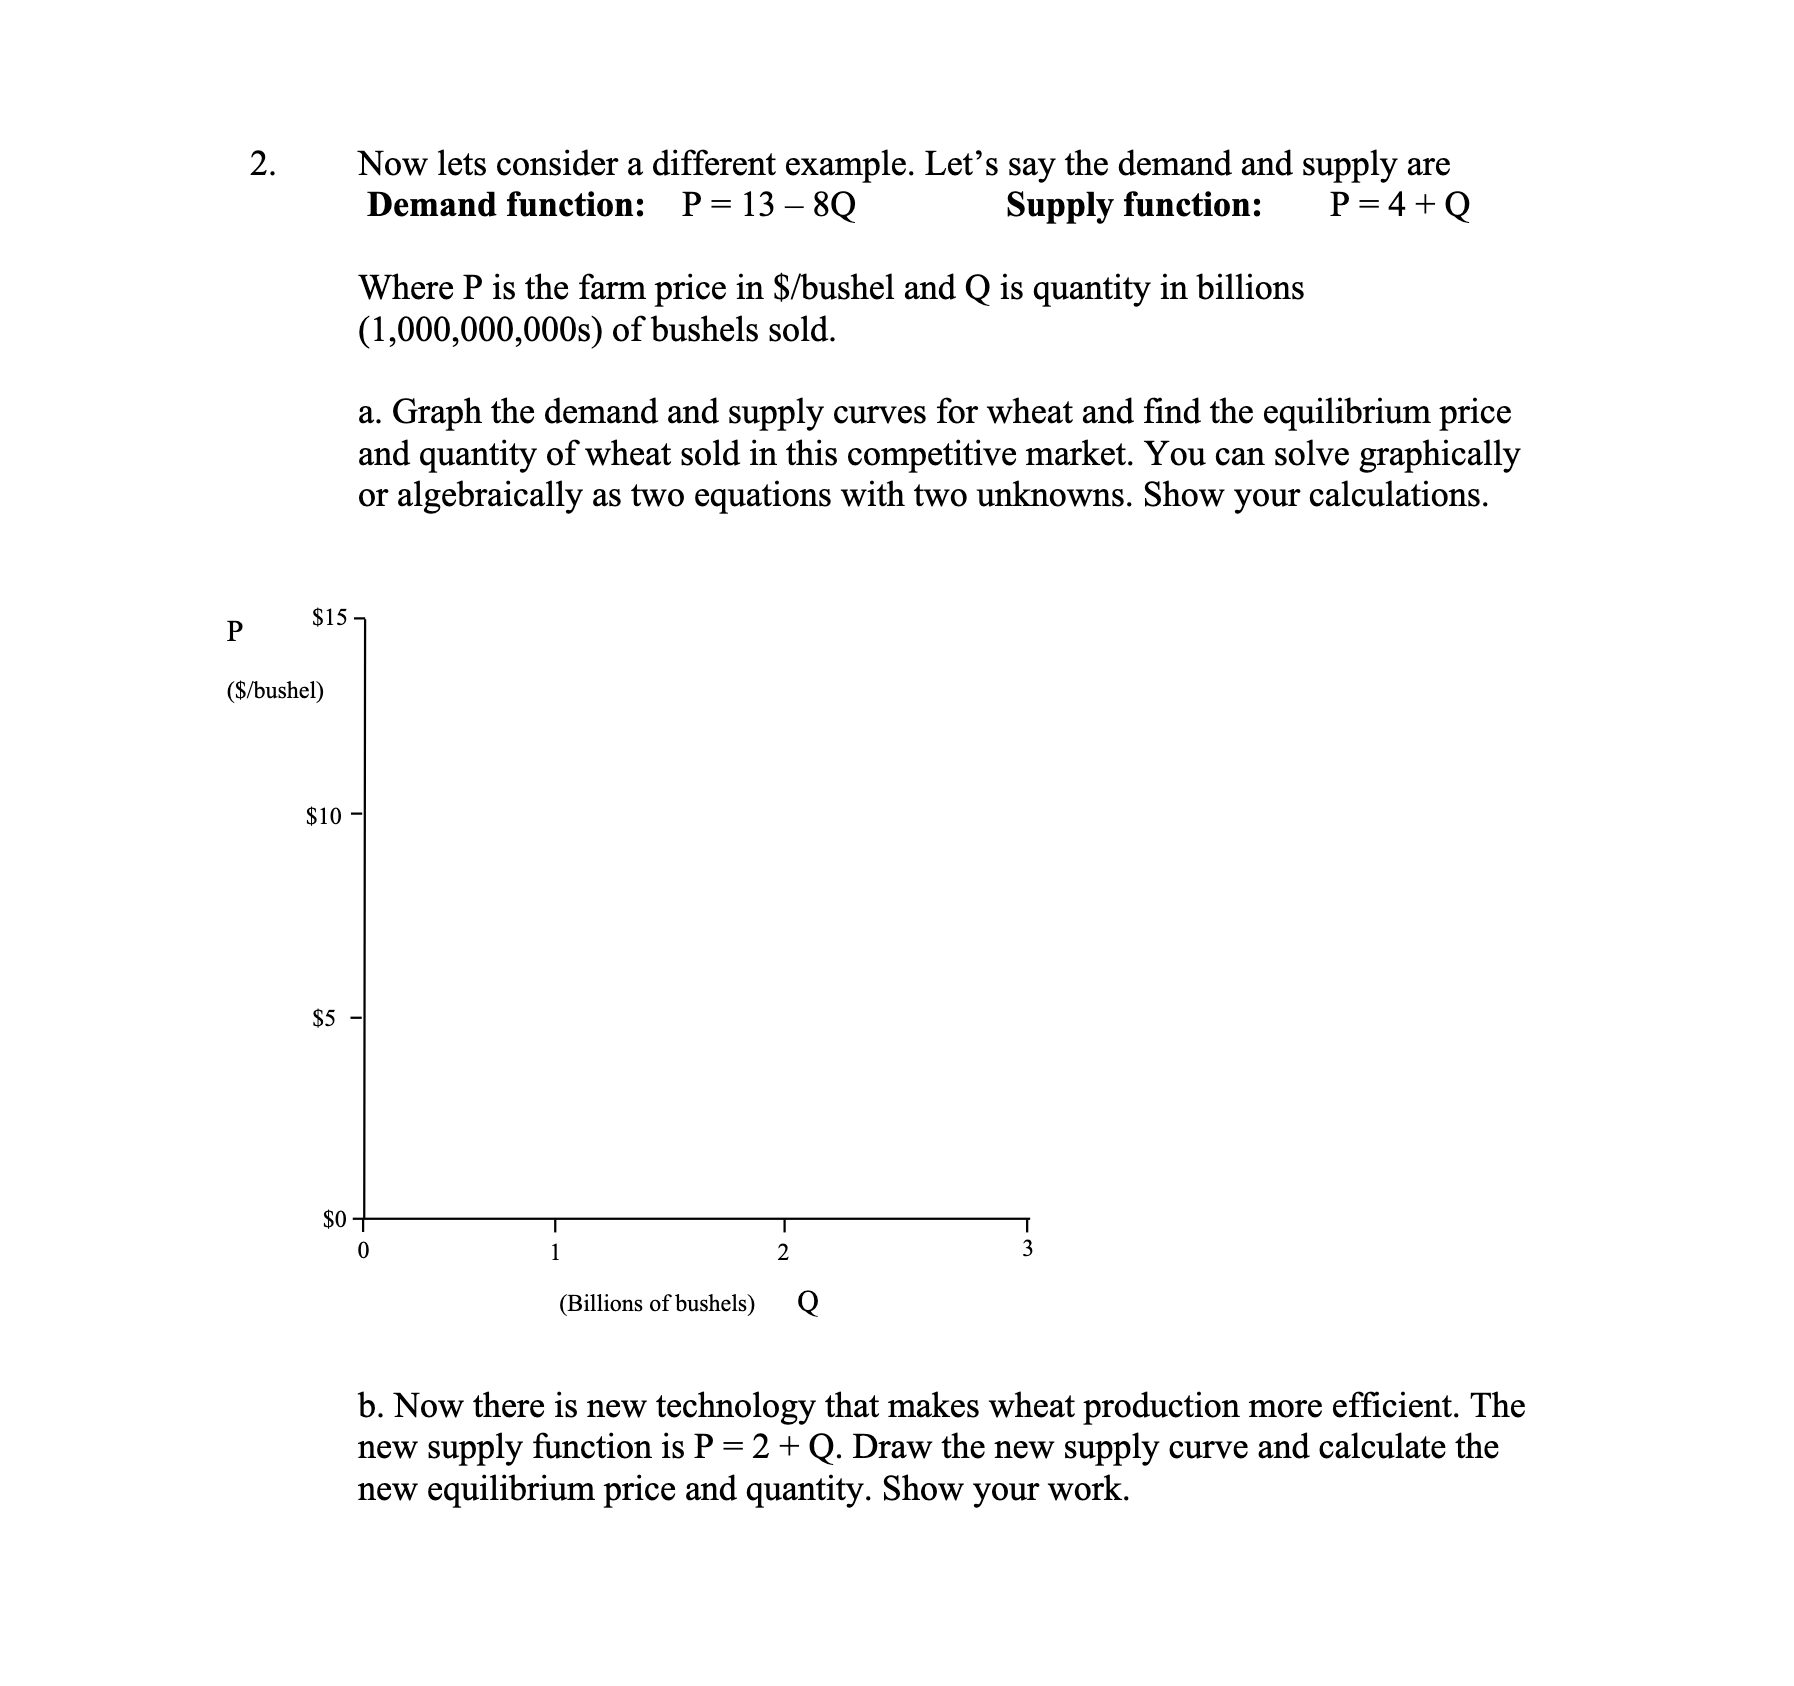
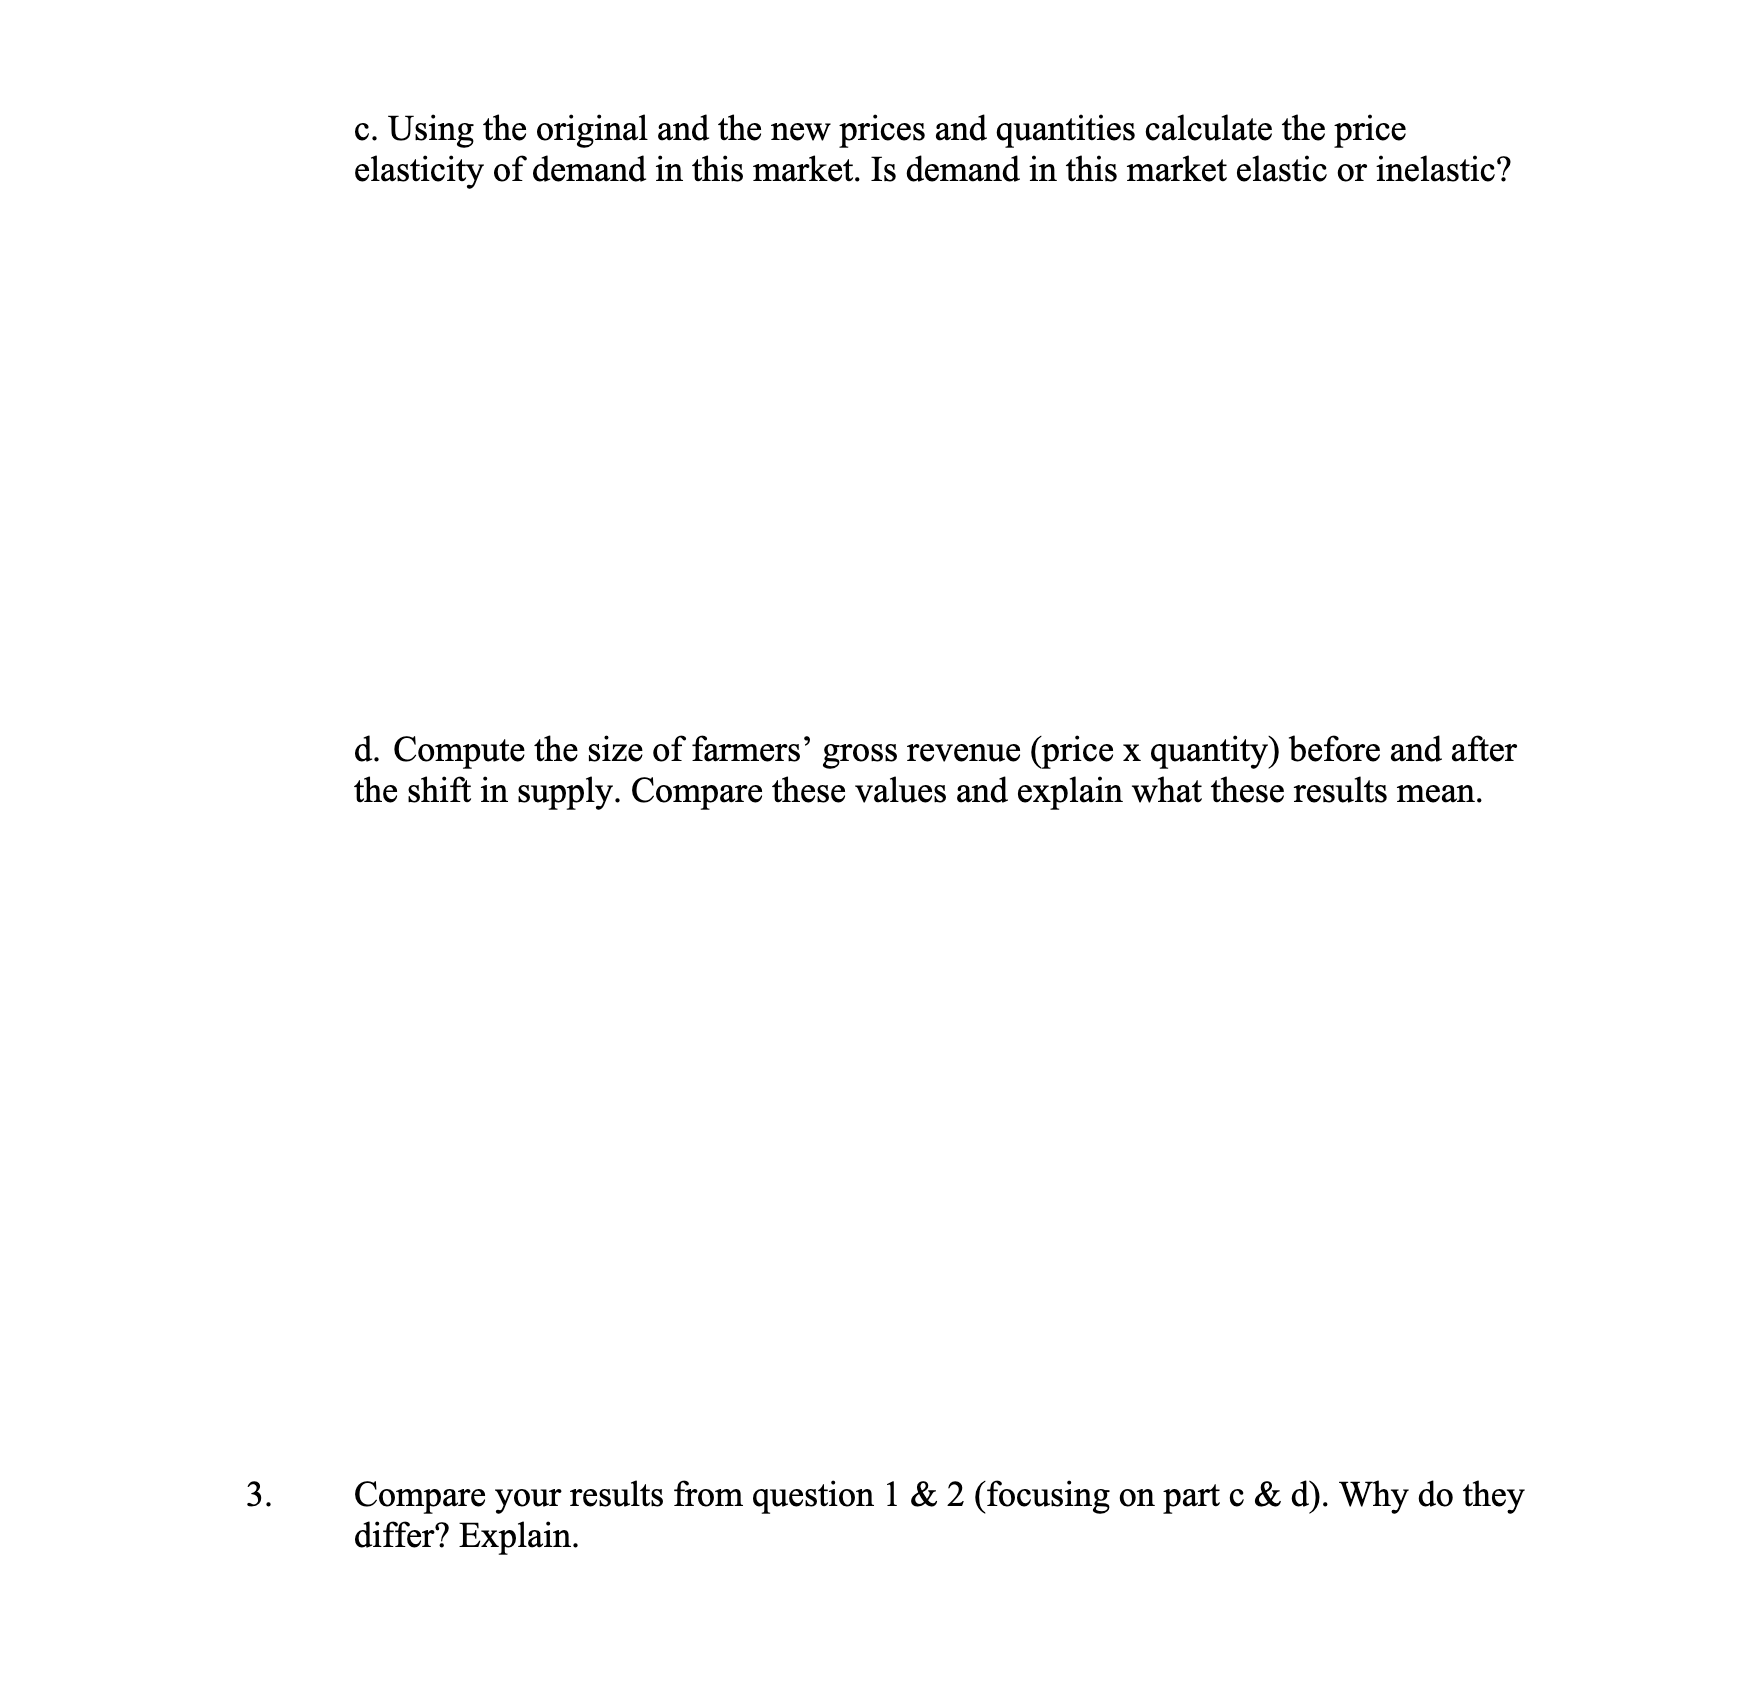
on Supply and Demand, we are now going to estimate demand elasticities. We can characterize the U.S. food market for wheat with the following demand and supply functions: Demand function: P = 8-3Q Supply function: P=4+Q Where P is the farm price in $/bushel and Q is quantity in billions (1,000,000,000s) of bushels sold. 1. a. Graph the demand and supply curves for wheat and find the equilibrium price and quantity of wheat sold in this competitive market. You can solve graphically or algebraically (as two equations with two unknowns). Show your calculations. $10 P ($/bushel) $5 $0 T 0 2 3 (Billions of bushels) Q b. Now there is new technology that makes wheat production more efficient by $2 per bushel, such that the new supply function is P = 2 + Q. Draw the new supply curve and calculate the new equilibrium price and quantity. Show your work. c. Using the original and the new prices and quantities calculate the price elasticity of demand for wheat. Explain whether demand in this market is elastic or inelastic. d. Compute the size of farmers' gross revenues (price x quantity) before and after the shift in supply. Compare these values and explain what these results mean. 2. P$15. ($/bushel) Now lets consider a different example. Let's say the demand and supply are Demand function: P = 13-8Q Supply function: P=4+Q Where P is the farm price in $/bushel and Q is quantity in billions (1,000,000,000s) of bushels sold. a. Graph the demand and supply curves for wheat and find the equilibrium price and quantity of wheat sold in this competitive market. You can solve graphically or algebraically as two equations with two unknowns. Show your calculations. $10- $5 $0 0 1 2 3 (Billions of bushels) Q b. Now there is new technology that makes wheat production more efficient. The new supply function is P = 2 + Q. Draw the new supply curve and calculate the new equilibrium price and quantity. Show your work. 3. c. Using the original and the new prices and quantities calculate the price elasticity of demand in this market. Is demand in this market elastic or inelastic? d. Compute the size of farmers' gross revenue (price x quantity) before and after the shift in supply. Compare these values and explain what these results mean. Compare your results from question 1 & 2 (focusing on part c & d). Why do they differ? Explain.
Step by Step Solution
There are 3 Steps involved in it
Step: 1

Get Instant Access to Expert-Tailored Solutions
See step-by-step solutions with expert insights and AI powered tools for academic success
Step: 2

Step: 3

Ace Your Homework with AI
Get the answers you need in no time with our AI-driven, step-by-step assistance
Get Started


