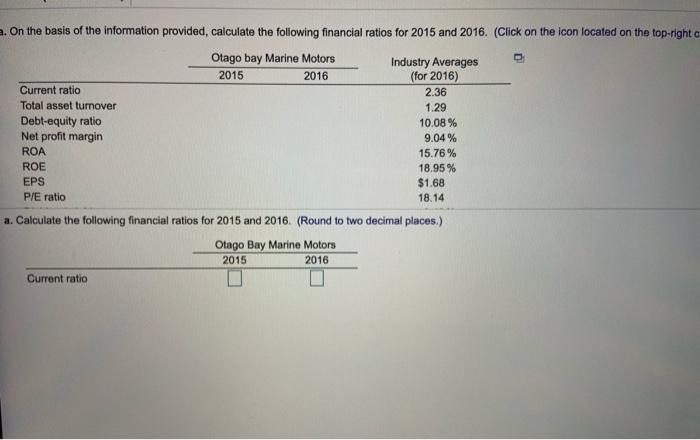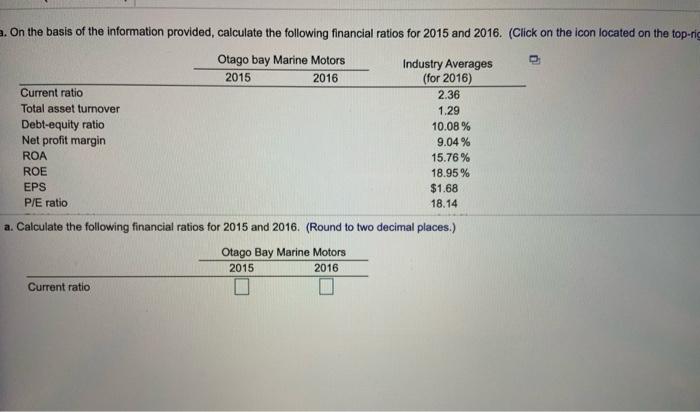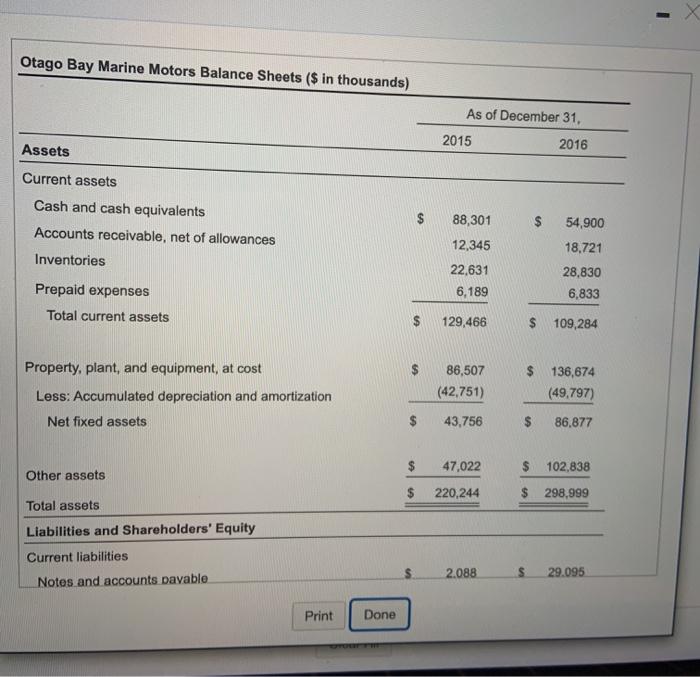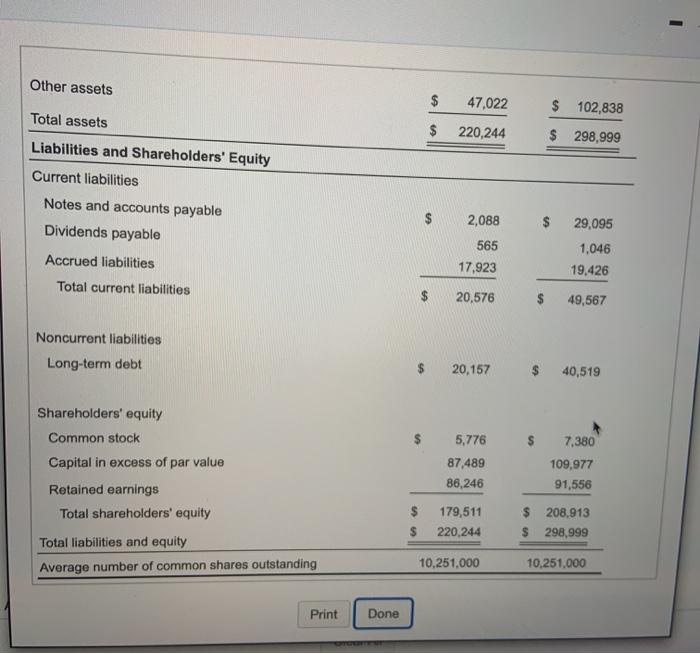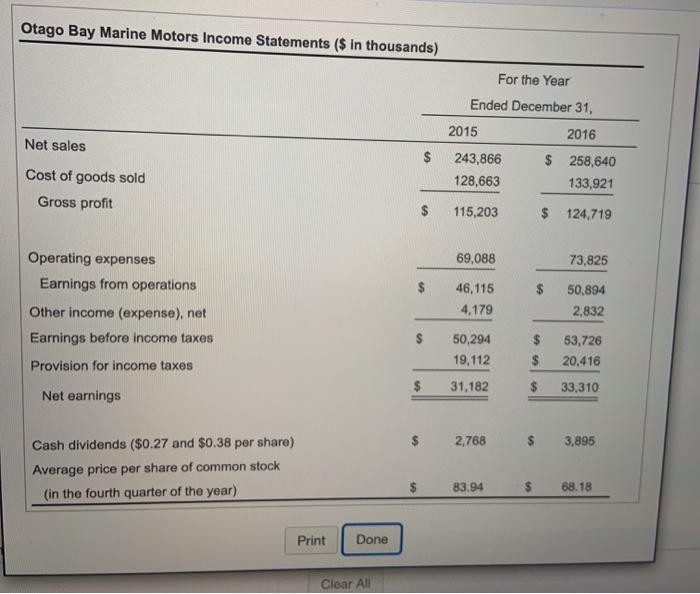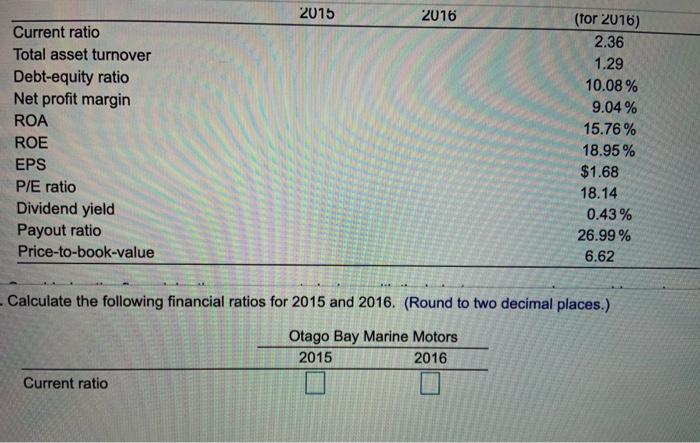
On the basis of the information provided, calculate the following financial ratios for 2015 and 2016. (Click on the icon located on the top-right Otago bay Marine Motors Industry Averages 2015 2016 (for 2016) Current ratio 2.36 Total asset turnover 1.29 Debt-equity ratio 10.08 % Net profit margin 9.04% ROA 15.76% ROE 18.95% EPS $1.68 P/E ratio 18.14 a. Calculate the following financial ratios for 2015 and 2016. (Round to two decimal places.) Otago Bay Marine Motors 2015 2016 Current ratio On the basis of the information provided, calculate the following financial ratios for 2015 and 2016. (Click on the icon located on the top-rig Otago bay Marine Motors Industry Averages 2015 2016 (for 2016) Current ratio 2.36 Total asset turnover 1.29 Debt-equity ratio 10.08 % Net profit margin 9.04% ROA 15.76% ROE 18.95% EPS $1.68 P/E ratio 18.14 a. Calculate the following financial ratios for 2015 and 2016. (Round to two decimal places.) Otago Bay Marine Motors 2015 2016 Current ratio 2015 2016 Current ratio Total asset turnover Debt-equity ratio Net profit margin ROA ROE EPS P/E ratio Dividend yield Payout ratio Price-to-book-value (for 2016) 2.36 1.29 10.08% 9.04% 15.76% 18.95% $1.68 18.14 0.43% 26.99% 6.62 Calculate the following financial ratios for 2015 and 2016. (Round to two decimal places.) Otago Bay Marine Motors 2015 2016 Current ratio Otago Bay Marine Motors Balance Sheets ($ in thousands) As of December 31, 2015 Assets 2016 Current assets Cash and cash equivalents Accounts receivable, net of allowances $ Inventories 88,301 12,345 22.631 6,189 54,900 18,721 28,830 6,833 Prepaid expenses Total current assets 129,466 $ 109,284 Property, plant, and equipment, at cost Less: Accumulated depreciation and amortization Net fixed assets 86,507 (42.751) $ 136,674 (49,797) $ 43,756 $ 86,877 $ 47,022 $ 102,838 Other assets 220,244 $ 298,999 Total assets Liabilities and Shareholders' Equity Current liabilities Notes and accounts pavable $ 2.088 29.095 Print Done - Other assets $ 47,022 $ 102,838 Total assets $ 220,244 $ 298,999 Liabilities and Shareholders' Equity Current liabilities Notes and accounts payable Dividends payable 2,088 $ 29,095 1,046 19,426 565 17,923 Accrued liabilities Total current liabilities $ 20,576 49,567 Noncurrent liabilities Long-term debt $ 20,157 40,519 Shareholders' equity Common stock 5,776 87.489 86,246 Capital in excess of par value Retained earnings Total shareholders' equity Total liabilities and equity Average number of common shares outstanding 7.380 109,977 91,556 $ 208,913 $ 298,999 179,511 220,244 10,251,000 10,251,000 Print Done Otago Bay Marine Motors Income Statements ($ in thousands) For the Year Ended December 31, 2015 2016 Net sales $ Cost of goods sold Gross profit 243,866 128,663 $ 258,640 133,921 $ 115,203 $ 124,719 69,088 73,825 $ Operating expenses Earnings from operations Other income (expense), net Earnings before income taxes Provision for income taxes 46,115 4,179 50,894 2,832 $ 50,294 19,112 $ $ 53,726 20,416 $ 31,182 $ 33,310 Net earnings 2.768 3,895 Cash dividends ($0.27 and $0.38 per share) Average price per share of common stock (in the fourth quarter of the year) 83.94 $ 68.18 Print Done Clear All
