

Answered step by step
Verified Expert Solution
Question
1 Approved Answer
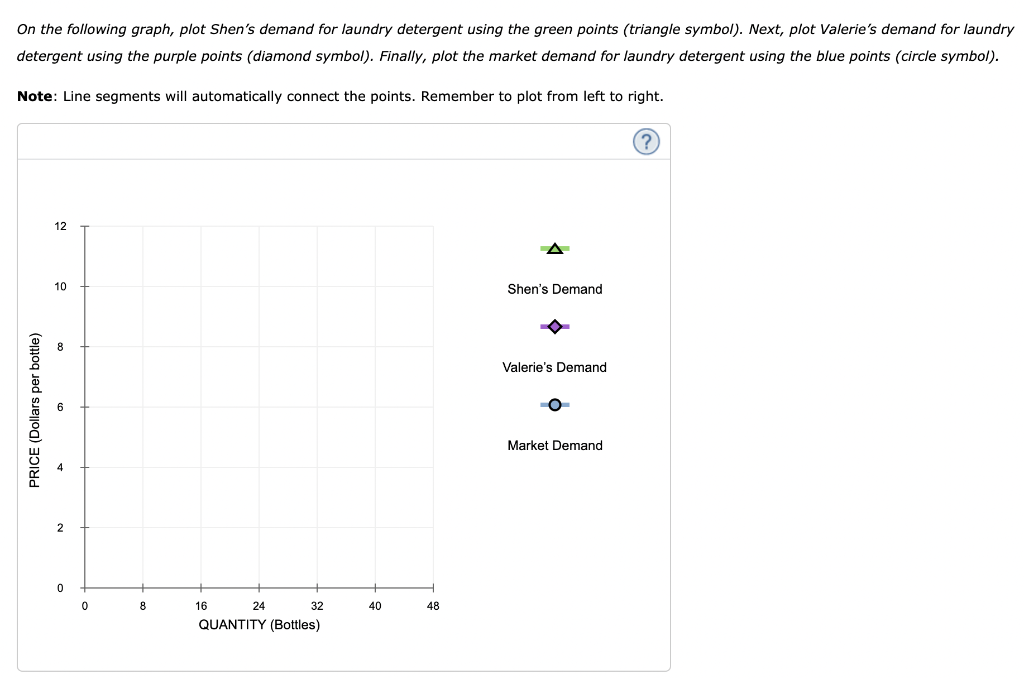
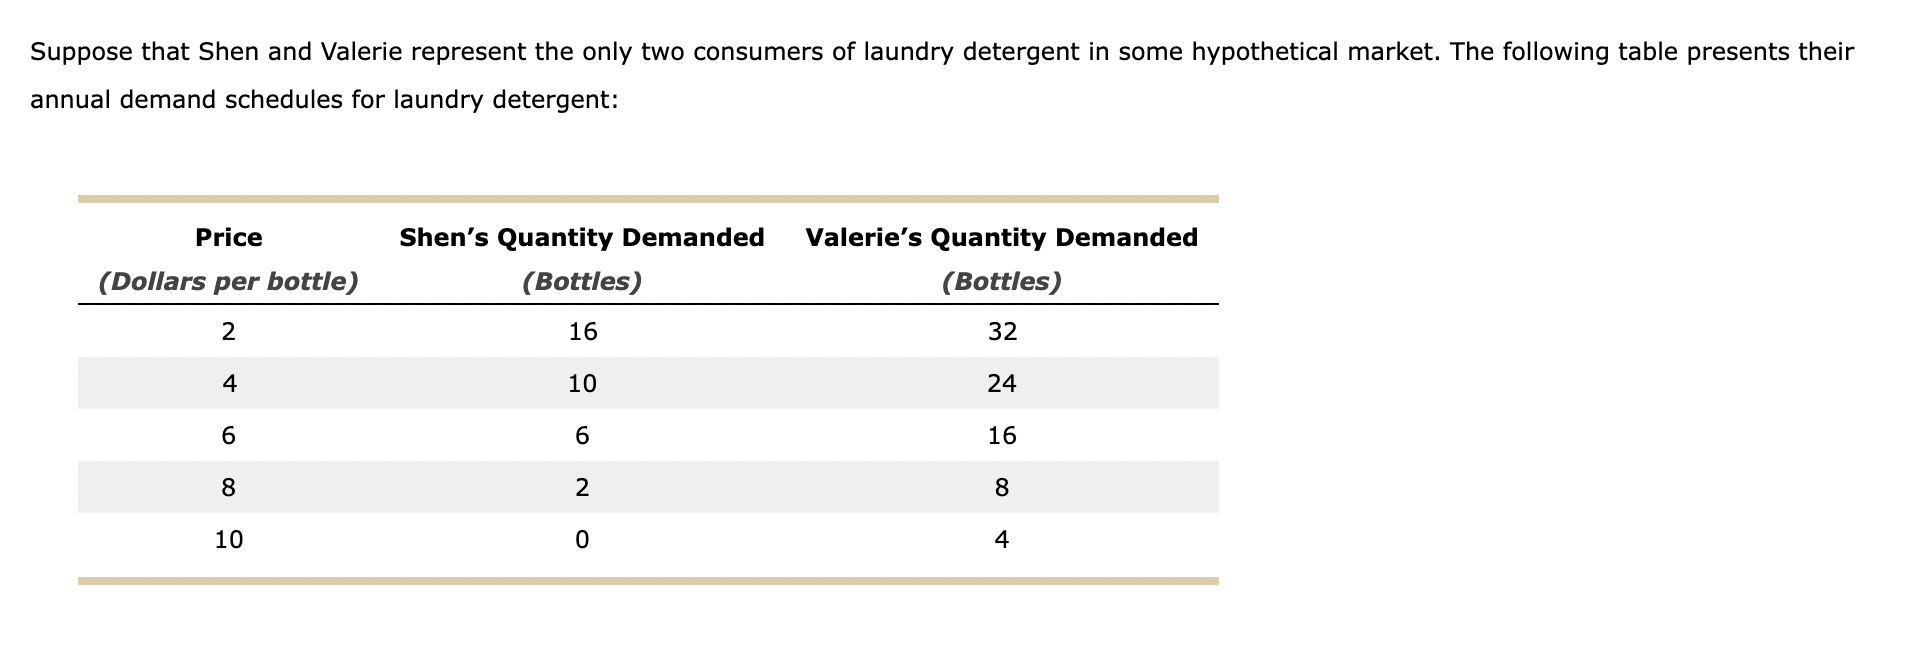
On the following graph, plot Shen's demand for laundry detergent using the green points (triangle symbol). Next, plot Valerie's demand for laundry detergent using the


Step by Step Solution
There are 3 Steps involved in it
Step: 1

Get Instant Access to Expert-Tailored Solutions
See step-by-step solutions with expert insights and AI powered tools for academic success
Step: 2

Step: 3
Ace Your Homework with AI
Get the answers you need in no time with our AI-driven, step-by-step assistance
Get Started
Managerial Economics
Authors: Luke M. Froeb, Brian T. McCann, Michael R. Ward
5th Edition
1337106666, 978-1337106665