

Answered step by step
Verified Expert Solution
Question
1 Approved Answer
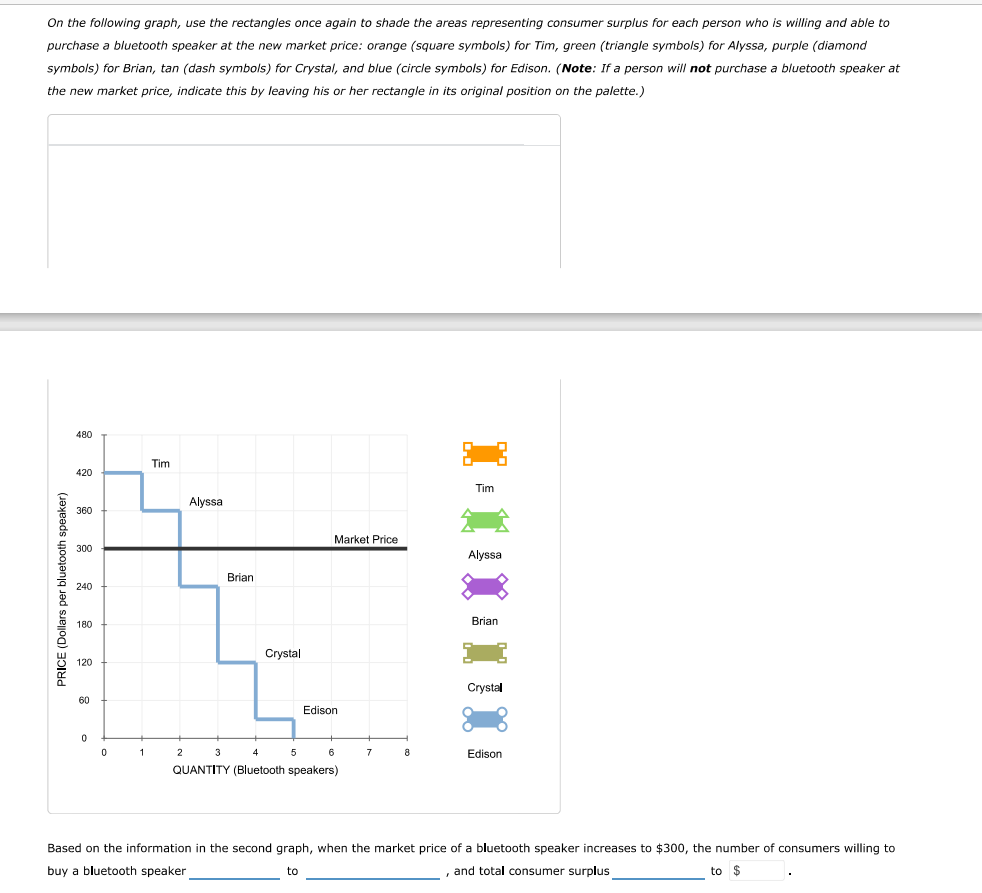
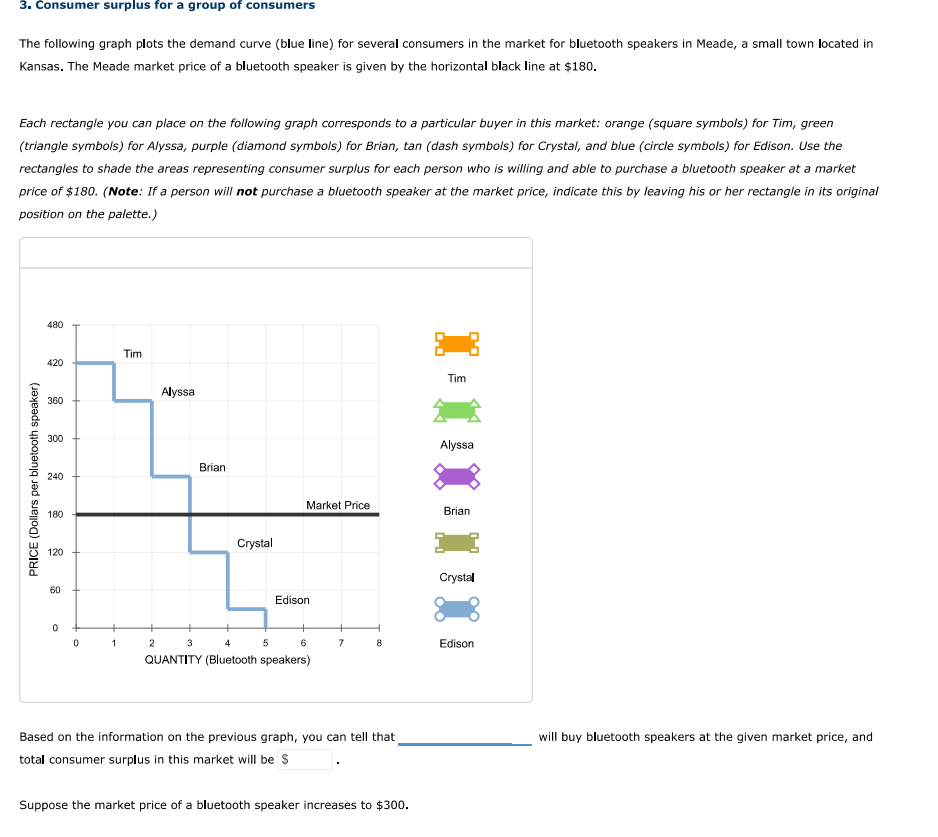
On the following graph, use the rectangles once again to shade the areas representing consumer surplus for each person who is willing and able to


Step by Step Solution
There are 3 Steps involved in it
Step: 1

Get Instant Access to Expert-Tailored Solutions
See step-by-step solutions with expert insights and AI powered tools for academic success
Step: 2

Step: 3
Ace Your Homework with AI
Get the answers you need in no time with our AI-driven, step-by-step assistance
Get Started
Econometrics By Example
Authors: Damodar Gujarati
2nd Edition
1137375019, 9781137375018