Answered step by step
Verified Expert Solution
Link Copied!

Question

1 Approved Answer

...................... oncept Question 4.9 'he graph on the right shows the market for hamburger, which is in equilibrium. Hamburger is a normal good, ind people

......................
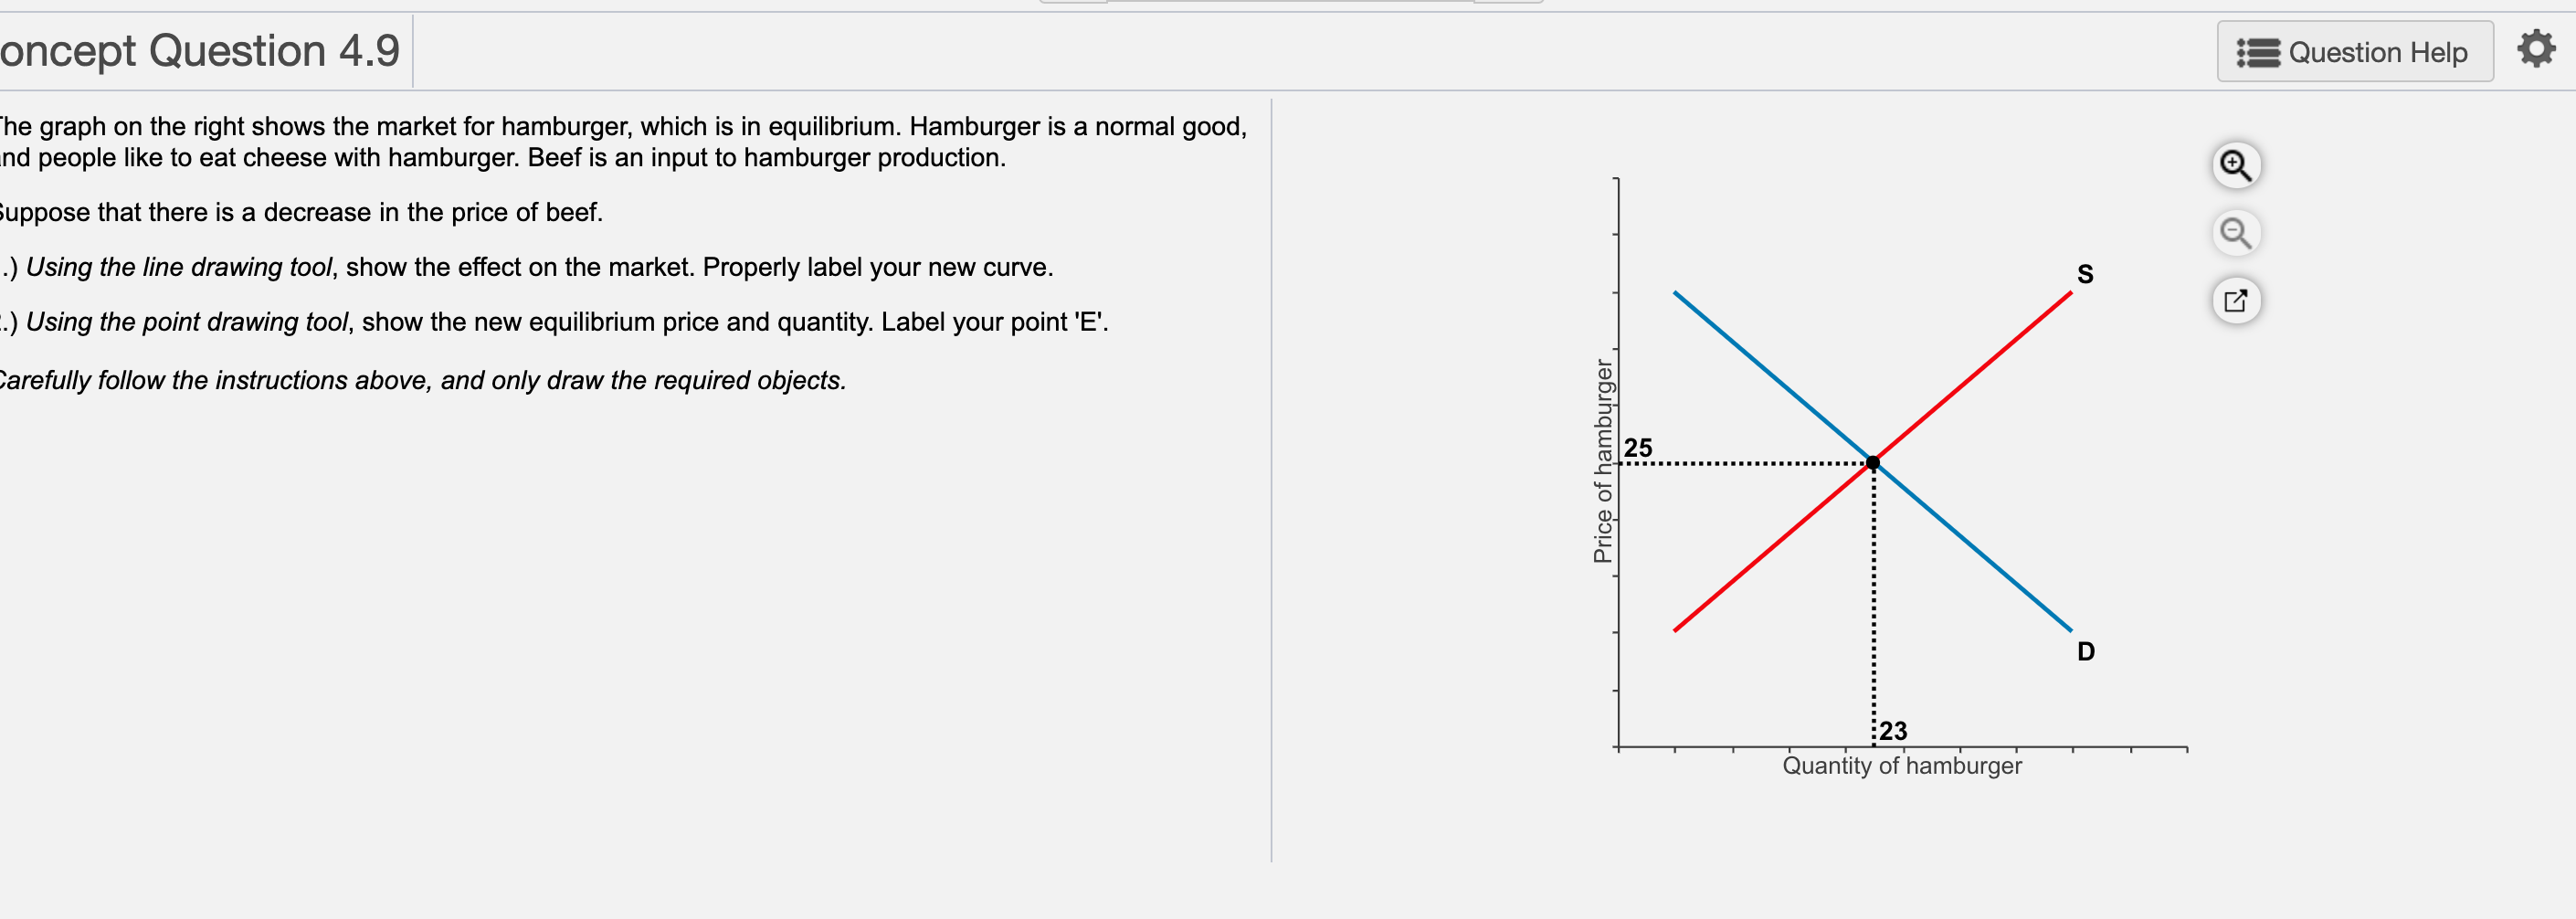
image text in transcribed
oncept Question 4.9 'he graph on the right shows the market for hamburger, which is in equilibrium. Hamburger is a normal good, ind people like to eat cheese with hamburger. Beef is an input to hamburger production. iuppose that there is a decrease in the price of beef. .) Using the line drawing tool, show the effect on the market. Properly label your new curve. 1.) Using the point drawing tool, show the new equilibrium price and quantity. Label your point 'E'. )alefully follow the instmctions above, and only draw the required objects. amburger Price of h Quantity of hamburger

Step by Step Solution

There are 3 Steps involved in it

Step: 1

blur-text-image

Get Instant Access to Expert-Tailored Solutions

See step-by-step solutions with expert insights and AI powered tools for academic success

Step: 2

blur-text-image

Step: 3

blur-text-image

Ace Your Homework with AI

Get the answers you need in no time with our AI-driven, step-by-step assistance

Get Started

Recommended Textbook for

Algebra and Trigonometry

Authors: Ron Larson

10th edition

9781337514255, 1337271179, 133751425X, 978-1337271172

More Books

Students also viewed these Mathematics questions

Question

1.what is rule of law? 2.The administrative body of government?

Answered: 1 week ago

Question

Write a short note on - JUDICIARY

Answered: 1 week ago