Answered step by step
Verified Expert Solution
Link Copied!

Question

1 Approved Answer

one battery of tests this is my statistics hw not the quiz or test 1. It is believed that the more alcohol there is in

image text in transcribedimage text in transcribed

one battery of tests

this is my statistics hw not the quiz or test

image text in transcribedimage text in transcribedimage text in transcribed
1. It is believed that the more alcohol there is in an individual's bloodstream) the slower is that person's reaction time. To test this, 10 volunteers were given different amounts of alcohol. Their blood alcohol levels (3;) were determined as percentages of their body Weights. The volunteers were then tested to determine their reaction times (K) to a. given stimulus. The following data resulted. x = amount of alcohol )1 = reaction time In blood (percent) (seconds) 008 0.32 0.10 0.36 0.12 0.44 0.14 0.42 0.15 0.47 0.16 0.51 0.18 0.63 (a) Plot a scatter diagram. (b) The relationship between the reaction time and the alcohol level can be well approx- imated by a regression line: Y 50 + ,611. Use least square method to estimate the regression ceeicient (B0, '). And draw the line on the scatter plot in (a). (e) Interpret the relationship in terms of the coefcients. (d) Predict the reaction time for an individual (not one of the original volunteers) whose blood alcohol content is x = 0.10 and 0.17. (e) Due to subject differences, the regression line only explains a part of the variations of Y regarding to the changes of x. What is the proportion of variations can be explained (i.e., R2)? (f) Compute the sample covariance and sample correlation between Y and X. Comment on their relations to 1. (g) Compute the estimation variance for B1. And perform the t-test for checking Ho : B1 = 0 v.s. H1 : B1 # 0.(e) Due to subject differences, the regression line only explains a part of the variations of Y regarding to the changes of x. What is the proportion of variations can be explained (i.e., R2)? (f) Compute the sample covariance and sample correlation between Y and X. Comment on their relations to 1. (g) Compute the estimation variance for B1. And perform the t-test for checking Ho : B1 = 0 v.s. H1 : B1 # 0

Step by Step Solution

There are 3 Steps involved in it

Step: 1

blur-text-image

Get Instant Access to Expert-Tailored Solutions

See step-by-step solutions with expert insights and AI powered tools for academic success

Step: 2

blur-text-image

Step: 3

blur-text-image

Ace Your Homework with AI

Get the answers you need in no time with our AI-driven, step-by-step assistance

Get Started

Recommended Textbook for

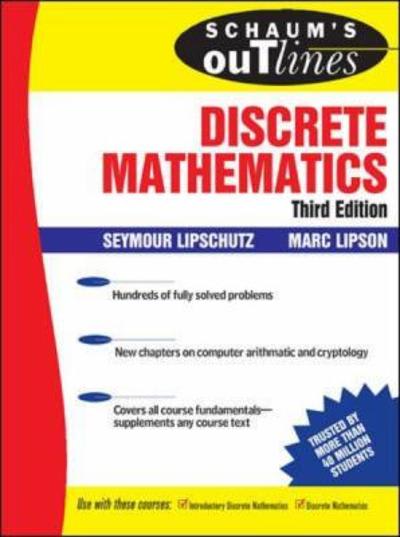
Discrete Mathematics, Revised

Authors: Seymour Lipschutz, Marc Lipson

3rd Edition

0071615873, 9780071615877

More Books

Students also viewed these Mathematics questions

Question

2. Ask questions, listen rather than attempt to persuade.

Answered: 1 week ago