Question
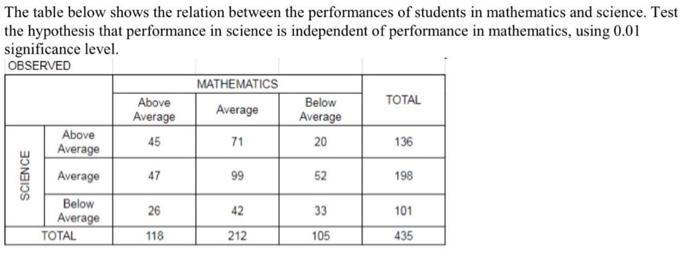
The table below shows the relation between the performances of students in mathematics and science. Test the hypothesis that performance in science is independent

The table below shows the relation between the performances of students in mathematics and science. Test the hypothesis that performance in science is independent of performance in mathematics, using 0.01 significance level. OBSERVED SCIENCE Above Average Average Below Average TOTAL Above Average 45 47 26 118 MATHEMATICS Average 71 99 42 212 Below Average 20 52 33 105 TOTAL 136 198 101 435
Step by Step Solution
3.36 Rating (149 Votes )
There are 3 Steps involved in it
Step: 1
1 2 3 A 4 5 Above Average 6 Average Below Average Total B Observed Frequencies SCIENCE 7 8 9 10 11 1...
Get Instant Access to Expert-Tailored Solutions
See step-by-step solutions with expert insights and AI powered tools for academic success
Step: 2

Step: 3

Ace Your Homework with AI
Get the answers you need in no time with our AI-driven, step-by-step assistance
Get StartedRecommended Textbook for
Microeconomics Theory And Applications With Calculus
Authors: Jeffrey M. Perloff
4th Edition
134167384, 134167381, 978-0134167381
Students also viewed these General Management questions
Question
Answered: 1 week ago
Question
Answered: 1 week ago
Question
Answered: 1 week ago
Question
Answered: 1 week ago
Question
Answered: 1 week ago
Question
Answered: 1 week ago
Question
Answered: 1 week ago
Question
Answered: 1 week ago
Question
Answered: 1 week ago
Question
Answered: 1 week ago
Question
Answered: 1 week ago
Question
Answered: 1 week ago
Question
Answered: 1 week ago
Question
Answered: 1 week ago
Question
Answered: 1 week ago
Question
Answered: 1 week ago
Question
Answered: 1 week ago
Question
Answered: 1 week ago
Question
Answered: 1 week ago
Question
Answered: 1 week ago
Question
Answered: 1 week ago
Question
Answered: 1 week ago
Question
Answered: 1 week ago
View Answer in SolutionInn App


