Answered step by step
Verified Expert Solution
Question
1 Approved Answer
One variable that Google uses to rank pages on the Internet is page speed-the time it takes for a web page to load into
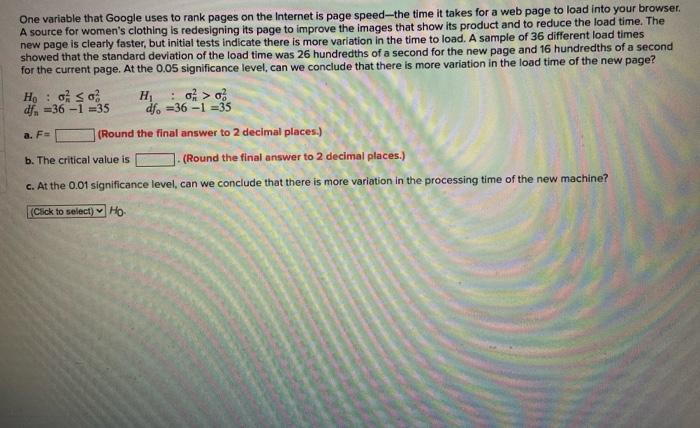
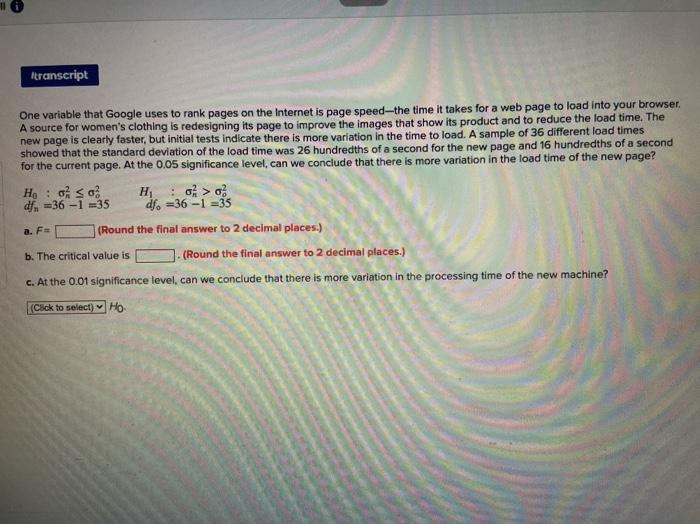
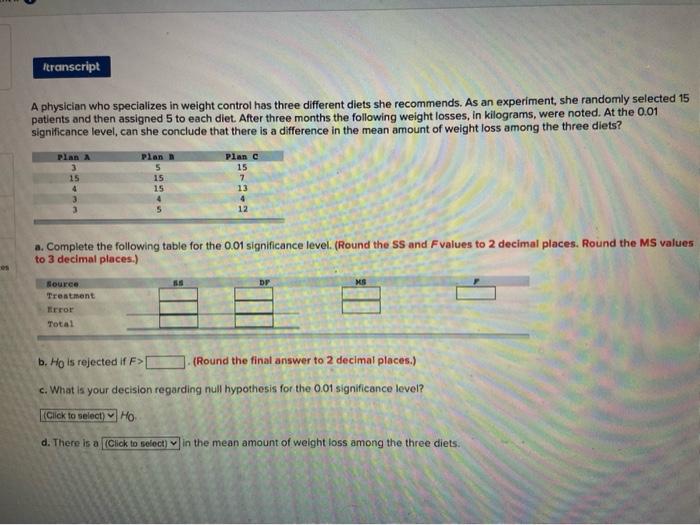
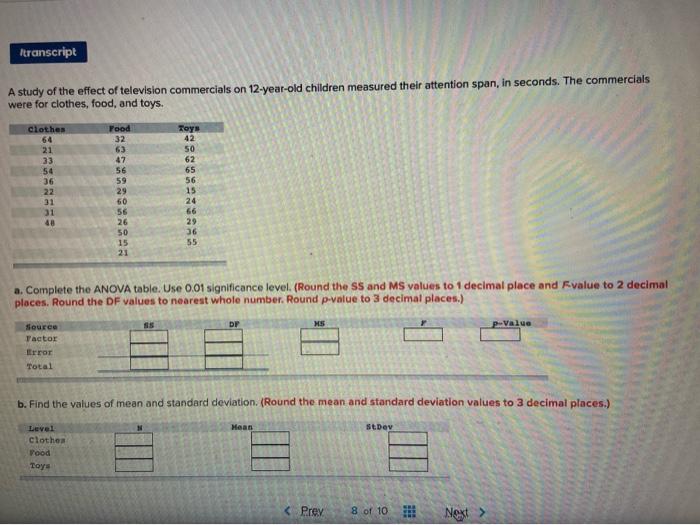

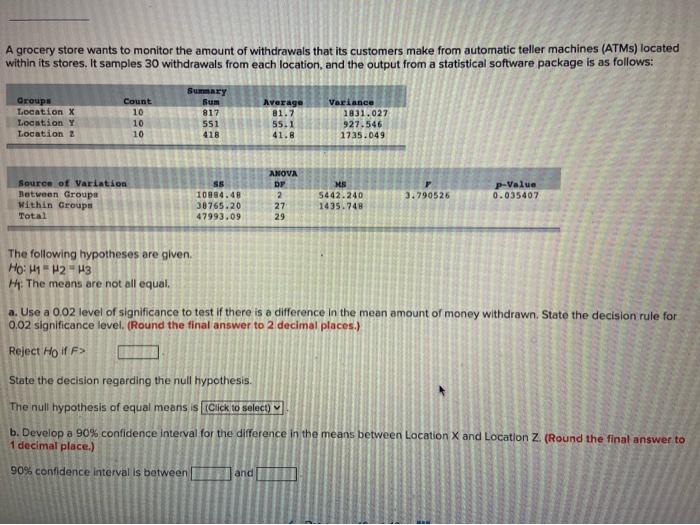
One variable that Google uses to rank pages on the Internet is page speed-the time it takes for a web page to load into your browser. A source for women's clothing is redesigning its page to improve the images that show its product and to reduce the load time. The new page is clearly faster, but initial tests indicate there is more variation in the time to load. A sample of 36 different load times showed that the standard deviation of the load time was 26 hundredths of a second for the new page and 16 hundredths of a second for the current page. At the 0.05 significance level, can we conclude that there is more variation in the load time of the new page? H : 0 > 0 dfo=36-1 =35 Ho: oso df =36-1 =35 a. F= b. The critical value is (Round the final answer to 2 decimal places.) c. At the 0.01 significance level, can we conclude that there is more variation in the processing time of the new machine? (Click to select) Ho (Round the final answer to 2 decimal places.) Itranscript One variable that Google uses to rank pages on the Internet is page speed-the time it takes for a web page to load into your browser. A source for women's clothing is redesigning its page to improve the images that show its product and to reduce the load time. The new page is clearly faster, but initial tests indicate there is more variation in the time to load. A sample of 36 different load times showed that the standard deviation of the load time was 26 hundredths of a second for the new page and 16 hundredths of a second for the current page. At the 0.05 significance level, can we conclude that there is more variation in the load time of the new page? H Ho o so df =36-1 =35 a. Fa dfo=36-1-35 (Round the final answer to 2 decimal places.) b. The critical value is (Round the final answer to 2 decimal places.) c. At the 0.01 significance level, can we conclude that there is more variation in the processing time of the new machine? (Click to select) Ho ces Itranscript A physician who specializes in weight control has three different diets she recommends. As an experiment, she randomly selected 15 patients and then assigned 5 to each diet. After three months the following weight losses, in kilograms, were noted. At the 0.01 significance level, can she conclude that there is a difference in the mean amount of weight loss among the three diets? Plan A 3 15 4 3 3 Source Treatment Plan B 5 15 15 Error Total 4 5 a. Complete the following table for the 0.01 significance level. (Round the SS and F values to 2 decimal places. Round the MS values. to 3 decimal places.) Plan C 15 7 13 4 12 b. Ho is rejected if F> (Round the final answer to 2 decimal places.) c. What is your decision regarding null hypothesis for the 0.01 significance level? (Click to select) Ho d. There is a (Click to select) in the mean amount of weight loss among the three diets. Itranscript A study of the effect of television commercials on 12-year-old children measured their attention span, in seconds. The commercials were for clothes, food, and toys. clothes 64 21 33 54 36 22 31 31 48 Source Factor Error Total Food 32 63 47 56 59 29 Level clothes Food Toys 60 56 26 50 15 21 a. Complete the ANOVA table. Use 0.01 significance level. (Round the SS and MS values to 1 decimal place and Evalue to 2 decimal places. Round the DF values to nearest whole number. Round p-value to 3 decimal places.) Toys 42 50 62 65 56 15 24 66 SS 29 36 55 DF MS b. Find the values of mean and standard deviation. (Round the mean and standard deviation values to 3 decimal places.) Hean < Prev St.Dev 8 of 10 P-Value Next Itranscript The fuel efficiencies for a sample of 27 compact, midsize, and large cars are entered into a statistical software package. Use the 0.02 significance level. Groups Compact Midsize Large Count 12 6 Additional results are shown below. Source of Variation Between Groups Within Groups Total Summary Sun 267.3 173.7 102.7 SS 141.4528 191.4755 320.1081 Average 22.27500 19.30000 17.11667 ANOVA DF 2 24 26 Variance 9.556875 7.566350 7.549 MA 70.72640 7,97815 (Click to select) a. What is the critical value and the test statistic? (Round the final answers to 2 decimal places.) Critical value is The test statistic is b. Investigate whether there are any differences in the mean fuel efficiencies of the three cars. The mean fuel efficiencies are (Click to select) c. State the decision regarding the null hypothesis? The null hypothesis of equal means is < Prev 8.865018 of 10 p-Value 0.001310 Next A grocery store wants to monitor the amount of withdrawals that its customers make from automatic teller machines (ATMs) located within its stores. It samples 30 withdrawals from each location, and the output from a statistical software package is as follows: Groups Location X Location Y Location 2 Count 10 10 10 Source of Variation Between Groupa Within Groups Total Summary Sum 817 The following hypotheses are given. Ho: H1 H2 H3 H: The means are not all equal. 551 418 55 10984.48 38765.20 47993.09 Average 81.7 55.1 41.8 ANOVA DF 2 27 29 and Variance 1831.027 927,546 1735.049 MS 5442.240 1435.748 3.790526 p-Value 0.035407 a. Use a 0.02 level of significance to test if there is a difference in the mean amount of money withdrawn. State the decision rule for 0.02 significance level. (Round the final answer to 2 decimal places.) Reject Ho if F> State the decision regarding the null hypothesis. The null hypothesis of equal means is (Click to select) b. Develop a 90% confidence interval for the difference in the means between Location X and Location Z. (Round the final answer to 1 decimal place.) 90% confidence interval is between [
Step by Step Solution
There are 3 Steps involved in it
Step: 1
Answer Null Hypothesis H0 The new page has the same variation in load times as the current page Alte...
Get Instant Access to Expert-Tailored Solutions
See step-by-step solutions with expert insights and AI powered tools for academic success
Step: 2

Step: 3

Ace Your Homework with AI
Get the answers you need in no time with our AI-driven, step-by-step assistance
Get Started


