Online HW 3: Frequency Dist., Histogram and Boxplots Page 1: Previous Page Next Page Page 1 of 15 1 Question 1 (1 point) Page 2:
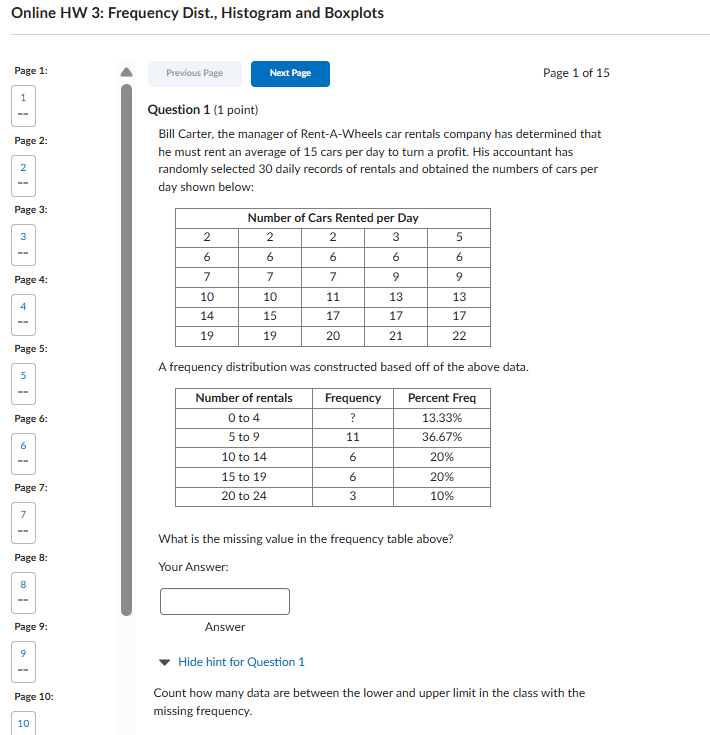
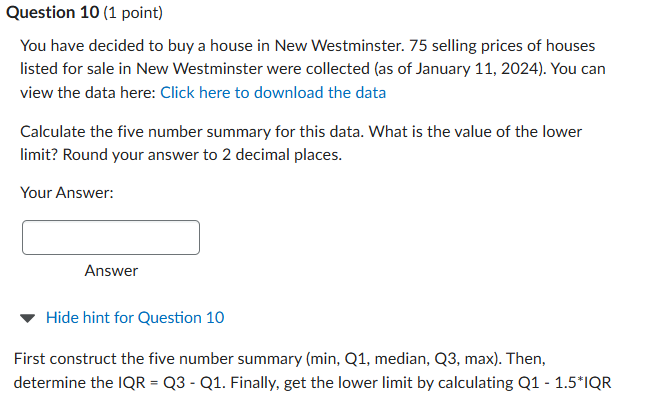
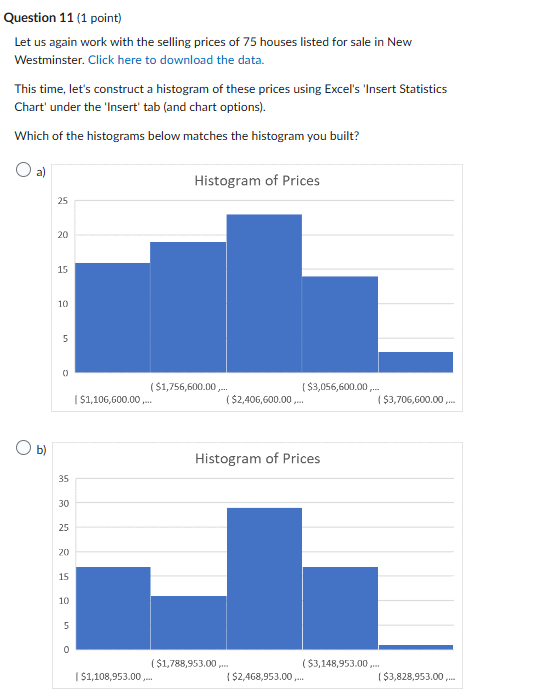
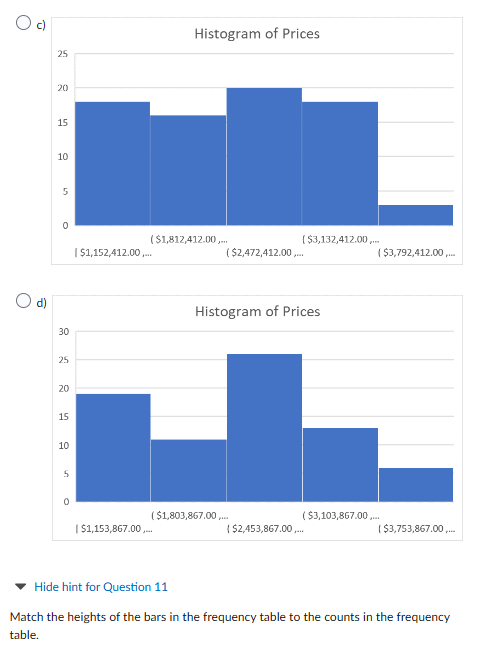
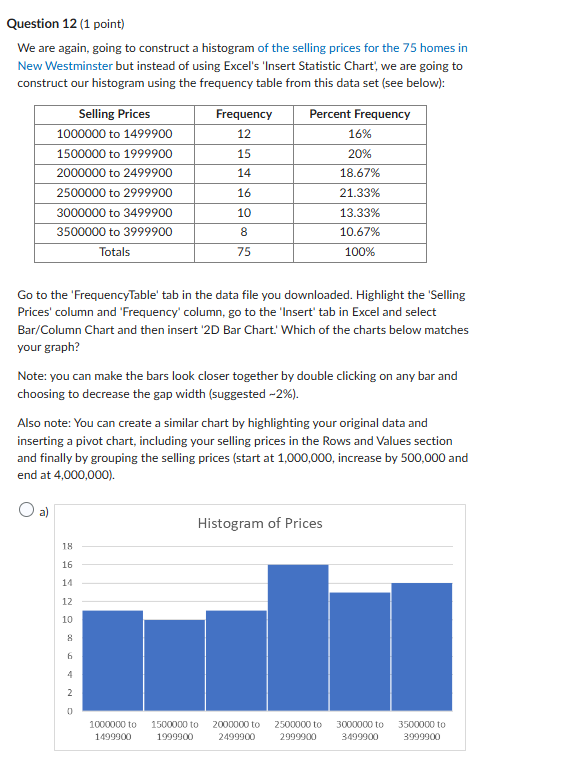
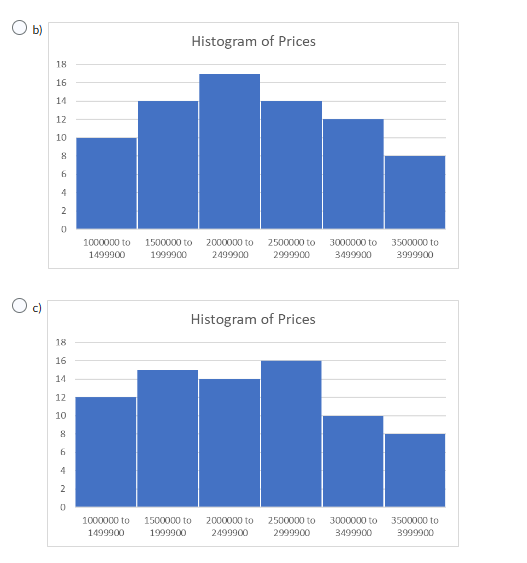
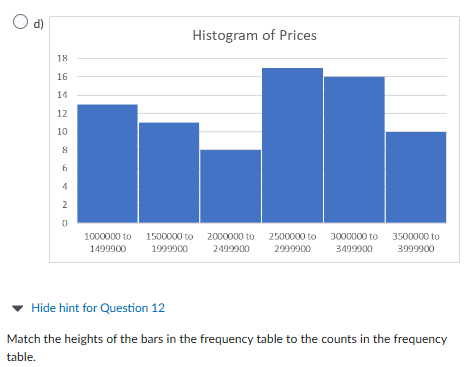
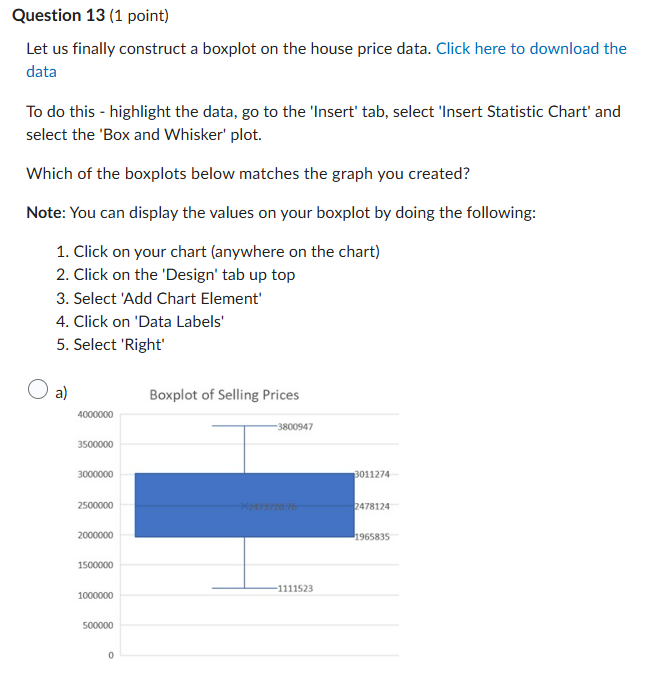
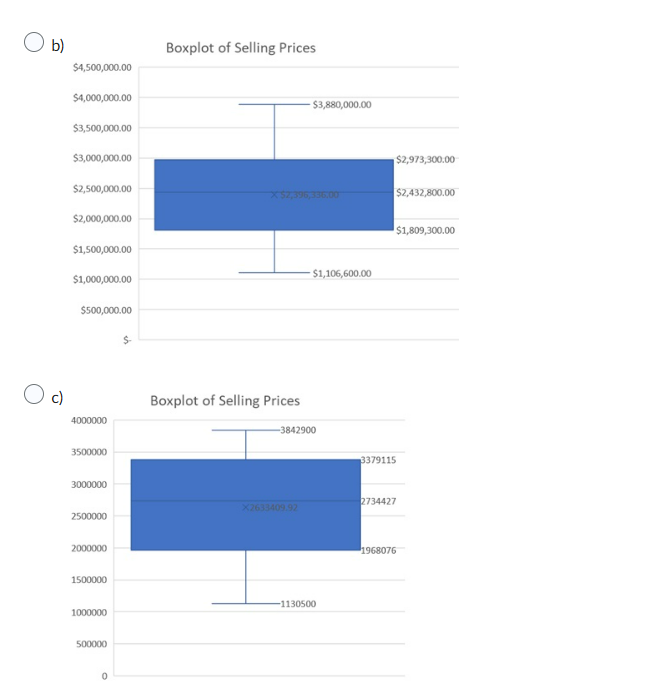
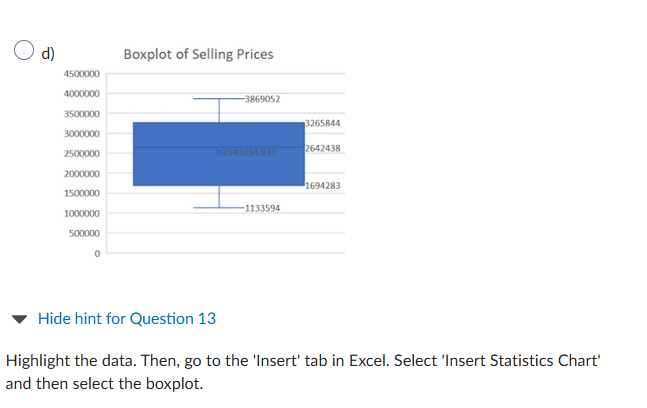
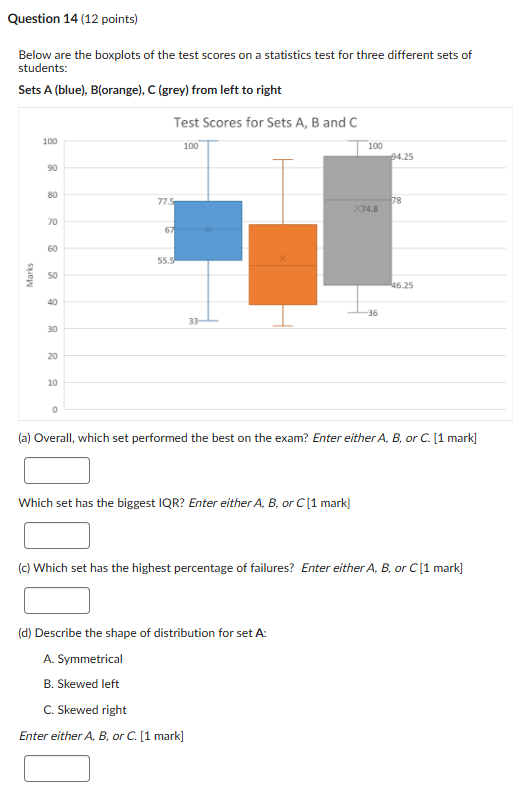
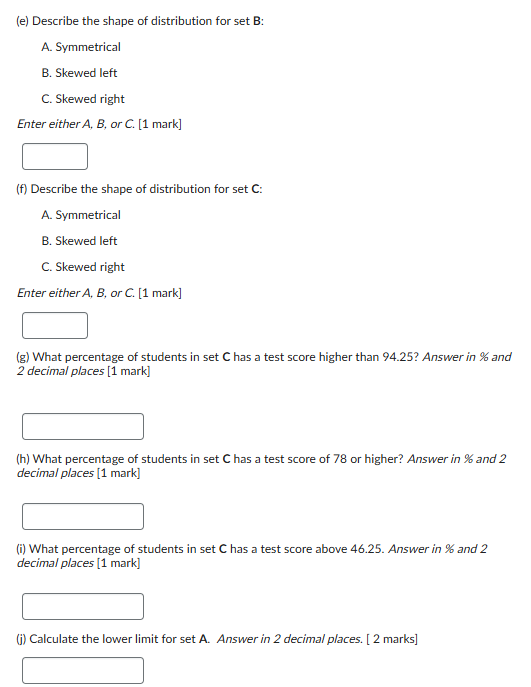
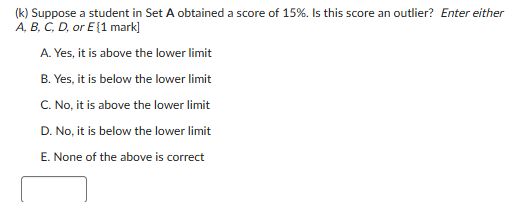
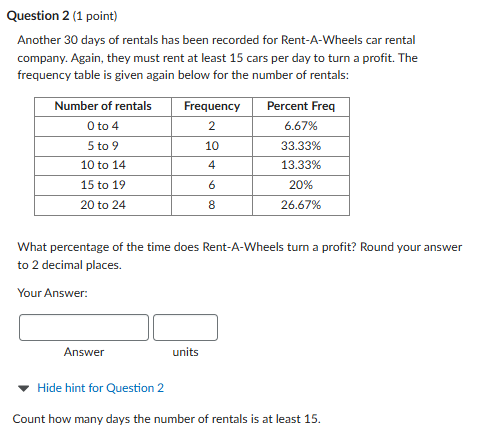
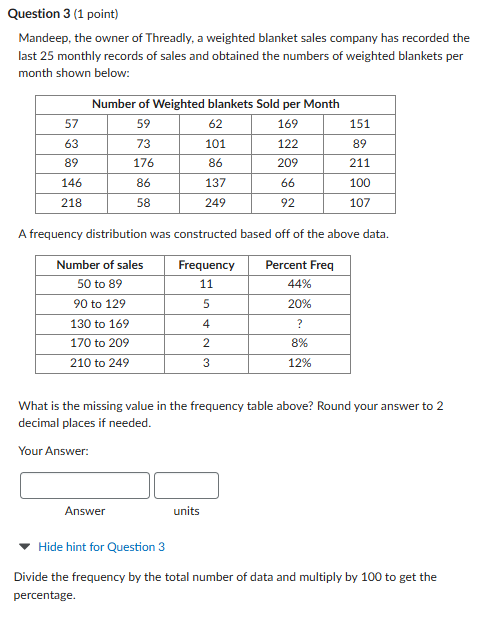
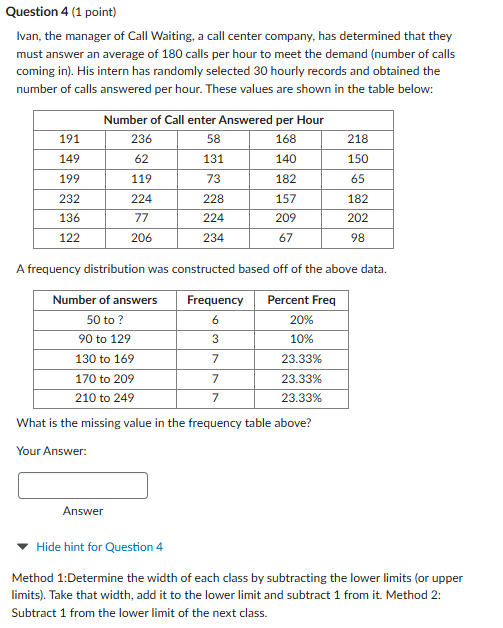
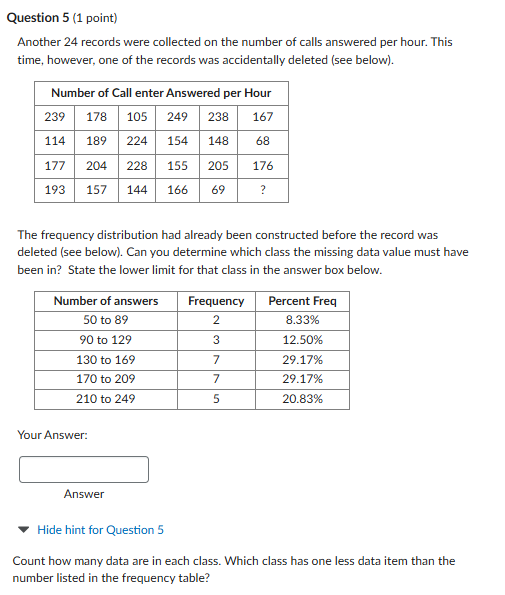
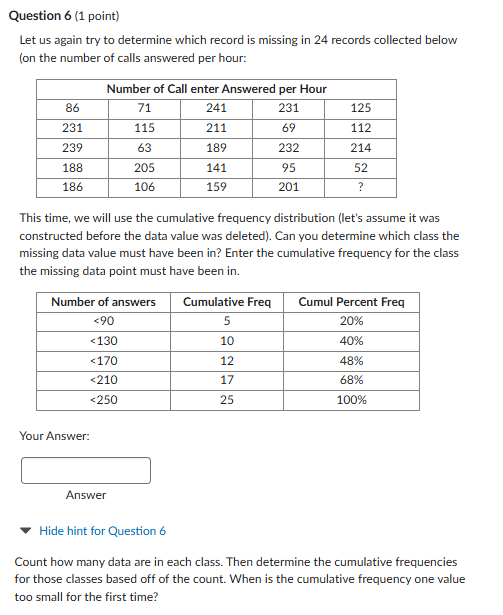
Online HW 3: Frequency Dist., Histogram and Boxplots Page 1: Previous Page Next Page Page 1 of 15 1 Question 1 (1 point) Page 2: Bill Carter, the manager of Rent-A-Wheels car rentals company has determined that he must rent an average of 15 cars per day to turn a profit. His accountant has randomly selected 30 daily records of rentals and obtained the numbers of cars per day shown below: Page 3: Number of Cars Rented per Day 3 2 2 2 3 5 6 6 6 6 6 Page 4: 7 7 7 9 9 10 10 11 13 13 14 15 17 17 17 19 19 20 21 22 Page 5: A frequency distribution was constructed based off of the above data. Number of rentals Frequency Percent Freq Page 6: 0 to 4 ? 13.33%% 5 to 9 11 36.67% I 10 to 14 6 20% 15 to 19 6 20% Page 7: 20 to 24 3 10% 7 What is the missing value in the frequency table above? Page 8: Your Answer: 8 Page 9: Answer Hide hint for Question 1 Page 10: Count how many data are between the lower and upper limit in the class with the missing frequency. 10Question 10 (1 point) You have decided to buy a house in New Westminster. 75 selling prices of houses listed for sale in New Westminster were collected (as of January 11, 2024). You can view the data here: Click here to download the data Calculate the five number summary for this data. What is the value of the lower limit? Round your answer to 2 decimal places. Your Answer: Answer w Hide hint for Question 10 First construct the five number summary (min, Q1, median, Q3, max). Then, determine the IQR = Q3 - Q1. Finally, get the lower limit by calculating Q1 - 1.5*I1QR Question 11 (1 point) Let us again work with the selling prices of 75 houses listed for sale in New Westminster. Click here to download the data. This time, let's construct a histogram of these prices using Excel's 'Insert Statistics Chart' under the 'Insert' tab (and chart options). Which of the histograms below matches the histogram you built? OaJ Histogram of Prices 25 [ 61,756,600.00 .. [ $3,056,600.00 .. [ $1,106,600.00 ... [ $2,406,600.00 .. $3,706,600.00 .. Histogram of Prices [$1,788,353.00,... (53,148,953,00 .., [51,108,953.00 ... {52,468,953.00 ... [53,828,953.00 ... Histogram of Prices 25 20 15 10 w . | (51,812,412.00,.. [$3,132,412.00,.. [51,152,412.00 ... (52472,412.00,.. [ 53,792,412.00,.. Histogram of Prices an [ 51,803,857.00 ... {53,103, B67.00,... | 51,153,667.00 ... {52.453,867.00 ... [$3,753,867.00,... w Hide hint for Question 11 Match the heights of the bars in the frequency table to the counts in the frequency table. Question 12 (1 point) We are again, going to construct a histogram of the selling prices for the 75 homes in Mew Westminster but instead of using Excel's 'Insert Statistic Chart', we are going to construct our histogram using the frequency table from this data set (see below): Selling Prices 1000000 to 1499900 1500000 to 1999900 2000000 to 2499900 Frequency Percent Frequency 2500000 to 2999900 3000000 to 3499900 3500000 to 3999200 Totals Go to the 'FrequencyTable' tab in the data file you downloaded. Highlight the 'Selling Prices' column and 'Frequency' column, go to the 'Insert' tab in Excel and select Bar/Column Chart and then insert '2D Bar Chart' Which of the charts below matches your graph? Mote: you can make the bars look closer together by double clicking on any bar and choosing to decrease the gap width (suggested ~2%). Also note: You can create a similar chart by highlighting your original data and inserting a pivot chart, including your selling prices in the Rows and Values section and finally by grouping the selling prices (start at 1,000,000, increase by 500.000 and end at 4,000,000). O al i 1000000 10 1499900 Histogram of Prices 12 10 B b 2 0 1500000 10 1900900 2000000 te 2499900 2500000t 2009000 000000 1o 3409900 500000 1o SO00000 O b) Histogram of Prices 18 16 14 12 10 DO 1000000 to 15000 00 to 2000000 to 25000 00 to 3000000 to 3500000 to 1499900 1999900 2499900 2999900 3499900 3999900 O c) Histogram of Prices 18 16 14 12 10 Do 1000000 to 1500000 to 2000000 to 2500000 to 3000000 to 3500000 to 1499900 1999900 2499900 2990900 3499900 3999900O d) Histogram of Prices 18 16 14 12 10 1000000 to 15000 00 to 2000000 to 25000 00 to 3000000 to 3500000 to 1499900 1909900 2498900 2909900 3499900 3999900 Hide hint for Question 12 Match the heights of the bars in the frequency table to the counts in the frequency table.Question 13 (1 point) Let us finally construct a boxplot on the house price data. Click here to download the data To do this - highlight the data, go to the 'Insert' tab, select 'Insert Statistic Chart' and select the 'Box and Whisker' plot. Which of the boxplots below matches the graph you created? Note: You can display the values on your boxplot by doing the following: 1. Click on your chart (anywhere on the chart) 2. Click on the 'Design' tab up top 3. Select 'Add Chart Element' 4. Click on 'Data Labels' 5. Select 'Right' O a) Boxplot of Selling Prices 4000000 -3800947 3500000 3000000 3011274 2500000 X2473720-76 2478124 2000000 1965835 1500000 1111523 1000000 500000\fO d) Boxplot of Selling Prices 4500000 4000000 3869052 3500000 3265844 3000000 2500000 X2543334.933 2642438 2000000 1694283 1500000 1000000 1133594 500000 Hide hint for Question 13 Highlight the data. Then, go to the 'Insert' tab in Excel. Select 'Insert Statistics Chart' and then select the boxplot.Question 14 (12 points) Below are the boxplots of the test scores on a statistics test for three different sets of students: Sets A (blue), B(orange), C (grey) from left to right Test Scores for Sets A, B and C 100 100 100 84.25 90 80 77.5 X74.8 70 67 55.5 Marks SO 46.25 40 36 33 30 20 10 (a) Overall, which set performed the best on the exam? Enter either A, B, or C. [1 mark] Which set has the biggest IQR? Enter either A, B. or C [1 mark] (c) Which set has the highest percentage of failures? Enter either A, B, or C [1 mark] (d) Describe the shape of distribution for set A: A. Symmetrical B. Skewed left C. Skewed right Enter either A, B, or C. [1 mark]{e) Describe the shape of distribution for set B: A Symmetrical B. Skewed left C. Skewed right Enter either A, B, or C. [1 mark] L] {f} Describe the shape of distribution for set C: A Symmetrical B. Skewed left C. Skewed right Enter either A, B, or C. [1 mark] L) {g) What percentage of students in set C has a test score higher than $4.25? Answer in % and 2 decimal places [1 mark] | {h) What percentage of students in set C has a test score of 78 or higher? Answer in % and 2 decimal places [1 mark] L ] (1) What percentage of students in set C has a test score above 46.25. Apswer in % and 2 decimal places [1 mark] L] (i) Calculate the lower limit for set A, Answer in 2 decimal places. | 2 marks] L] (k) Suppose a student in Set A obtained a score of 15%. Is this score an outlier? Enter either A B C D or E{1 mark] A Yes, it is above the lower limit B. Yes. it is below the lower limit C. No, it is above the lower limit D. Mo, it is below the lower limit E. Mone of the above is correct [ ] Question 2 (1 point) Another 30 days of rentals has been recorded for Rent-A-Wheels car rental company. Again, they must rent at least 15 cars per day to turn a profit. The frequency table is given again below for the number of rentals: Mumber of rentals Frequency Percent Freq Otod 2 5.67% 5to 9 33.33% 10to 14 13.33% 15t0 19 20to 24 What percentage of the time does Rent-A-Wheels turn a profit? Round your answer to 2 decimal places. Your Answer: Answer units w Hide hint for Question 2 Count how many days the number of rentals is at least 15. Question 3 (1 point) Mandeep, the owner of Threadly, a weighted blanket sales company has recorded the last 25 monthly records of sales and obtained the numbers of weighted blankets per month shown below: Mumber of Weighted blankets Sold per Month 57 151 Mumber of sales Frequency Percent Freq 50 to 89 11 44% 20 to 129 5 20% 130 to 169 4 ? 170 to 209 2 8% 210 to 249 3 12% What is the missing value in the frequency table above? Round your answer to 2 decimal places if needed. Your Answer: Answer units # Hide hint for Question 3 Divide the frequency by the total number of data and multiply by 100 to get the percentage. Question 4 (1 point) Ivan, the manager of Call Waiting, a call center company, has determined that they must answer an average of 180 calls per hour to meet the demand [number of calls coming in). His intern has randomly selected 30 hourly records and obtained the number of calls answered per hour. These values are shown in the table below: Mumber of Call enter Answered per Hour 171 236 58 168 218 149 [ 131 140 150 199 119 73 182 a5 232 224 228 157 182 136 77 224 209 202 122 206 234 a7 98 A frequency distribution was constructed based off of the above data. Mumber of answers Frequency Percent Freq 170 to 209 210 to 249 50to? & 20% 90 to 129 3 10% 130 to 169 7 7 23.33% What is the missing value in the frequency table above? Your Answer: L] Answer w Hide hint for Question 4 Method 1:Determine the width of each class by subtracting the lower limits (or upper limits). Take that width, add it to the lower limit and subtract 1 from it. Method 2: Subtract 1 from the lower limit of the next class. Question 5 (1 point) Another 24 records were collected on the number of calls answered per hour. This time, however. one of the records was accidentally deleted (see below). Mumber of Call enter Answered per Hour 167 68 EARIEACIE The frequency distribution had already been constructed before the record was deleted (see below). Can you determine which class the missing data value must have been in? State the lower limit for that class in the answer box below. Mumber of answers Frequency Percent Freq 50 to 8% 2 B.33% 0 to 129 130 to 169 170 to 209 7 2917% 210 to 249 5 20.83% Your Answer: Answer w Hide hint for Question 5 Count how many data are in each class. Which class has one less data item than the number listed in the frequency table? Question 6 (1 point) Let us again try to determine which record is missing in 24 records collected below [on the number of calls answered per hour: Mumber of Call enter Answered per Hour This time, we will use the cumulative frequency distribution (let's assume it was constructed before the data value was deleted). Can you determine which class the missing data value must have been in? Enter the cumulative frequency for the class the missing data point must have been in. Mumber of answers Cumulative Freq Cumul Percent Freq
Step by Step Solution
There are 3 Steps involved in it
Step: 1
Get Instant Access to Expert-Tailored Solutions
See step-by-step solutions with expert insights and AI powered tools for academic success
Step: 2
Step: 3
Ace Your Homework with AI
Get the answers you need in no time with our AI-driven, step-by-step assistance