ONLY ANSWER Q6
HUBB, Inc. is keen on acquiring Compac, Inc., a privately-owned consumer electronics and computer retail company. As a hired consultant, your role is to assist HUBB, Inc. in this acquisition process. To accomplish this, please address the following requirements:
1. Perform a comprehensive ratio analysis for Compac, Inc.
a- Compute six financial ratios for the year 2023, covering three profitability ratios (including ROA and ROE/ROCE) and three risk analysis ratios.
b- Utilize data from the past four years to carry out a financial ratio analysis for the company. Contrast Compac's 2023 ratios with industry benchmarks; identify and discuss any discrepancies while offering a thoughtful analysis
2. Develop cash flow statements.
a- Cash flow statements for the period from 2024 to 2028.
b- Evaluate the quality of earnings for the projected years.
3. Compute the Free Cash Flow for the years 2024 through 2028.
a- Free Cash Flow to Equity (FCFE)
b- Free Cash Flow to Firm (FCFF)
4. Estimate Compac, Inc.'s stock intrinsic value in 2023 utilizing the following valuation models:
a- Dividend Discount Model (DDM),
b- Discounted Cash Flow (DCF), and
c- Residual Income Model (RIM) valuation methods.
5. Establish the company's stock value in 2023 using Comparable Company Analysis (Comps). Utilize at least three valuation ratios like EV/Revenue, Price/Sales, Price/Book Value, and Price/Earnings for this purpose.
6. Based on your valuation results, offer a recommendation on whether to proceed with the acquisition. Make sure to substantiate your recommendation with a thorough discussion. (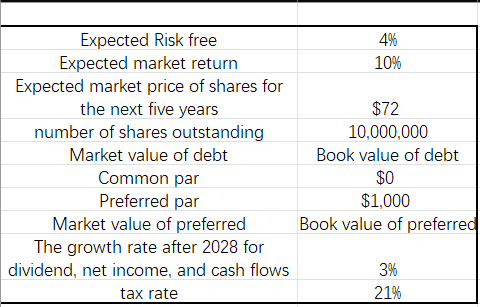


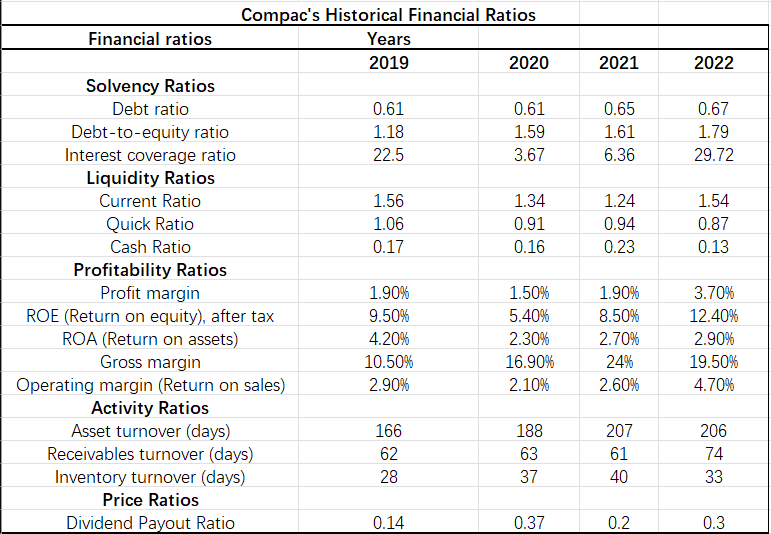
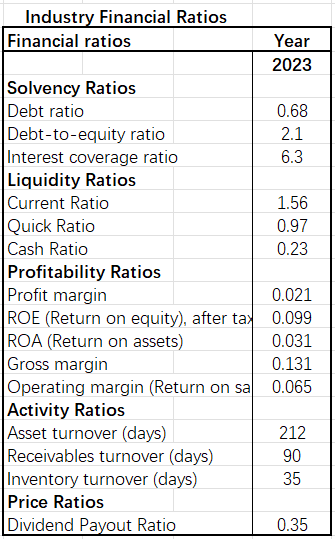
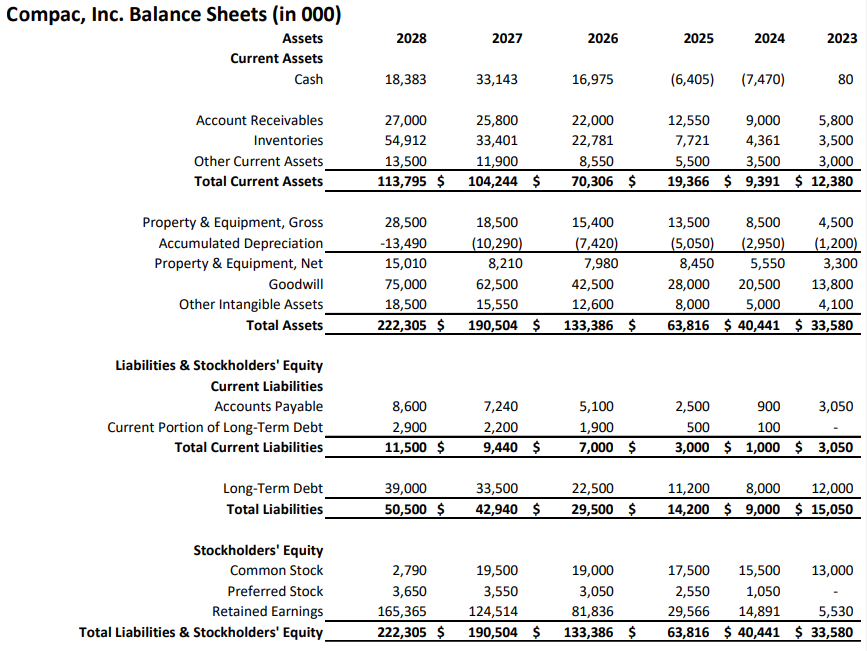
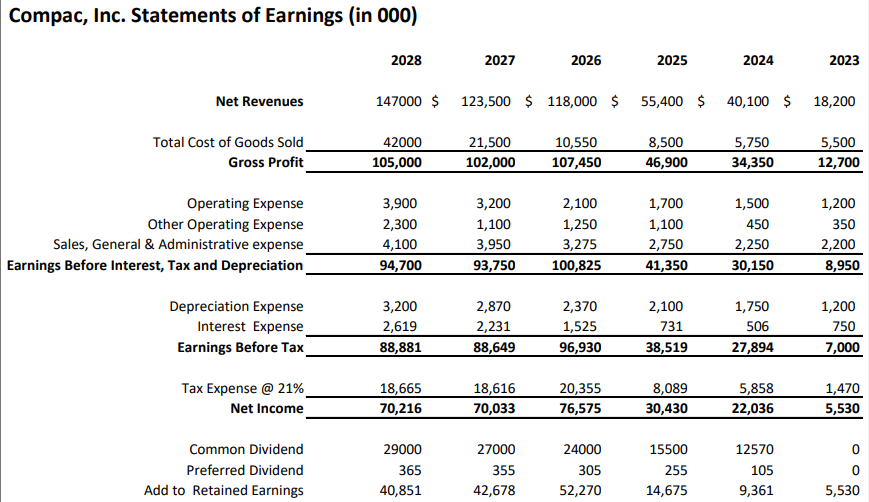
\begin{tabular}{|c|c|} \hline Expected Risk free & 4% \\ \hline Expected market return & 10% \\ \hline Expected market price of shares for & \\ the next five years & $72 \\ \hline number of shares outstanding & 10,000,000 \\ \hline Market value of debt & Book value of debt \\ Common par & $0 \\ \hline Preferred par & $1,000 \\ \hline Market value of preferred & Book value of preferred \\ \hline The growth rate after 2028 for & 3% \\ \hline dividend, net income, and cash flows & 21% \\ \hline tax rate & \\ \hline \end{tabular} Industry Average Beta Information Market Multiple Valuation Data Compac's Historical Financial Ratios \begin{tabular}{|c|c|c|c|c|} \hline Financial ratios & Years & & & \\ \hline & 2019 & 2020 & 2021 & 2022 \\ \hline Solvency Ratios & & & & \\ \hline Debt ratio & 0.61 & 0.61 & 0.65 & 0.67 \\ \hline Debt-to-equity ratio & 1.18 & 1.59 & 1.61 & 1.79 \\ \hline Interest coverage ratio & 22.5 & 3.67 & 6.36 & 29.72 \\ \hline Liquidity Ratios & & & \\ \hline Current Ratio & 1.56 & 1.34 & 1.24 & 1.54 \\ \hline Quick Ratio & 1.06 & 0.91 & 0.94 & 0.87 \\ \hline Cash Ratio & 0.17 & 0.16 & 0.23 & 0.13 \\ \hline Profitability Ratios & & & \\ \hline Profit margin & 1.90% & 1.50% & 1.90% & 3.70% \\ \hline ROE (Return on equity), after tax & 9.50% & 5.40% & 8.50% & 12.40% \\ \hline ROA (Return on assets) & 4.20% & 2.30% & 2.70% & 2.90% \\ \hline Gross margin & 10.50% & 16.90% & 24% & 19.50% \\ \hline Operating margin (Return on sales) & 2.90% & 2.10% & 2.60% & 4.70% \\ \hline Activity Ratios & & & & \\ \hline Asset turnover (days) & 166 & 188 & 207 & 206 \\ \hline Receivables turnover (days) & 62 & 63 & 61 & 74 \\ \hline Inventory turnover (days) & 28 & 37 & 40 & 33 \\ \hline Price Ratios & 0.14 & 0.37 & 0.2 & 0.3 \\ \hline \end{tabular} Industry Financial Ratios \begin{tabular}{|l|c|} \hline Financial ratios & Year \\ \hline & 2023 \\ \hline Solvency Ratios & \\ Debt ratio & 0.68 \\ Debt-to-equity ratio & 2.1 \\ Interest coverage ratio & 6.3 \\ Liquidity Ratios & \\ Current Ratio & 1.56 \\ Quick Ratio & 0.97 \\ Cash Ratio & 0.23 \\ Profitability Ratios & \\ Profit margin & 0.021 \\ ROE (Return on equity), after tax & 0.099 \\ ROA (Return on assets) & 0.031 \\ Gross margin & 0.131 \\ Operating margin (Return on sa & 0.065 \\ Activity Ratios & \\ Asset turnover (days) & 212 \\ Receivables turnover (days) & 90 \\ Inventory turnover (days) & 35 \\ Price Ratios & \\ Dividend Payout Ratio & 0.35 \\ \hline \end{tabular} Compac, In Compac, Inc. Statements of Earnings (in 000) \begin{tabular}{|c|c|} \hline Expected Risk free & 4% \\ \hline Expected market return & 10% \\ \hline Expected market price of shares for & \\ the next five years & $72 \\ \hline number of shares outstanding & 10,000,000 \\ \hline Market value of debt & Book value of debt \\ Common par & $0 \\ \hline Preferred par & $1,000 \\ \hline Market value of preferred & Book value of preferred \\ \hline The growth rate after 2028 for & 3% \\ \hline dividend, net income, and cash flows & 21% \\ \hline tax rate & \\ \hline \end{tabular} Industry Average Beta Information Market Multiple Valuation Data Compac's Historical Financial Ratios \begin{tabular}{|c|c|c|c|c|} \hline Financial ratios & Years & & & \\ \hline & 2019 & 2020 & 2021 & 2022 \\ \hline Solvency Ratios & & & & \\ \hline Debt ratio & 0.61 & 0.61 & 0.65 & 0.67 \\ \hline Debt-to-equity ratio & 1.18 & 1.59 & 1.61 & 1.79 \\ \hline Interest coverage ratio & 22.5 & 3.67 & 6.36 & 29.72 \\ \hline Liquidity Ratios & & & \\ \hline Current Ratio & 1.56 & 1.34 & 1.24 & 1.54 \\ \hline Quick Ratio & 1.06 & 0.91 & 0.94 & 0.87 \\ \hline Cash Ratio & 0.17 & 0.16 & 0.23 & 0.13 \\ \hline Profitability Ratios & & & \\ \hline Profit margin & 1.90% & 1.50% & 1.90% & 3.70% \\ \hline ROE (Return on equity), after tax & 9.50% & 5.40% & 8.50% & 12.40% \\ \hline ROA (Return on assets) & 4.20% & 2.30% & 2.70% & 2.90% \\ \hline Gross margin & 10.50% & 16.90% & 24% & 19.50% \\ \hline Operating margin (Return on sales) & 2.90% & 2.10% & 2.60% & 4.70% \\ \hline Activity Ratios & & & & \\ \hline Asset turnover (days) & 166 & 188 & 207 & 206 \\ \hline Receivables turnover (days) & 62 & 63 & 61 & 74 \\ \hline Inventory turnover (days) & 28 & 37 & 40 & 33 \\ \hline Price Ratios & 0.14 & 0.37 & 0.2 & 0.3 \\ \hline \end{tabular} Industry Financial Ratios \begin{tabular}{|l|c|} \hline Financial ratios & Year \\ \hline & 2023 \\ \hline Solvency Ratios & \\ Debt ratio & 0.68 \\ Debt-to-equity ratio & 2.1 \\ Interest coverage ratio & 6.3 \\ Liquidity Ratios & \\ Current Ratio & 1.56 \\ Quick Ratio & 0.97 \\ Cash Ratio & 0.23 \\ Profitability Ratios & \\ Profit margin & 0.021 \\ ROE (Return on equity), after tax & 0.099 \\ ROA (Return on assets) & 0.031 \\ Gross margin & 0.131 \\ Operating margin (Return on sa & 0.065 \\ Activity Ratios & \\ Asset turnover (days) & 212 \\ Receivables turnover (days) & 90 \\ Inventory turnover (days) & 35 \\ Price Ratios & \\ Dividend Payout Ratio & 0.35 \\ \hline \end{tabular} Compac, In Compac, Inc. Statements of Earnings (in 000)


