only I need the answer no need to explain only the answer
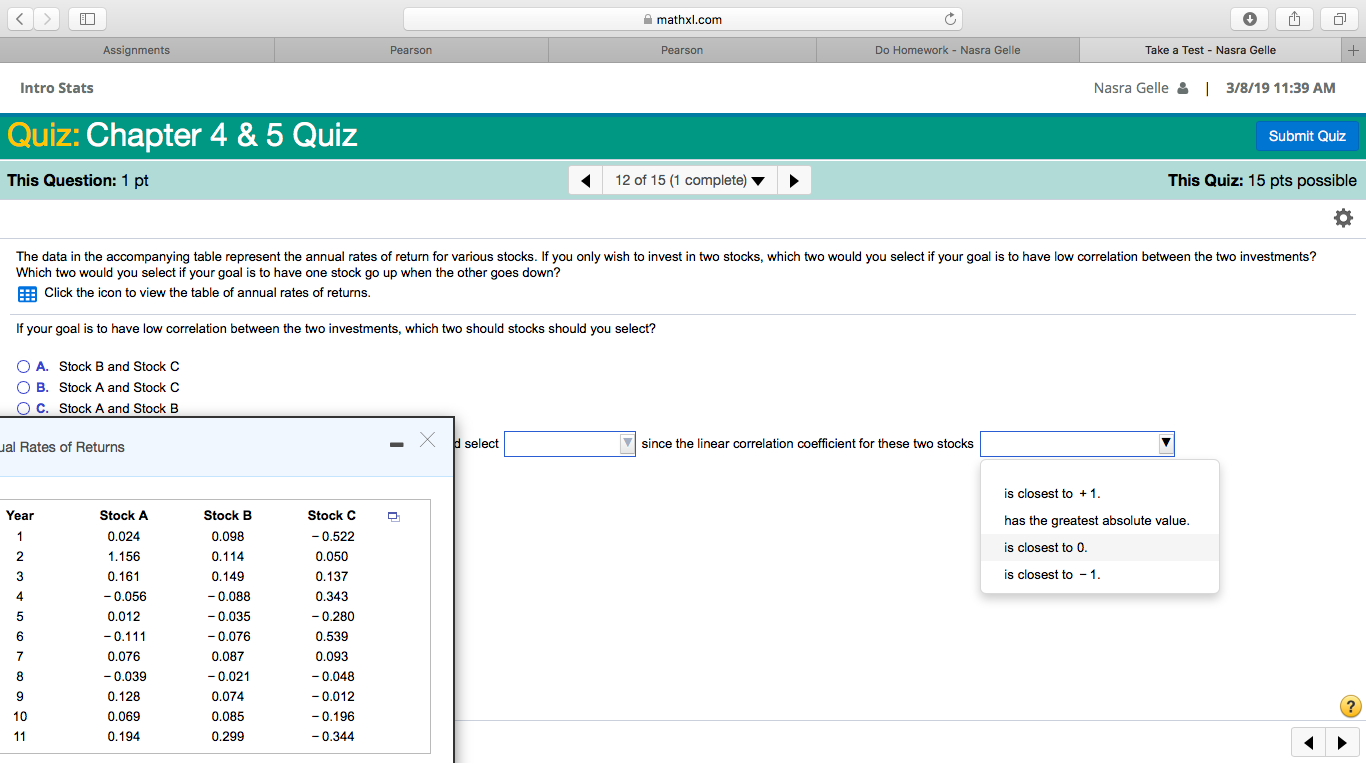
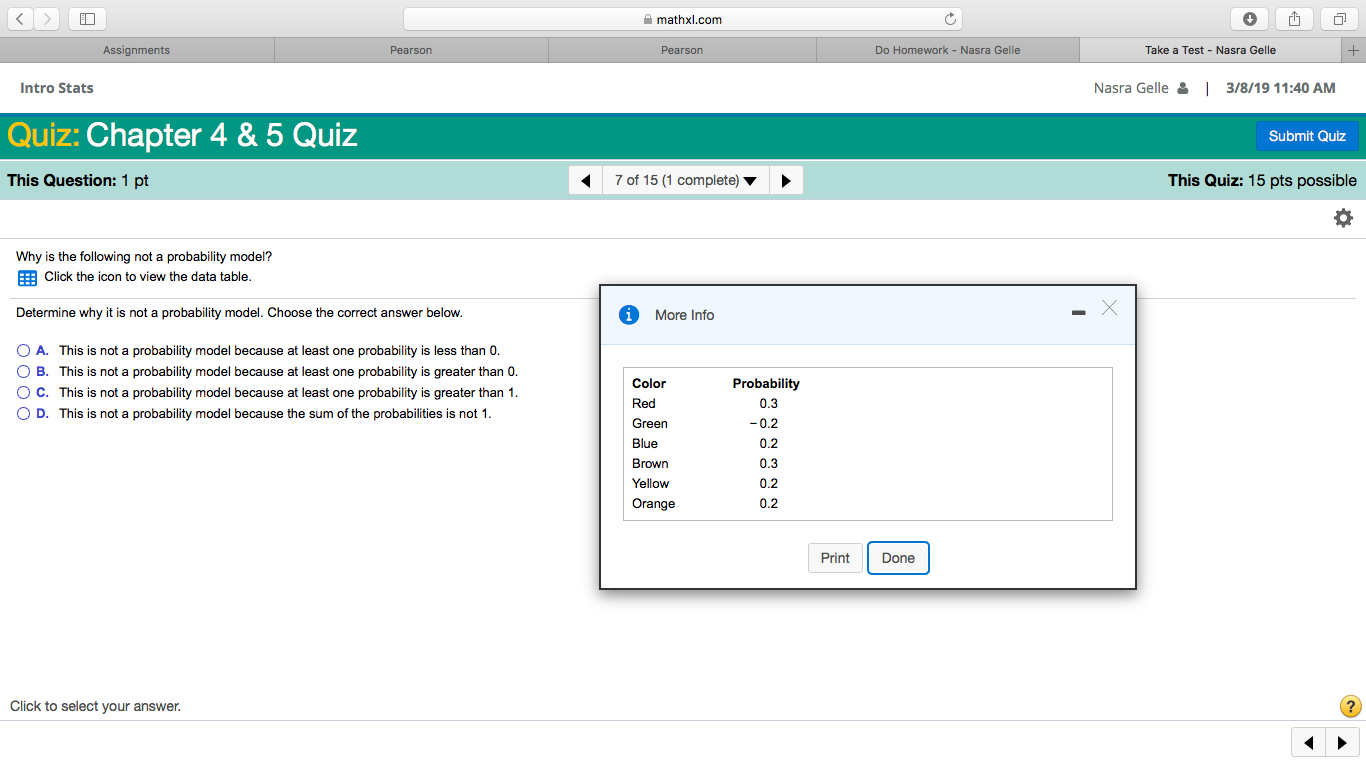
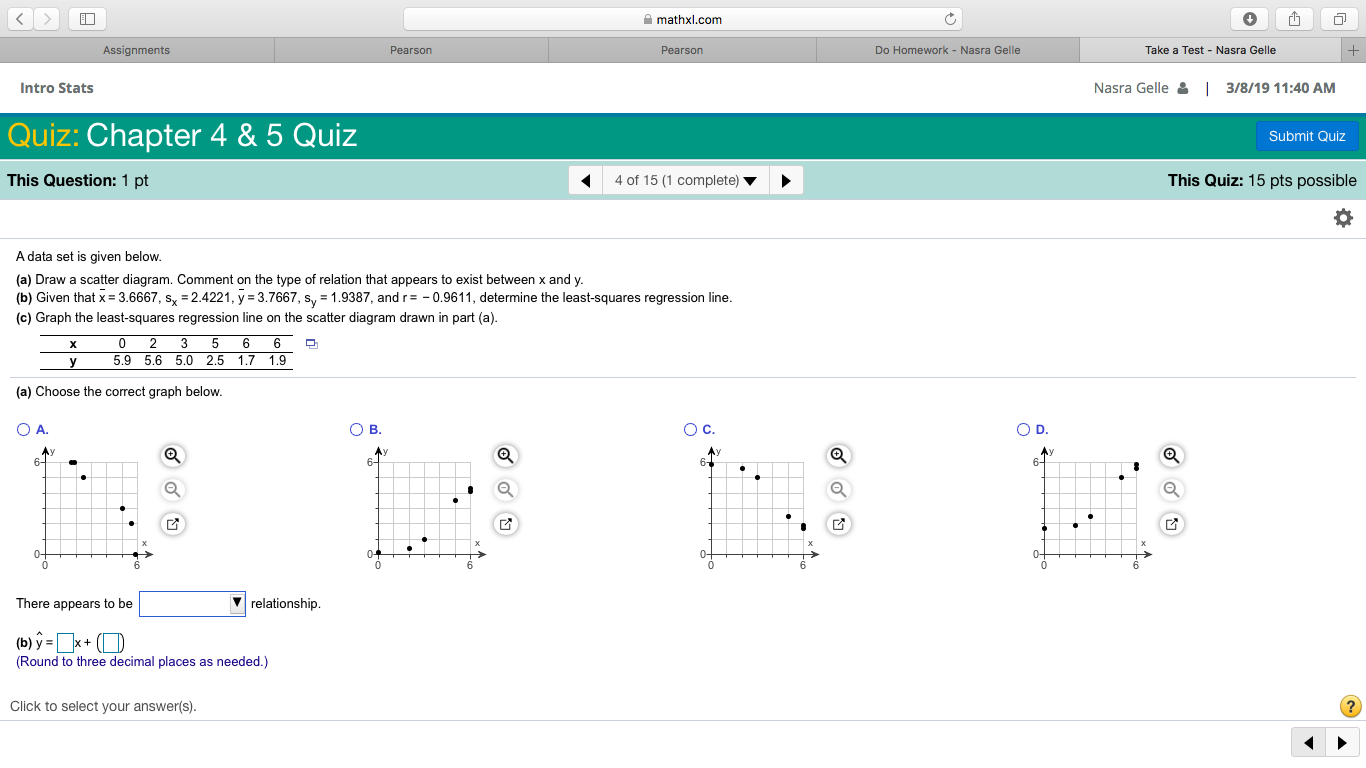
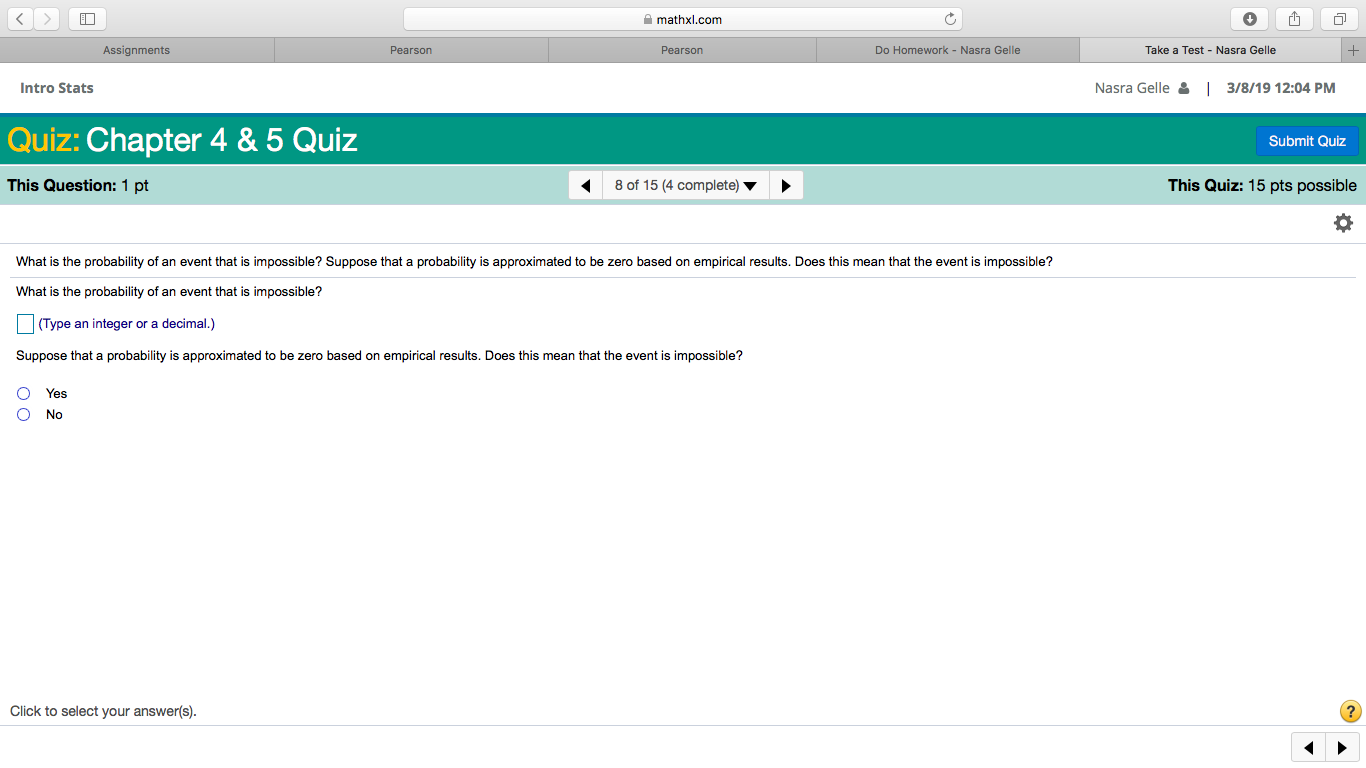
|| ED A mathxl . com Assignments Pearson Pearson DO Homework - Nasra Gelle Take a Test - Nasia Gelle + Intro Stats Nasra Gelle = 1 3/8 /19 11:39 AM out` Chequer { {` @^` This Question : 1 pt 1 / 12 of 15 ( 1 complete ) +| } This Quiz : 15 pts possible The data in the accompanying table represent the annual rates of return for various stocks . If you only wish to invest in two stacks , which two would you select if your goal is to have low correlation between the two investments ? Which two would you select if your goal is to have one stock go up when the other goes down ? Click the icon to view the table of annual rates of returns . If your goal is to have low correlation between the two investments , which two should stocks should you select ? OA. Stock Band Stock C OB. Stock A and Stock C OC. Stock A and Stock B Ial Plates of Returns - X \\} select* \\*\\ since the linear correlation coefficient for these two stocks is closest to + 1 . Year Stock A Stock B Stock C 0. 024 0. 098 - 0.522 has the greatest absolute value . 1. 156 0. 1 14 0. 050 is closest to O 0. 161 0 . 149 0. 137 is closest to - 1 . - 0.056 - 0.OBD 0. 343 0. 012 - 0.035 - 0. 280 - 0. 191 - 0. 076 0. 539 0. 076 0. 087 9.093 8 - 0.039 - 0.021 - 0.048 0. 128 0. 074 - 0.012 10 0. 069 0. 085 - 0. 196 11 0. 194 9.299 - 0. 34 4 mathxl.com ch Assignments Pearson Pearson Do Homework - Nasra Gelle Take a Test - Nasra Gelle Intro Stats Nasra Gelle & | 3/8/19 11:40 AM Quiz: Chapter 4 & 5 Quiz Submit Quiz This Question: 1 pt 7 of 15 (1 complete) This Quiz: 15 pts possible Why is the following not a probability model? Click the icon to view the data table. Determine why it is not a probability model. Choose the correct answer below. i More Info X O A. This is not a probability model because at least one probability is less than 0. O B. This is not a probability model because at least one probability is greater than 0. O C. This is not a probability model because at least one probability is greater than 1. Color Probability O D. This is not a probability model because the sum of the probabilities is not 1. Red 0.3 Green -0.2 Blue 0.2 Brown 0.3 Yellow 0.2 Orange 0.2 Print Done Click to select your answer. ?A mathxl . com Assignments Pearson Pearson DO Homework - Nasra Gelle Take a Test - Nasia Gelle + Intro Stats Nasra Gelle = 1 3/8 / 19 11:40 AM out` Choppier 4 8 6 Quiz This Question : 1 pt 1 | 4 of 15 ( 1 complete ) ~| } This Quiz : 15 pts possible A data set is given below . ( a ) Draw a scatter diagram . Comment on the type of relation that appears to exist between * and * .* ( 6 ) Given that * = 3. 6567 . 5 x = 2.4221 , Y = 3.7667 , 5, = 1.9387 , and r = - 0. 961 1 , determine the least - squares regression line . ( C ) Graph the least- squares regression line on the scatter diagram drawn in part ( a ) ." 5.9 5.6 5.0 2.5 1.7 1.9 ( a ) Choose the correct graph below ." QA . OB. OC. OD . 6 0 Q Q Q Q ` x' Of There appears to be* *\\ relationship . ( b ) Y = [* + [ D] Round to three decimal places as needed . !' Click to select your answer('s ) .T 7 C] | amammm (3| Egg] Intro Stats Nasra Gelle & | 3mm 12:04PM apter 4 8. 5 QUiZ Submituiz What is the probability of an event that is impossible? Suppose that a prohmility is approximated to be zero based on empirical results Does this mean that the event is impossible? What is the probability of an event that is impossible? (Type an integer or a deeimaL) Suppose that a probability is approximated to be zero based on empirical results Does this mean that the event is impossible? OYes ONO Click to select your anaweda). 6